
Upwards movement continued as the main Elliott wave count expected. The target remains the same.
Summary: A close above resistance at 2,815 (November 2018 highs) on an upwards day with support from volume is a classic upwards breakout, and requires the Elliott wave count to be reconsidered.
A third wave up may now gather strength. A new mid term target is at 3,010. The final target remains the same at 3,045.
New updates to this analysis are in bold.
The biggest picture, Grand Super Cycle analysis, is here.
Last published monthly charts are here. Video is here.
ELLIOTT WAVE COUNTS
WEEKLY CHART
Click chart to enlarge.
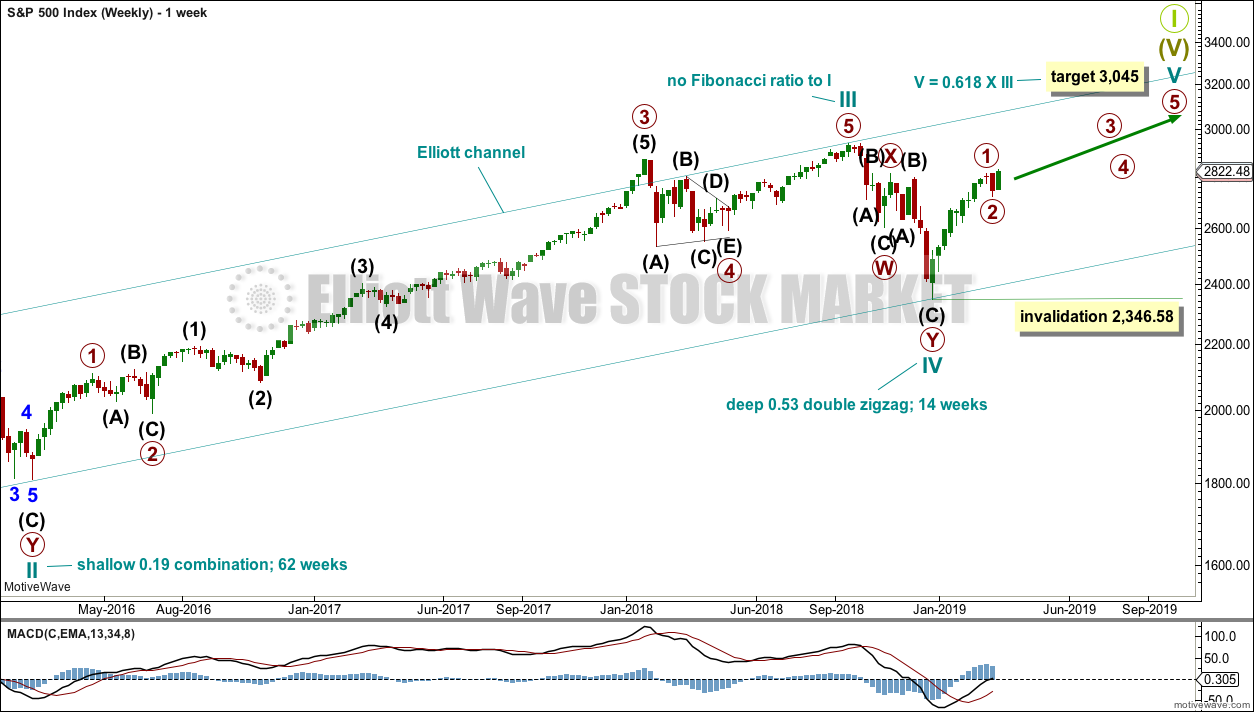
This weekly chart shows all of cycle waves III, IV and V so far.
Cycle wave II fits as a time consuming double combination: flat – X – zigzag. Combinations tend to be more time consuming corrective structures than zigzags. Cycle wave IV has completed as a multiple zigzag that should be expected to be more brief than cycle wave II.
Cycle wave IV may have ended at the lower edge of the Elliott channel.
Within cycle wave V, no second wave correction may move beyond the start of its first wave below 2,346.58.
Although both cycle waves II and IV are labelled W-X-Y, they are different corrective structures. There are two broad groups of Elliott wave corrective structures: the zigzag family, which are sharp corrections, and all the rest, which are sideways corrections. Multiple zigzags belong to the zigzag family and combinations belong to the sideways family. There is perfect alternation between the possible double zigzag of cycle wave IV and the combination of cycle wave II.
Although there is gross disproportion between the duration of cycle waves II and IV, the size of cycle wave IV in terms of price makes these two corrections look like they should be labelled at the same degree. Proportion is a function of either or both of price and time.
Draw the Elliott channel about Super Cycle wave (V) with the first trend line from the end of cycle wave I (at 2,079.46 on the week beginning 30th November 2014) to the high of cycle wave III, then place a parallel copy on the low of cycle wave II. Cycle wave V may find resistance about the upper edge.
It is possible that cycle wave V may end in October 2019. If it does not end there, or if the AD line makes new all time highs during or after June 2019, then the expectation for cycle wave V to end would be pushed out to March 2020 as the next possibility. Thereafter, the next possibility may be October 2020. March and October are considered as likely months for a bull market to end as in the past they have been popular. That does not mean though that this bull market may not end during any other month.
MAIN WAVE COUNT
DAILY CHART
Click chart to enlarge.
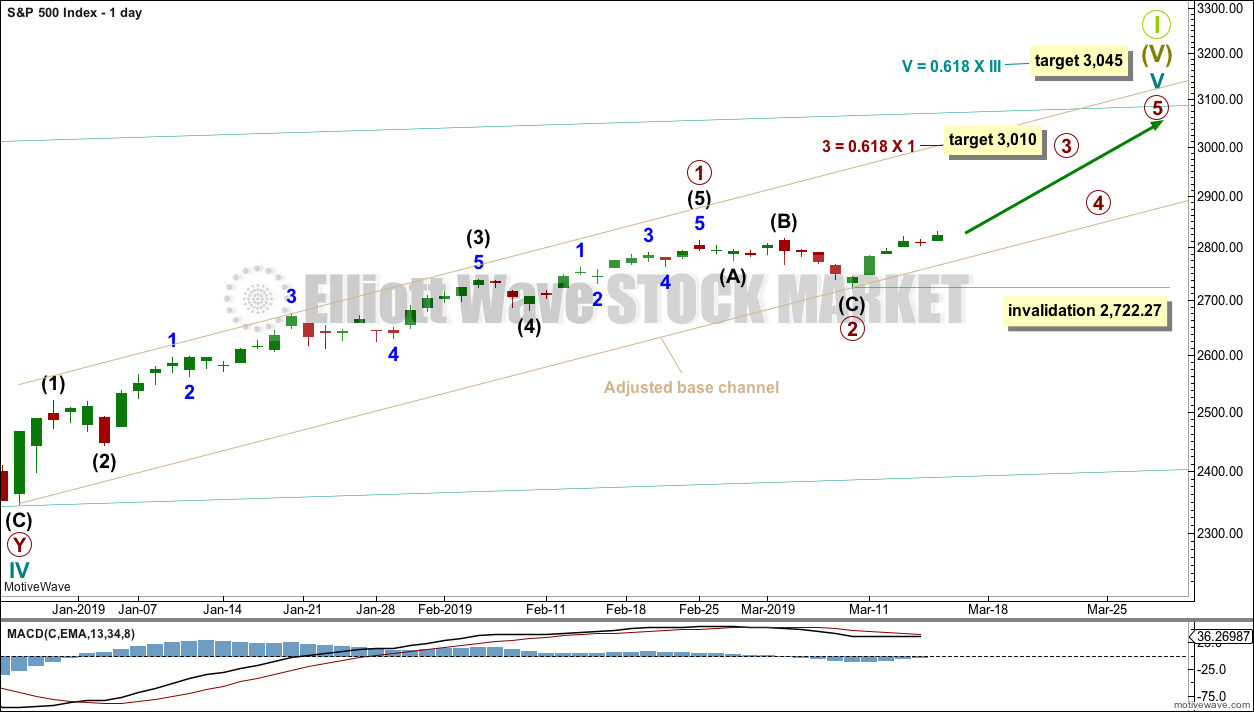
The daily chart will focus on the structure of cycle wave V.
Within Super Cycle wave (V), cycle wave III may not be the shortest actionary wave. Because cycle wave III is shorter than cycle wave I, this limits cycle wave V to no longer than equality in length with cycle wave III at 3,477.39. A target is calculated for cycle wave V to end prior to this point.
Cycle wave V must subdivide as a five wave motive structure, either an impulse or an ending diagonal. An impulse is much more common and that will be how it is labelled. A diagonal would be considered if overlapping suggests it.
At the end of this week, Friday has closed at 2,822.48 on an upwards day with support from volume. This close is above the recovery swing high within cycle wave IV on November 2018 at 2,815.15. This classic upwards breakout above resistance indicates underlying strength. This may be the early stage of a third wave. Primary waves 1 and 2 may both be over. Primary wave 2 may have been a very brief and shallow expanded flat correction.
Primary wave 3 may now exhibit an increase in upwards momentum. A target is calculated that fits with the higher target for cycle wave V to end.
Within primary wave 3, no second wave correction may move beyond the start of its first wave below 2,722.27.
The lower edge of the adjusted base channel is copied over from the daily chart. This may provide support for pullbacks along the way up.
HOURLY CHART
Click chart to enlarge.
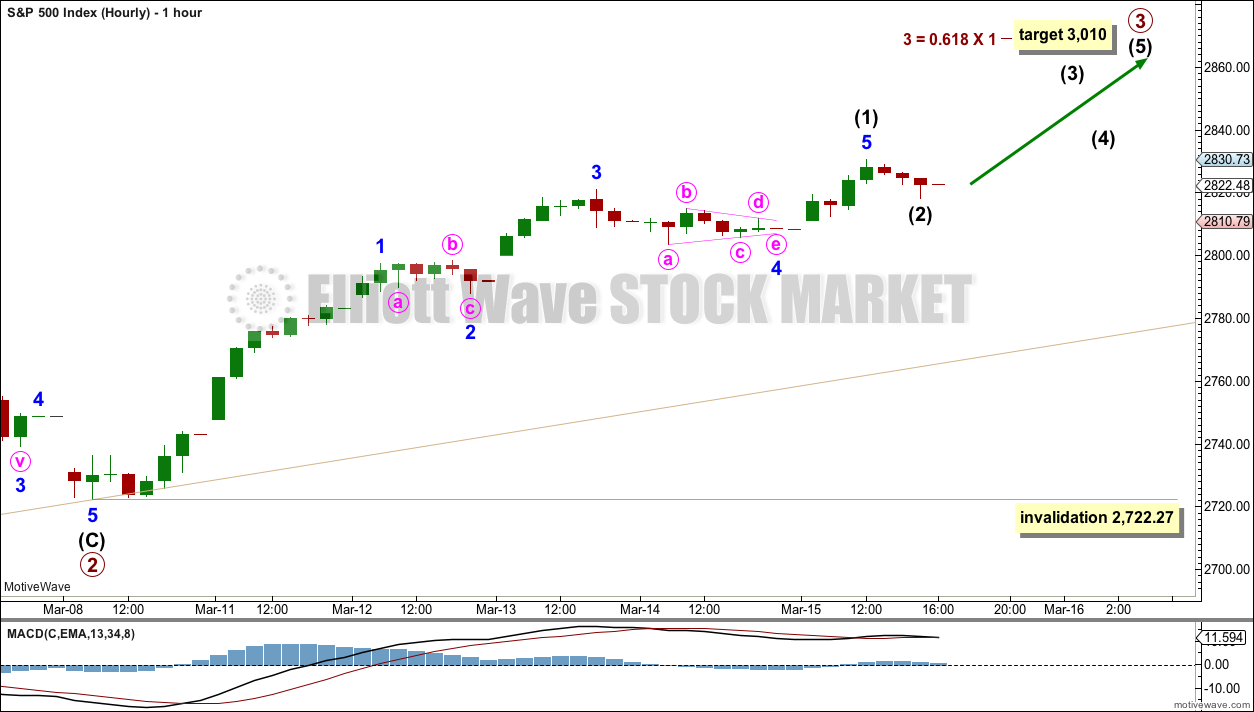
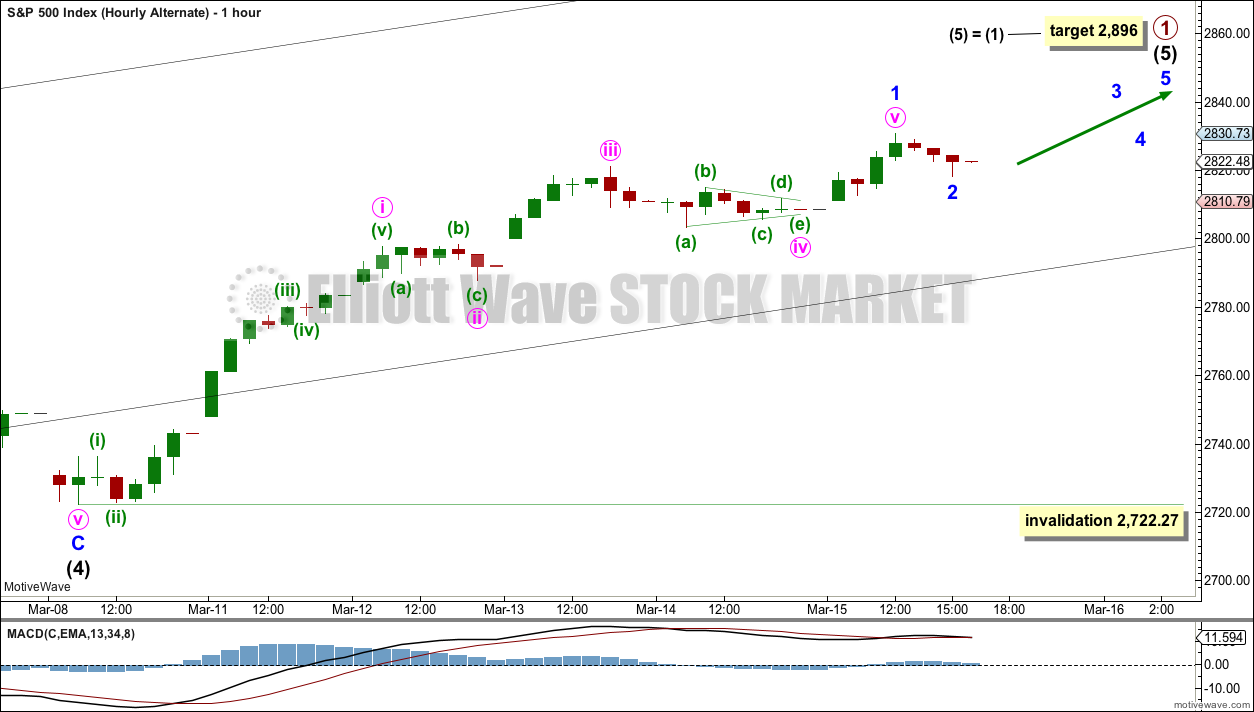
Primary wave 3 may only subdivide as an impulse. Within the impulse, intermediate waves (1) and (2) may now both be complete.
Intermediate wave (3) within primary wave 3 should exhibit strong momentum.
Intermediate wave (2) may be over. Now that resistance at 2,815 has been broken this area may provide support and force intermediate wave (2) to be very brief.
If it does continue further, then intermediate wave (2) may not move beyond the start of intermediate wave (1) below 2,722.27.
ALTERNATE WAVE COUNT
DAILY CHART
Click chart to enlarge.
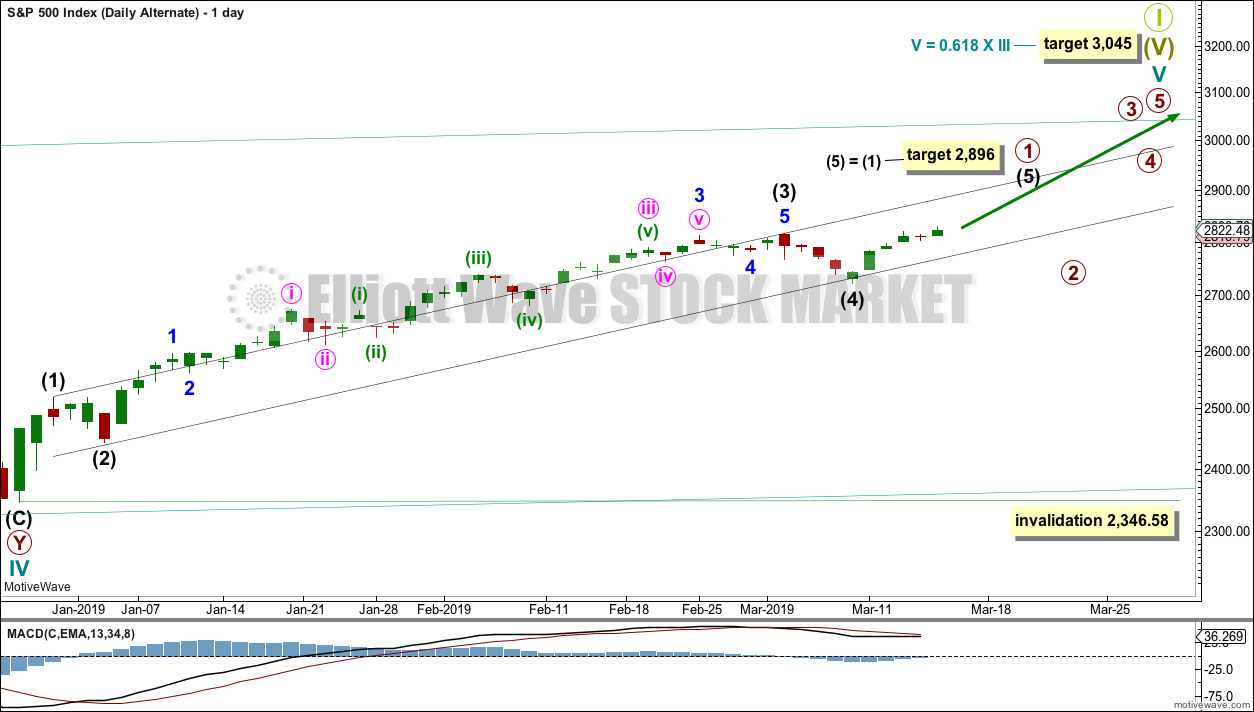
It remains possible that primary wave 2 has not yet arrived.
Primary wave 1 may be a very long extended impulse. Within primary wave 1, there is no adequate Fibonacci ratio between intermediate waves (1) and (3). Intermediate wave (5) would more likely exhibit a Fibonacci ratio to intermediate ave (1), and the most common ratio is equality.
A channel is drawn about primary wave 1 using Elliott’s first technique. If the lower edge of the channel is breached by a full daily candlestick below and not touching the lower edge, that may indicate primary wave 1 may be over and primary wave 2 may have begun.
Primary wave 2 may not move beyond the start of primary wave 1 below 2,346.58.
HOURLY CHART
Click chart to enlarge.
Within intermediate wave (5), minor wave 1 may be over at the last high.
Minor wave 2 would also likely be over, finding support about 2,815. Support here may be strong enough to force minor wave 2 to be relatively brief and shallow.
If minor wave 2 continues, then it may not move beyond the start of minor wave 1 below 2,722.27.
TECHNICAL ANALYSIS
WEEKLY CHART
Click chart to enlarge. Chart courtesy of et=”_blank”>StockCharts.com.
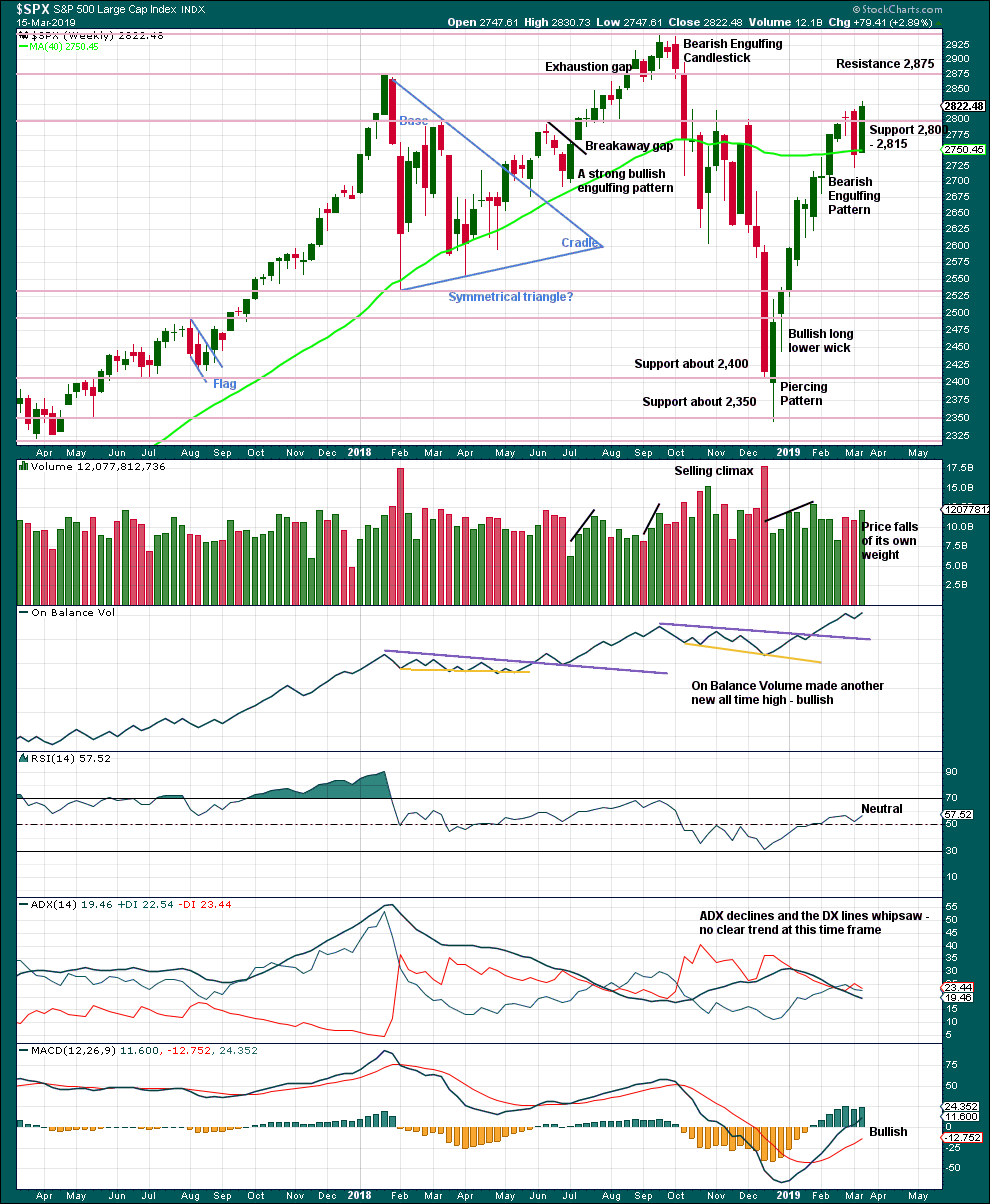
This week has seen a sharp reversal in price. A very strong bullish candlestick has support from volume, and closes above prior resistance at 2,815. This area may now offer support.
Next resistance is 2,875 and then at 2,940.
DAILY CHART
Click chart to enlarge. Chart courtesy of StockCharts.com.
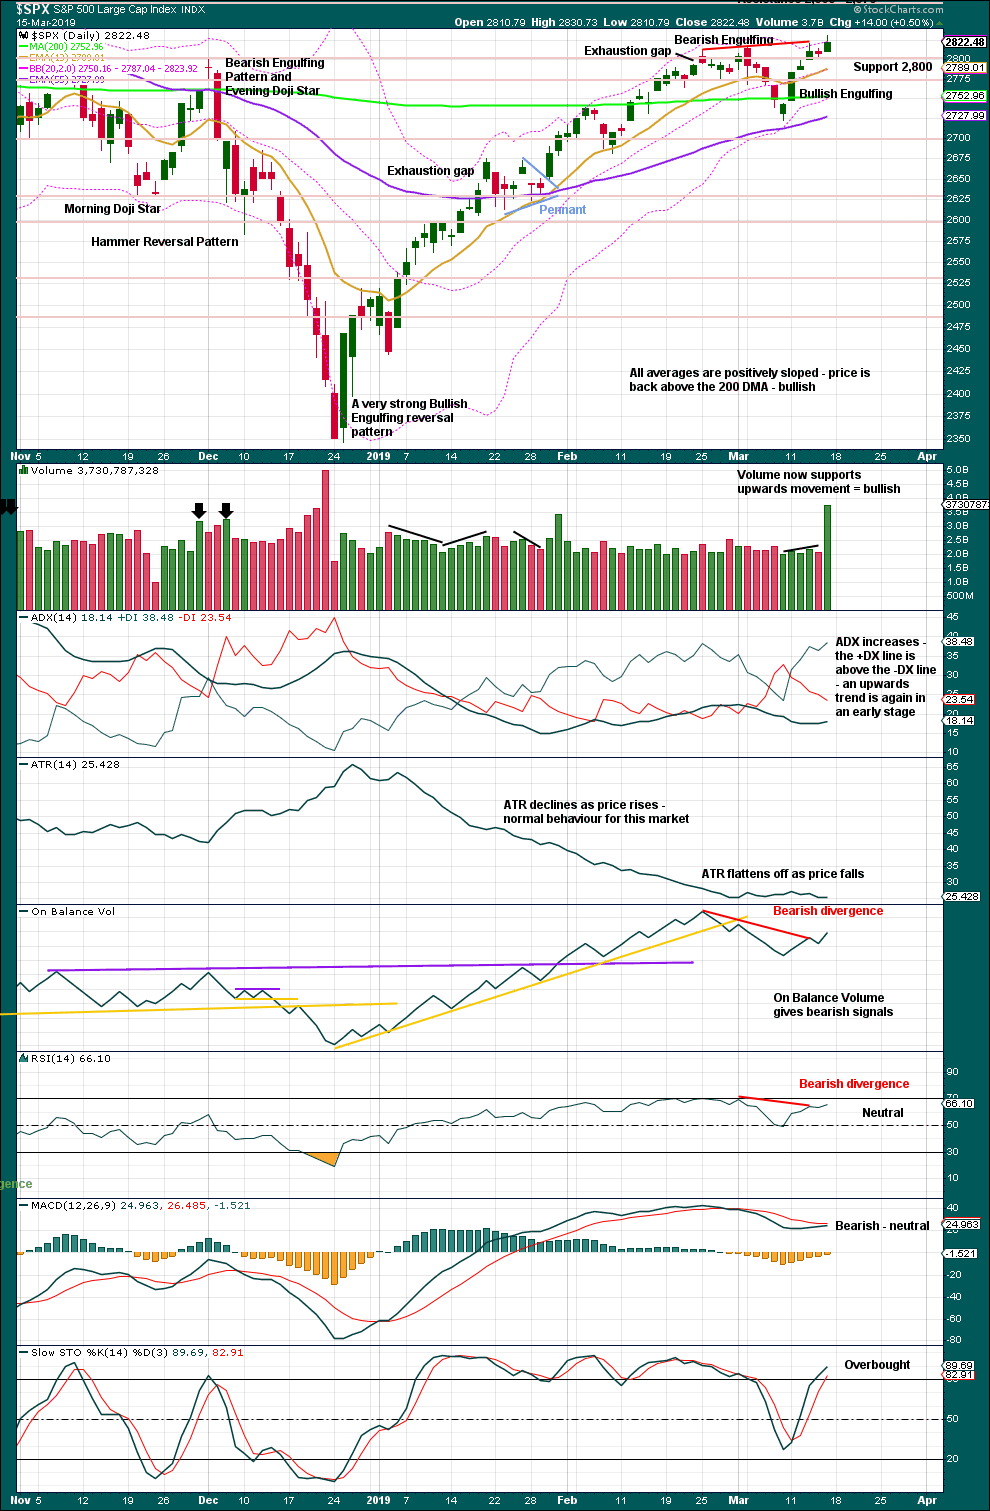
The December 2018 low is expected to remain intact. The two 90% upwards days on 26th December 2018 and 6th January 2019 indicate this upwards trend has internal strength.
A close above resistance at 2,815 on an upwards day, which has support from volume, is significant.
Bearish divergence between price and both of On Balance Volume and RSI remains. This may indicate the main Elliott wave count is wrong, or the divergence may just disappear.
Stochastics may remain extreme for long periods of time when markets trend strongly. Stochastics overbought here does not indicate upwards movement should end.
BREADTH – AD LINE
WEEKLY CHART
Click chart to enlarge. Chart courtesy of StockCharts.com. So that colour blind members are included, bearish signals
will be noted with blue and bullish signals with yellow.
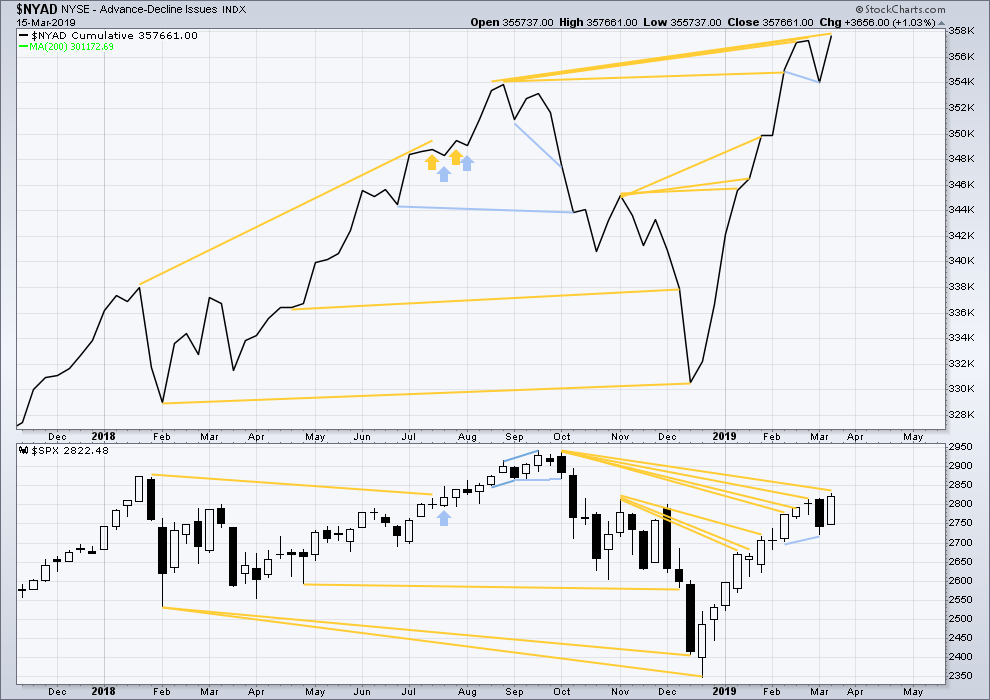
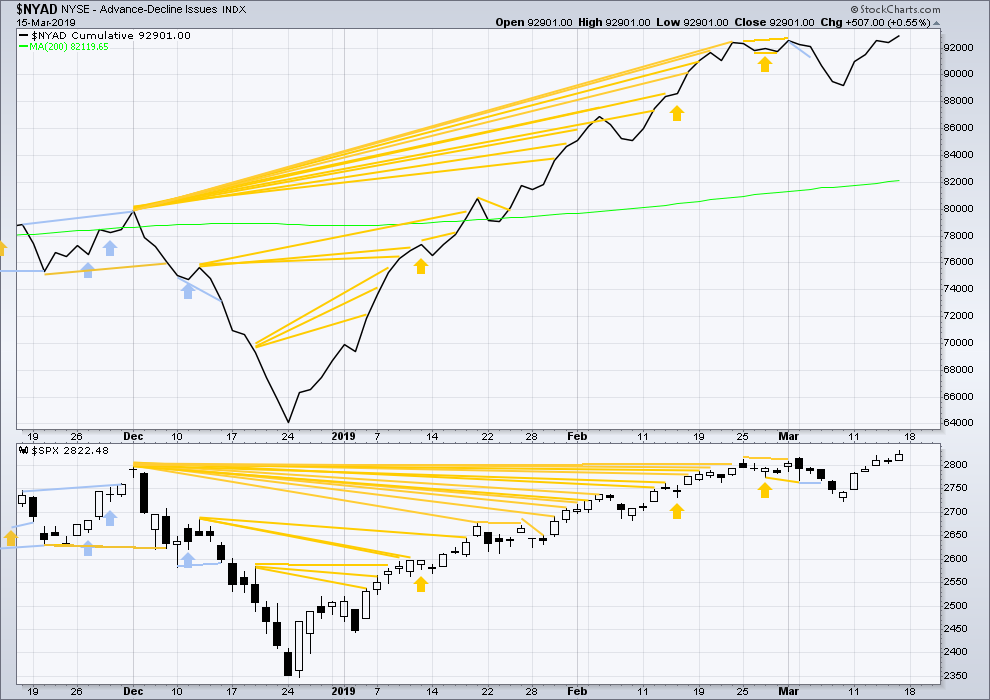
Every single bear market from the Great Depression and onwards has been preceded by a minimum of 4-6 months divergence between price and the AD line. With the AD line making a new all time high again last week, the end of this bull market and the start of a new bear market must be a minimum of 4 months away, which is mid to end June 2019 at this time.
The AD line makes a new all time high this week. Upwards movement has support from rising market breadth, and breath is rising faster than price. This is longer-term bullish divergence.
Only large caps have made new highs this week above the prior high of the 25th of February. Mid and small caps have not. This indicates some weakness in market breadth. The upwards rise may becoming selective. This would be normal towards the end of a bull market run.
DAILY CHART
Click chart to enlarge. Chart courtesy of StockCharts.com. So that colour blind members are included, bearish signals
will be noted with blue and bullish signals with yellow.
Breadth should be read as a leading indicator.
Both price and the AD line have made a new short-term high. Upwards movement on Friday has support from rising market breadth. There is no short-term divergence.
VOLATILITY – INVERTED VIX CHART
WEEKLY CHART
Click chart to enlarge. Chart courtesy of StockCharts.com. So that colour blind members are included, bearish signals
will be noted with blue and bullish signals with yellow.
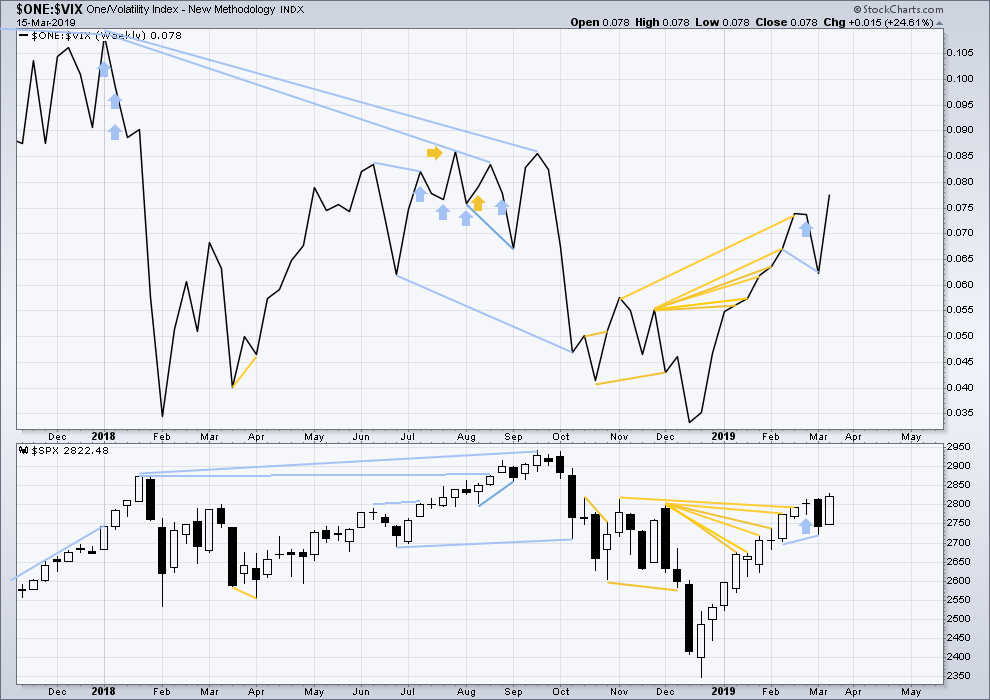
Inverted VIX has made a new short-term high and a mid-term high along with price. Upwards movement comes with a decline in VIX. There is no short nor mid-term divergence.
Longer-term divergence between price and inverted VIX at the last all time high in September 2018 remains.
DAILY CHART
Click chart to enlarge. Chart courtesy of StockCharts.com. So that colour blind members are included, bearish signals
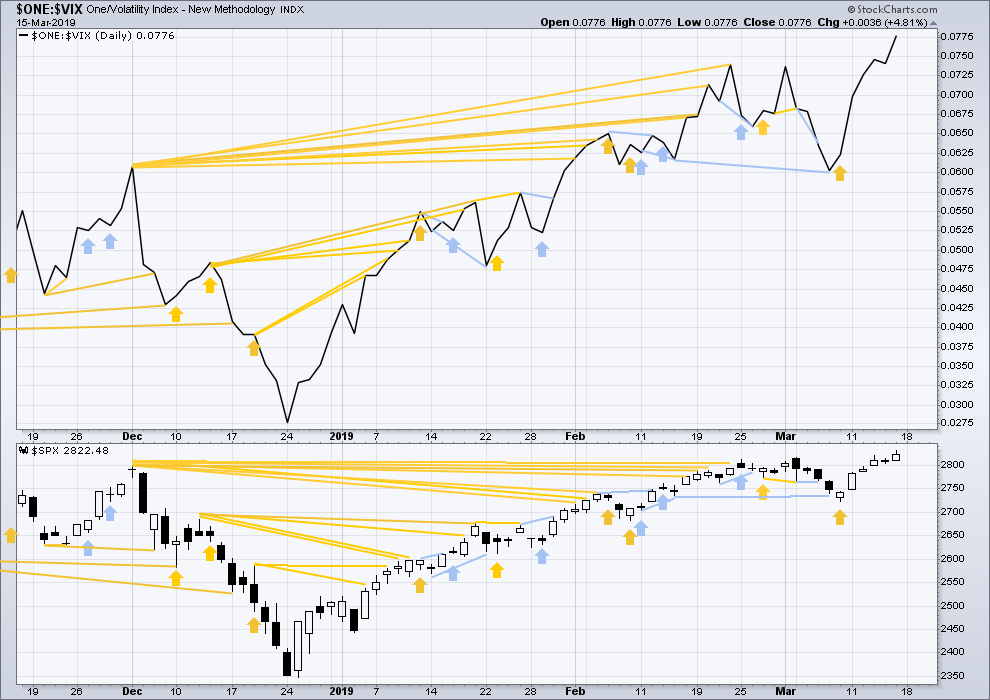
will be noted with blue and bullish signals with yellow.
Both price and inverted VIX have made new short-term highs. There is no divergence. Upwards movement comes with a normal corresponding decline in VIX.
DOW THEORY
Dow Theory confirms a bear market. This does not necessarily mean a bear market at Grand Super Cycle degree though; Dow Theory makes no comment on Elliott wave counts. On the 25th of August 2015 Dow Theory also confirmed a bear market. The Elliott wave count sees that as part of cycle wave II. After Dow Theory confirmation of a bear market in August 2015, price went on to make new all time highs and the bull market continued.
DJIA: 23,344.52 – a close on the 19th of December at 23,284.97 confirms a bear market.
DJT: 9,806.79 – price has closed below this point on the 13th of December.
S&P500: 2,532.69 – a close on the 19th of December at 2,506.96 provides support to a bear market conclusion.
Nasdaq: 6,630.67 – a close on the 19th of December at 6,618.86 provides support to a bear market conclusion.
With all the indices moving now higher, Dow Theory would confirm a bull market if the following highs are made:
DJIA: 26,951.81
DJT: 11,623.58
S&P500: 2,940.91
Nasdaq: 8,133.30.
For the short term, only the S&P500 and Nasdaq have made new highs above the February 25th highs. DJIA and DJT remain lower. There is some divergence: the rise in price for the S&P500 is not mirrored across the indices.
Published @ 01:41 a.m. EST on March 16, 2019.
—
Careful risk management protects your trading account(s).
Follow my two Golden Rules:
1. Always trade with stops.
2. Risk only 1-5% of equity on any one trade.
Take a gander at that VX gap higher this morning.
It begs the question of just how much trust we can really place in the aimless trashing around in VIX. The latter has clearly become a deeply “flawed” instrument so far as any revelation of current market risk…CBOE had better get its act together or else they are going to be facing additional legal ramifications imho…the are playing a very dangerous game….
Main hourly updated:
Now three overlapping first and second waves may be complete for this count. This expects strong upwards movement just ahead.
Alternate hourly updated:
I tried to see if an ending diagonal may be completing after the triangle which I’ve labelled minute iv. But the wave lengths don’t work. So I have to leave minor 1 labelled complete as it is.
This count also expects strong upwards movement just ahead, but not as strong as the main count. A third wave at two lower degrees, within a fifth wave.
Looks just about right. I suspect we stall around 2875 or thereabouts…
Wild market!!
Reaction around the 2700 region is also going to be absolutely critical.
If we slice through there Katie bar the door.
I expect the resolution to come in a session or two at the most….
I do see the continued “unwillingness” for price to drop here as a bullish indicator that it will, in fact, break upward. “if price doesn’t fall of it’s own weight…it’s going to go up”. Sometimes.
I can see RSI divergence on almost all timeframe from day to 15 mins…
Seems like typical behaviour of a 5th / final wave… action till now doesn’t seem like a 3rd wave..
Is today’s high the top for this bull move and we start the P2???
I guess close will be crucial today
If we do close below 2815 then i guess it was false breakout and we should open lower tomorrow then balance till FOMC and then big dump….. let’s see, looking for the direction either way… and let market tell you that… 🙂
I’ll be mildly shocked to see a close below 2815 today.
But either that happens or all those divergences get blown away over the next day or two as the market powers upward.
We’ll see. I’ve already expressed what I think the clues indicate (which is more up, generally). But a turn here and a significant 2 down is very possible.
Well at the open I was long and very bullish but didn’t expect 13 odd impulsive move down…
With the VIX moving higher, it had started to look very bearish but that has now been hammered down, so really strange, strange market and no harmony at all, i would expect market harmony if we need to be in 3rd and power through… so my bais overall has shifted to more downside
But open to possibilities and just looking at probabilities, I’ll let market give me clues and direction so watching with curiosity ?
I could be wrong but i think this move up coming on freakish leverage.
There will be no doubt about the unwind….we are not going to just close below 2800, we are going to DEMOLISH it.
Until that happens, no need to get excited….. 🙂
If it were to happen then I am expecting that demolition on the FOMC day but before that we need to get done with wave 1 & 2…
So until FOMC is good enough time to get done with it..
Other side of the coin is to balance around here and rip through on the FOMC day…
So let’s see…
Folks trying to get paid big cash $ when March vix futures contracts settle in 2 days
The short vol Trade is very profitable.. and allows for short term manipulation around these settlement dates
I think that is why someone stepped in and pounded the vix and stopped the downward momentum earlier today
There was an open put position of 45,000 contracts on vxxb last Friday at the 29 strike
I had noticed these large foootprints act like a magnet to price action in that product
So I am looking for them now
Interesting. They are gong to have to greatly increase leverage to drive it back below the top wedge boundary (just at about 13.00). Not saying that this is impossible, but if it does happen, I would expect that move to be short-lived, with a massive intra-day gap higher when they unwind.
I’m as bearish as you, Verne, and every bit as suspicious of those mischievous banksters. But dang… we keep getting surprised by the upward strength of this rally.
I hesitate to question Lara’s best judgment, but my “artist’s” eye has me slightly favoring her daily alternate.
Grabbed some profit this morning. Looking for another entry.
Rumors are they are planning more jaw-boning with an announcement of the end of QT (as if we don’t know it ALREADY ended) and the lemmings just might fall for that feint, so we certainly could go higher. I do suspect that kind of subterfuge is loosing its efficacy though, as Draghi recently learned! 🙂
Amazing isn’t it?
See how they turned what looked like an ES bear flag into a manic ramp to the upside? Yikes!
They sure are thrashing around….Oh my goodness!! 🙂
Yep. Tough to get a solid bead on it right now.
Trading nimble at low timeframes at the moment.
Markets hopelessly fractured: lone SPX high, with gap support, bear flag in ES. Something’s gotta give….
They cannot sustain a move higher without driving VIX lower.
Any move higher with VIX continuing to fly a green flag probably presages a future gap down so look alert…
Gap providing support so it looks like we are heading higher… 🙂
If we take out 2800 today, Friday’s SPY 280 puts should return some nice coin as we revisit the 2700 contested shelf. Surrender has to be on a closing basis…
ROTFL!
Looks like the RIOT short sellers are going to have to get a few more MM buddies to join the fray. I would bust a gut if it gaps past 5.00….Hehe!
Last bankster cash dump at 2818.25.
If they don’t defend it, 2800 goes the way of the Dodo bird… 😉
CRON hourly. I took this long just now looking for some movement over the next week or two up and away from this steady neckline. If it breaks below the 20.4 or so swing low…I’m out and maybe turn it around to a short.
Haha!
Short sellers are pooling their resources in an attempt to beat RIOT into submission and eacape the short squeeze. I do wish them well…NOT! 😀
RIOT making some noise!
They quietly dropped the 1.00 strike call options.
Glad I snagged ’em early!
I will be taking delivery…thank you!
Why is the VIX rising here this morning on rising SPX prices? A noticeable divergence.
Perfectly tagged top of falling wedge last week after break above…
Are you referring to SPX on the hourly time frame (or lower)? If so, what does this imply for VIX as SPX keeps rising?
Yet, the VIX derivatives UVXY and TVIX are both lower.
You don’t say…!!!!
maybe in the rising prices and high volume action of last Friday SPX option prices got a little “over sold”, and they have corrected here. It’s behaving more nominally now.
Take a look at market lows of last Feb as compared to those of last Dec. Now compare the performance of VIX ( and other vol instruments) at the respective lows.
Anything unusual?
Have you heard so much as a whisper of this or read a single word about this ANYWHERE?
I have looked. Can’t find anything.
Arguably, this is the kind of thing that should have every trader sitting bolt upright in a huge WTF!! moment.
Instead. Crickets.
I cannot possibly be the only one who spotted this. Why the silence?
All things in this market may not be what they seem.
Be careful out there, and have a great trading week everyone!
By February do you mean February 2018 and thus the comparison is to Dec 2018?
I see the SPX low in Dec 2018 is much lower than SPX Feb 2018; roughly 2350 and 2500 respectively. The VIX highs were 36 at SPX 2350 versus 50 at SPX 2500. So I see that the lows are reversed.
Are you saying that VIX and SPX should be proportionately inversely correlated? In other words, should VIX have exceeded the Feb 2018 high of 50 at the Dec SPX low of 2350? I am guessing that could be the expectation, however, when it comes to VIX all sorts of strange things happen.
All that being said, what do you think the implications are going forward?
If VIX truly represents what they SAY it does, that kind of divergence at a lower SPX low by almost 200 points should be IMPOSSIBLE…!!!!
The folk at CBOE are crooks and LIARS.
Traders really do need to be aware of this if they value their capital….sorry to be so blunt…
Hi Rod.
As to implications going forward I am not sure. As I have opined a few times on the forum, I remain perplexed at what appeared to me to be a complete failure to fully unwind the short vol trade at the Feb lows. I kept looking for the other shoe to drop and the forcible margin selling (evidenced by the new lows and margin debt haircut) in December SHOULD have done it, but it didn’t. Not even close!
This is NOT a good situation, and imho there are no benign explanations for what we are seeing. Just my two pence…
I echo Verne’s skepticism. I would be very hesitant to be long at this level until it proves itself. Its very odd that the VIX is up 2.25% while the market is up as well. Suspect if you ask me!!
Here’s a broad spectrum view using a 4 year – monthly chart (for max visability)
Lara,
Thank you for the great video. I just watched it. Just what I needed to stay more objective!
You’re welcome Andrew.
What has me concerned the most is the lack of any significant appearing primary wave 2. On the monthly it just looks like a giant head and shoulder topping pattern. A more significant p2 would have made me feel more comfortable. If the current very low volume collapsed there could be a free fall. I’m not saying it will, but the transports are not exactly telegraphing the heart of a 3rd. Oil is looking toppy and gold and silver starting c-waves. Bonds and stocks don’t usually stay positively coorelated for long periods, so it seems likely that trend is close to reversing. I’m just not sure I’m willing to go for the last of this bull. Seems less risking to wait for shorting opportunities. I realize that not all markets are correlated but the pattern feels end like to me. I’m not willing to risk much at this point.
Smart approach, Andrewlee. According to Shakespeare, traders have only 2 decisions to make; to be in a trade or not to be in a trade. Not being in a trade is a solid decision. I never feel like I need to perpetually put on a position. Let’s compare it to a great hitter in baseball understanding that he/she doesn’t have to swing at every pitch.
Now that the resistance levels (circles on the SPX daily candle chart) have been broken, there will be an outpouring of bullish exuberance. It’s perfectly Okay to just watch that take place. That’s great risk analysis!
I agree, the lack of a decent sized primary wave 2 does look different.
However, the larger picture may put it into more context. Cycle wave V is expected to be shorter than cycle wave III which was shorter than cycle wave I. It could be an abbreviated form of a usual cycle degree impulse.
My take on Head and Shoulders patterns is it is best to wait for the RH shoulder to be formed before considering them. It is really easy to see them before formation as a possibility, but many of those that look possible never eventuate. They require some patience.
The alternate monthly count eliminates that issue. I will not be surprised at all if the alternate monthly count materializes this year. In fact, I am thinking it has a higher probability.
True. The alternate monthly count has a reasonable look.
It’s just…. not got support from volume. A third wave within a third wave? Should be unmistakeable.
But then volume could pick up and support it. It’s still early days.
Hi Lara,
Was volume the main reason you changed the wave count? I can’t see a primary 2 on a monthly chart. I always thought a p2 should show up on a monthly, am I wrong? Friday was the last day for share by backs as there is a blackout period starting. Also, Friday was the last day for business’s to fund 401k/profit share for 2018. It seems to me that volume was a key reason you changed the wave count. Is it possible that this volume was just because of government rules and not really a bullish signal. As you said transports and othe index’s are divergent.
Hi Lara,
I tried to delete the comment but was unsuccessful. When I read it, I realized it could be interpreted the wrong way. I’m not questioning you. I did not mean for that to come off that way it did. I’m just feeling indecisive about trading hear so I’m going to step out. Please don’t be offended by my comment, I’m sorry I posted it. I respect and depend on your analysis.
No worries… I question the bullish sentiment… But remain open to all possibilities… My macro view of global weakness doesn’t align with the market behavior… 🙂
Putting the analysis into a bigger perspective though it could. This may be a fifth wave to end a fifth wave… at the penultimate end of a bull market. This bull market is old now, I would expect lots of weakness to begin to be evident by now.
It does have oddly weak volume, and that’s been the case now for years.
I would certainly expect the larger global climate to show weakness. But the problem with that is it’s hopeless as a timing tool. It can persist and get worse for a long time before the market turns from bull to bear.
Hey, that’s absolutely fine Andrew. I have no problem whatsoever with questions about my reasoning. I’m open to the fact I get it wrong sometimes, and sometimes members point out something I’ve missed.
I’m just about to record the video now so I’ll try to cover my answer there.
The breakout above resistance is in my analysis the biggest reason for the change. I’m reading that close above resistance as very bullish.
Also Lowry’s. The balance of supply and demand as measured by the % difference between Buying Power and Selling Pressure (Lowry’s data) continues to improve, reading the most positive reading since the September 2018 highs. That’s really bullish.
Those “other guys” calling for a major pivot high here in the next week or so. Could be I don’t know. However…
Assume a trend will continue is one of Lara’s finest adages…which leads to my post here. Clockwise from bottom left, SPX monthly (still a down trend), weekly (neutral trend (DI+>DI- but ADX not rising yet), daily (3 days of up trend), hourly (long ongoing up trend). So which trend will continue? Which ever direction it goes, we can say that SOME time frame trends continues! I think the action of the weekly and monthly bars showing consistent upward strength, and the nature of the final bars speaks to tremendous upside momentum that supports a strong bias to further upward price action at these time frames. Unless there’s a hard and fast type reversal, a signal flare of “doneness” of this price action, this is a time (in my opinion) to bias trading and trade management for an expectation of generally continued upside action.
It’s important to call out the real chance of a fast and hard move up here. Lara’s chart is calling for the heart of 3 of 3 action right ahead. Supporting that thesis the the fact that right overhead is a volume crater, and price doesn’t like volume craters, it moves rapidly to the to the edges once it enters. There is room to the upside in the volatility band (purple) on the month and weekly, price is rising and tends to oscillate between those bands. The daily MACD is just about to cross back to bullish supporting a steadily y bullish weekly MACD. Price isn’t just consolidating above the 200, it is moving fairly aggressively up and away from it. In summary: be on the alert for possible high momentum upward price action next week.
Thanks for sharing your thoughts and insights!
Haha!
Are the “Other Guys” STILL in business??!!! 🙂
Okay. So I get to be first this weekend. That is +7 for me.
Thanks Lara for the great analysis and commentary. Since this is so very bullish mid-term and long-term, I am thinking we will end the Grand Super Cycle 1 and bull market nearer the 3400 mark than the 3000 mark. Just my long term thoughts.
The Zwieg Breadth Thrust of very early January has proven to have signaled a strong bull market continuing for some time.