
A very small range inside day is inconclusive. The short-term structure on the hourly chart prompts another way to look at the alternate Elliott wave count today.
Summary: A new target for upwards movement to be interrupted by a larger correction is now about 2,896. Confidence in this target may be had if price closes above 2,816.88 on an upwards day that has support from volume.
It remains possible that primary wave 2 is underway. It may continue sideways to end about 2,722 or lower to end about 2,674.
New updates to this analysis are in bold.
The biggest picture, Grand Super Cycle analysis, is here.
Last published monthly charts are here. Video is here.
ELLIOTT WAVE COUNTS
WEEKLY CHART
Click chart to enlarge.
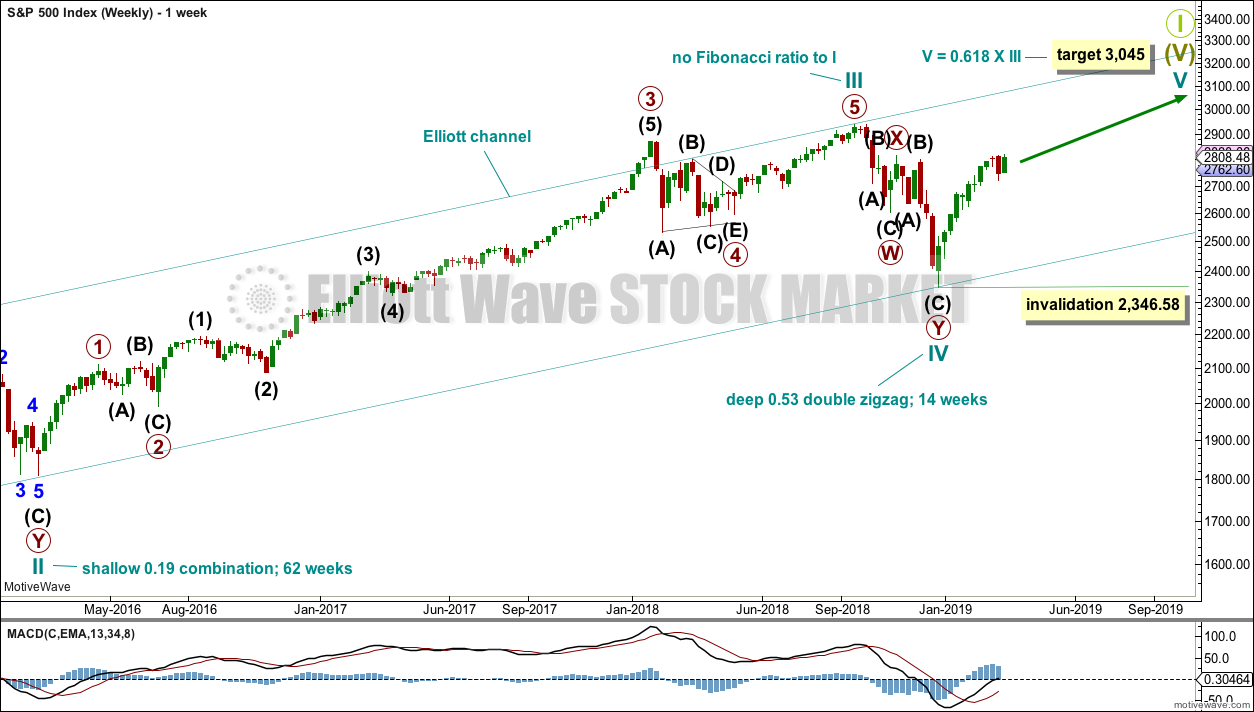
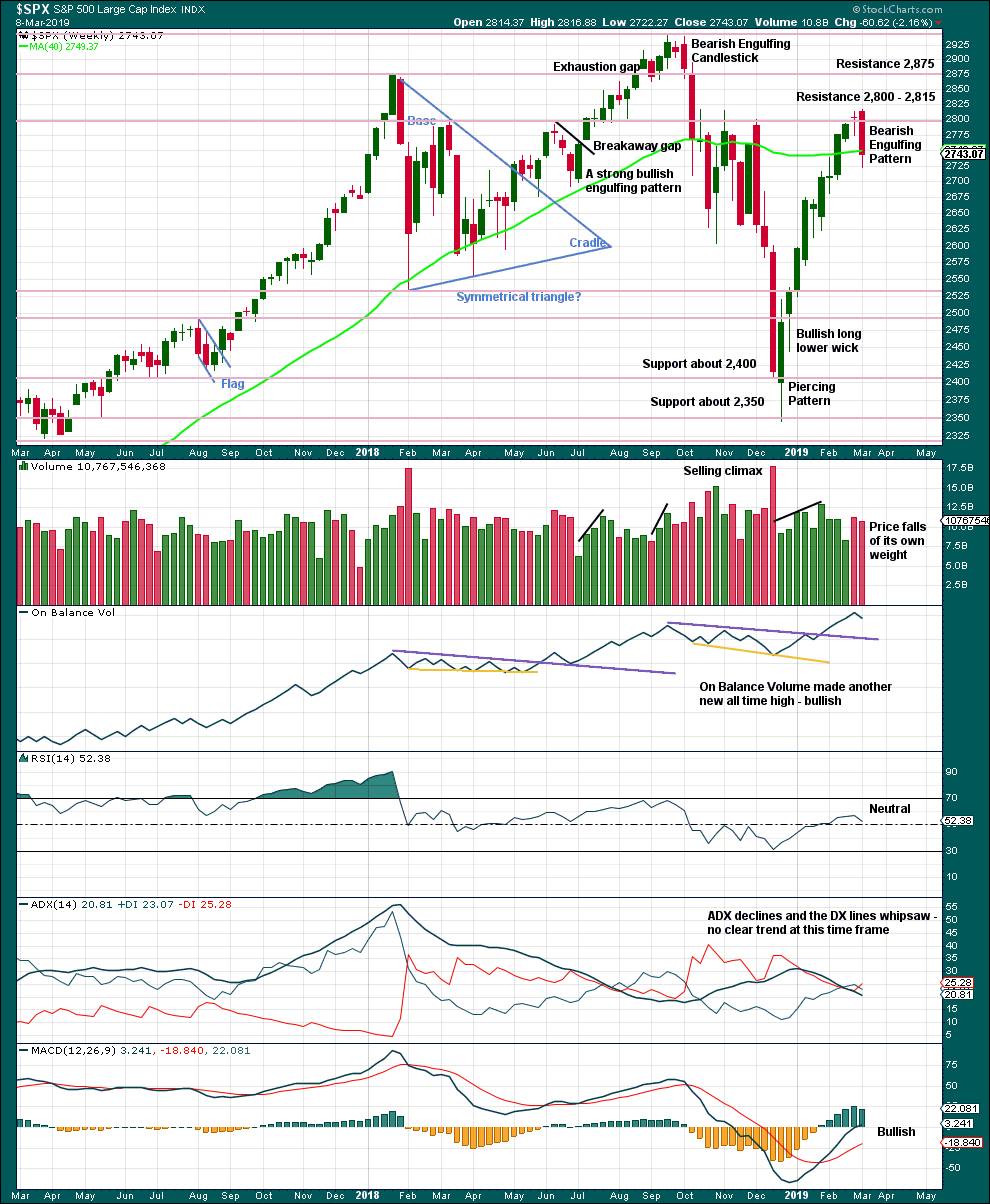
This weekly chart shows all of cycle waves III, IV and V so far.
Cycle wave II fits as a time consuming double combination: flat – X – zigzag. Combinations tend to be more time consuming corrective structures than zigzags. Cycle wave IV has completed as a multiple zigzag that should be expected to be more brief than cycle wave II.
Cycle wave IV may have ended at the lower edge of the Elliott channel.
Within cycle wave V, no second wave correction may move beyond the start of its first wave below 2,346.58.
Although both cycle waves II and IV are labelled W-X-Y, they are different corrective structures. There are two broad groups of Elliott wave corrective structures: the zigzag family, which are sharp corrections, and all the rest, which are sideways corrections. Multiple zigzags belong to the zigzag family and combinations belong to the sideways family. There is perfect alternation between the possible double zigzag of cycle wave IV and the combination of cycle wave II.
Although there is gross disproportion between the duration of cycle waves II and IV, the size of cycle wave IV in terms of price makes these two corrections look like they should be labelled at the same degree. Proportion is a function of either or both of price and time.
Draw the Elliott channel about Super Cycle wave (V) with the first trend line from the end of cycle wave I (at 2,079.46 on the week beginning 30th November 2014) to the high of cycle wave III, then place a parallel copy on the low of cycle wave II. Cycle wave V may find resistance about the upper edge.
It is possible that cycle wave V may end in October 2019. If it does not end there, or if the AD line makes new all time highs during or after June 2019, then the expectation for cycle wave V to end would be pushed out to March 2020 as the next possibility. Thereafter, the next possibility may be October 2020. March and October are considered as likely months for a bull market to end as in the past they have been popular. That does not mean though that this bull market may not end during any other month.
MAIN WAVE COUNT
DAILY CHART
Click chart to enlarge.
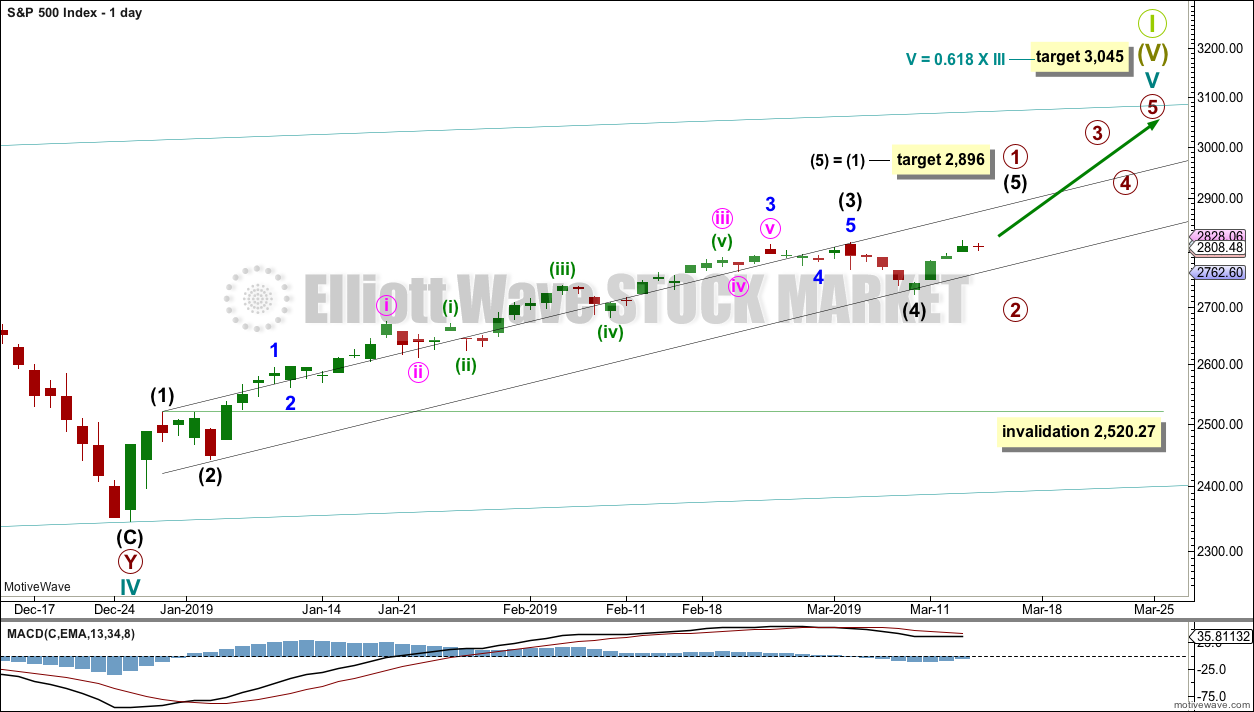
The daily chart will focus on the structure of cycle wave V.
Within Super Cycle wave (V), cycle wave III may not be the shortest actionary wave. Because cycle wave III is shorter than cycle wave I, this limits cycle wave V to no longer than equality in length with cycle wave III at 3,477.39. A target is calculated for cycle wave V to end prior to this point.
Cycle wave V must subdivide as a five wave motive structure, either an impulse or an ending diagonal. An impulse is much more common and that will be how it is labelled. A diagonal would be considered if overlapping suggests it.
Primary wave 1 is labelled as incomplete. Within primary wave 1, there is no Fibonacci ratio between intermediate waves (1) and (3). A target is calculated for intermediate wave (5) that expects the most common Fibonacci ratio to intermediate wave (1).
Intermediate wave (4) may not move into intermediate wave (1) price territory below 2,520.27.
The black channel is drawn about primary wave 1 using Elliott’s first technique. It shows about where intermediate wave (4) found support.
HOURLY CHART
Click chart to enlarge.
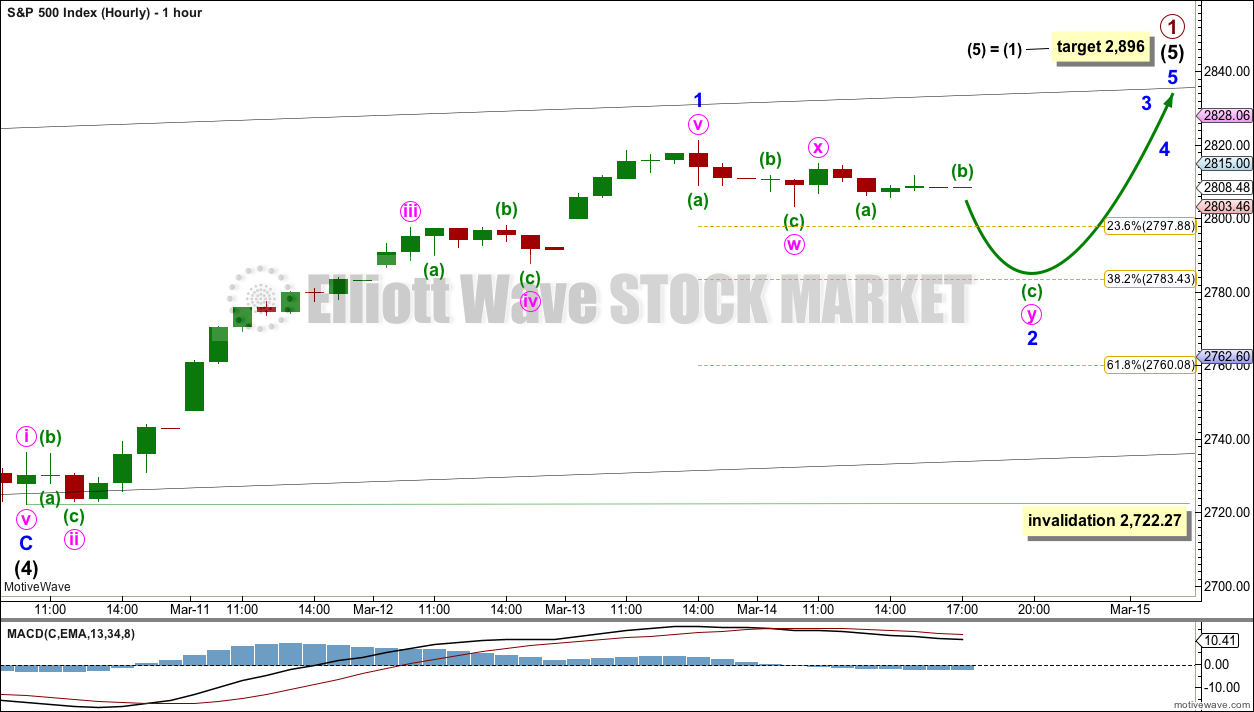
Intermediate wave (4) may have been a relatively quick shallow zigzag. Intermediate wave (5) may be underway.
Within intermediate wave (5), minor wave 1 may be over.
Today minor wave 2 is relabelled as an incomplete double zigzag. The subdivisions for this structure fit on the one minute chart. The purpose of a second zigzag in a double is to deepen the correction when the first zigzag did not move price deep enough. To achieve its purpose minute wave y may be expected to end reasonably below the end of minute wave w at 2,803.46. If minor wave 2 ends about the 0.382 Fibonacci ratio, then this double zigzag would have a normal look.
Minor wave 2 may not move beyond the start of minor wave 1 below 2,722.27.
ALTERNATE WAVE COUNT
DAILY CHART
Click chart to enlarge.
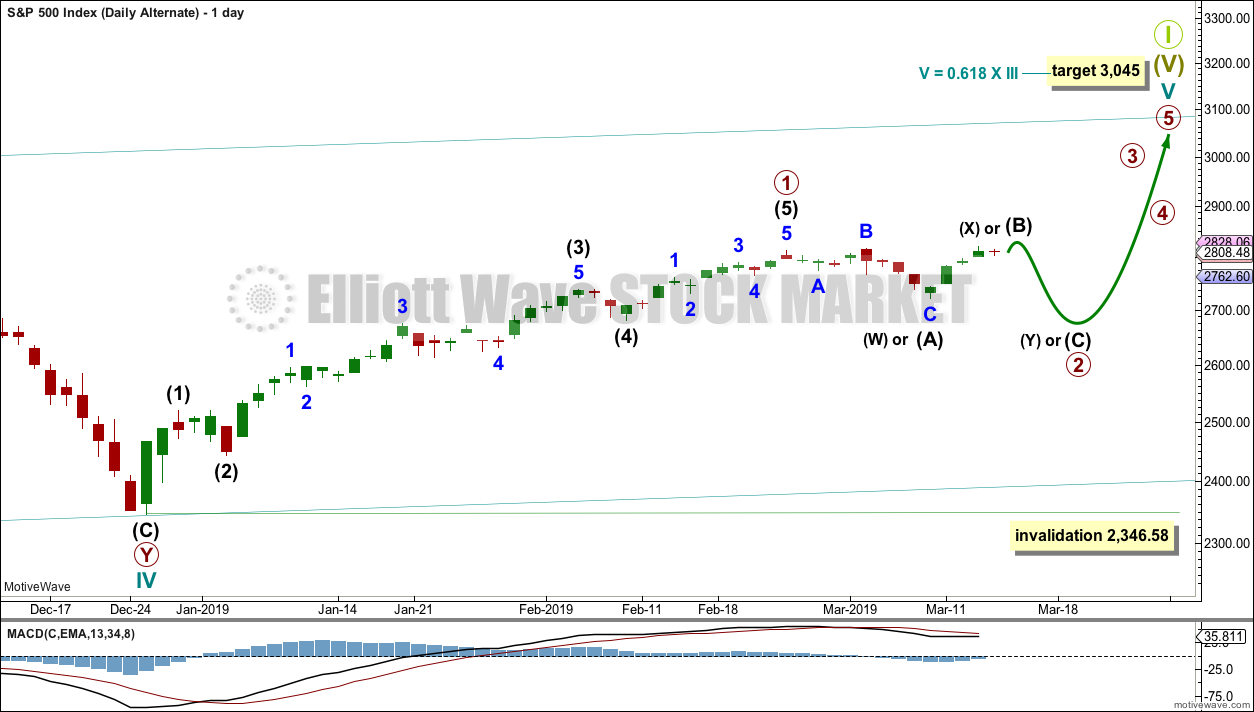
It is also possible that primary wave 1 was over on the 25th of February and primary wave 2 began there.
Primary wave 2 may be unfolding as either an expanded flat, double combination or double flat.
If primary wave 2 unfolds as an expanded flat, then within it intermediate wave (A) may be a complete flat correction, intermediate wave (B) may be an incomplete single zigzag. The most common length of intermediate wave (B) within a flat correction is from 2,813.49 to 2,848.15. Intermediate wave (C) may unfold lower to end below the end of intermediate wave (A) to avoid a truncation and a very rare running flat. Expanded flats are fairly common structures.
If primary wave 2 unfolds as a double combination, then intermediate wave (W) may be a compete flat correction. The double may now be joined by a three in the opposite direction labelled intermediate wave (X), which may subdivide as any corrective structure and today is relabelled as an incomplete single zigzag. The second structure in a double combination would be labelled intermediate wave (Y) that would most likely subdivide as a zigzag and would most likely end about the same level as intermediate wave (W) at 2,722, so that the structure takes up time and moves price sideways. Double combinations are fairly common structures.
If primary wave 2 unfolds as a double flat, then the first flat may be complete and labelled intermediate wave (W). The double may now be joined by a three in the opposite direction labelled intermediate wave (X), which may subdivide as any corrective structure and today is relabelled as an incomplete single zigzag. Intermediate wave (Y) may unfold sideways as a flat correction to end about the same level as intermediate wave (W) at 2,722, so that the structure takes up time and moves price sideways. Double flats are not common structures.
Primary wave 2 may not move beyond the start of primary wave 1 below 2,346.58.
HOURLY CHART
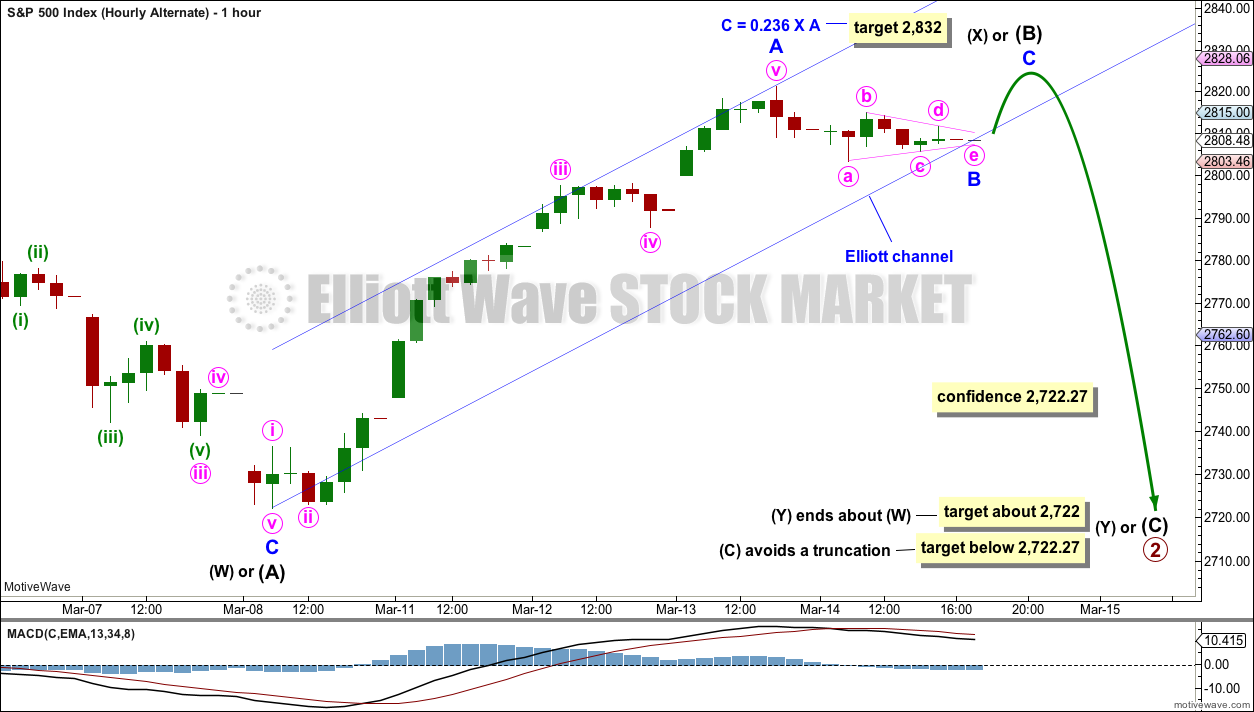
Click chart to enlarge.
It is possible that intermediate wave (B) or (X) is an incomplete single zigzag. Sideways movement of this last session may be a triangle for minor wave B. If the triangle is correctly labelled, then the breakout should be upwards and may be short and swift.
A target is calculated for intermediate wave (B) to end within the most common range for B waves within flat corrections.
If price closes to a new high above 2,816.88 on an upwards day, which has some support from volume, then this alternate wave count would be discarded.
If price continues higher but exhibits weakness, then this alternate wave count may still be considered. B or X waves should exhibit weakness.
Intermediate wave (C) of a flat correction must subdivide as a five wave motive structure.
Intermediate wave (Y) of a double combination would most likely subdivide as a zigzag.
Intermediate wave (Y) of a double flat would subdivide as a flat.
TECHNICAL ANALYSIS
WEEKLY CHART
Click chart to enlarge. Chart courtesy of et=”_blank”>StockCharts.com.
Last week the strong Bearish Engulfing candlestick pattern supports the new alternate Elliott wave count.
DAILY CHART
Click chart to enlarge. Chart courtesy of StockCharts.com.
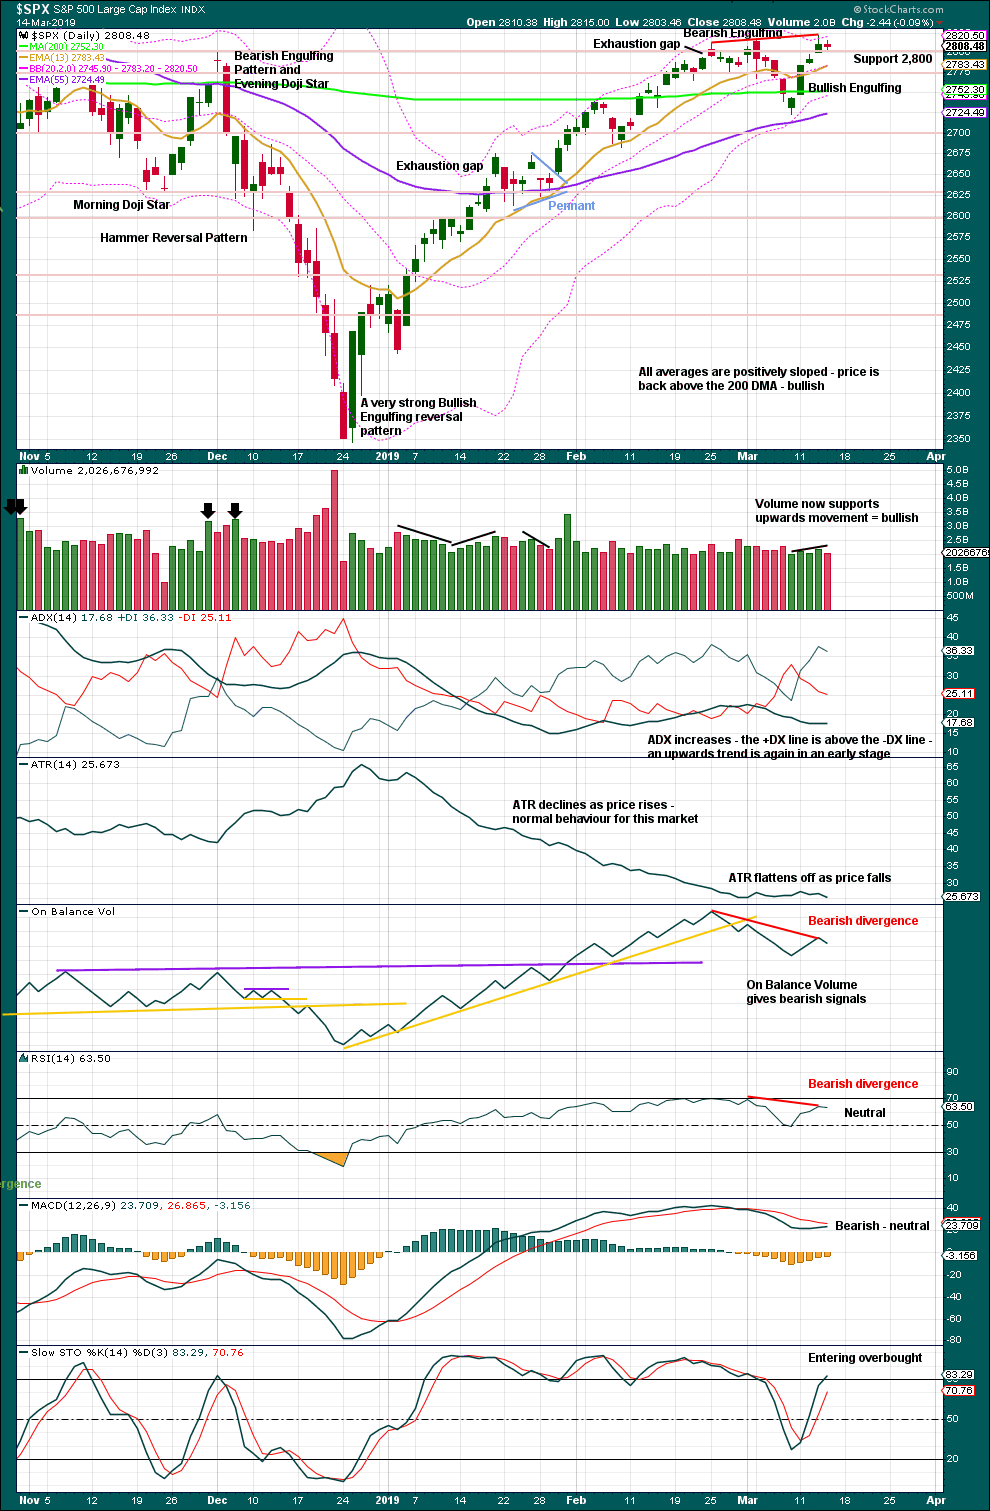
The December 2018 low is expected to remain intact. The two 90% upwards days on 26th December 2018 and 6th January 2019 indicate this upwards trend has internal strength.
Bullish indications that support the main Elliott wave count:
– the short-term volume profile
– moving averages and price back above the 200 day average
– the strong Bullish Engulfing candlestick pattern at the last swing low
– ADX
Bearish indications that support the alternate Elliott wave count:
– single bearish divergence between price and On Balance Volume
– single bearish divergence between price and RSI
– MACD (although this now has an upwards slope and is tending towards neutral)
– mid and small caps failed to make a new high.
BREADTH – AD LINE
WEEKLY CHART
Click chart to enlarge. Chart courtesy of StockCharts.com. So that colour blind members are included, bearish signals
will be noted with blue and bullish signals with yellow.
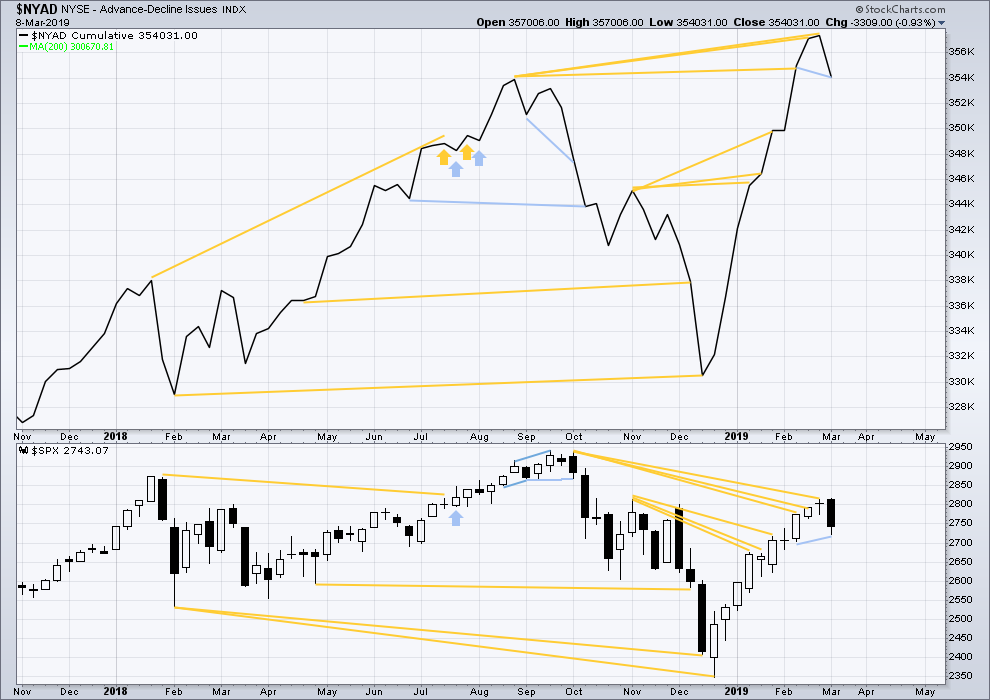
Every single bear market from the Great Depression and onwards has been preceded by a minimum of 4-6 months divergence between price and the AD line. With the AD line making a new all time high again last week, the end of this bull market and the start of a new bear market must be a minimum of 4 months away, which is mid to end June 2019 at this time.
Last week the AD line has made a new low below the prior low of the week beginning 11th February, but price has not. This divergence is bearish for the short term.
DAILY CHART
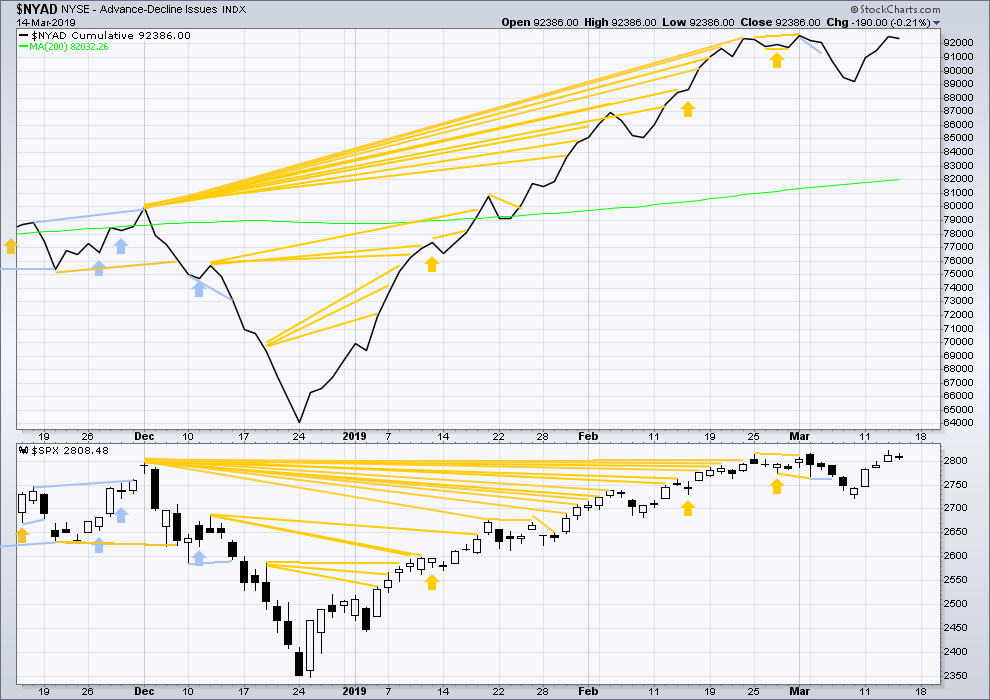
Click chart to enlarge. Chart courtesy of StockCharts.com. So that colour blind members are included, bearish signals
will be noted with blue and bullish signals with yellow.
Breadth should be read as a leading indicator.
Today both price and the AD line moved sideways. There is no new divergence.
Yesterday large caps made a very slight new high, but mid and small caps have not. This upwards movement does not have good support from market breadth.
VOLATILITY – INVERTED VIX CHART
WEEKLY CHART
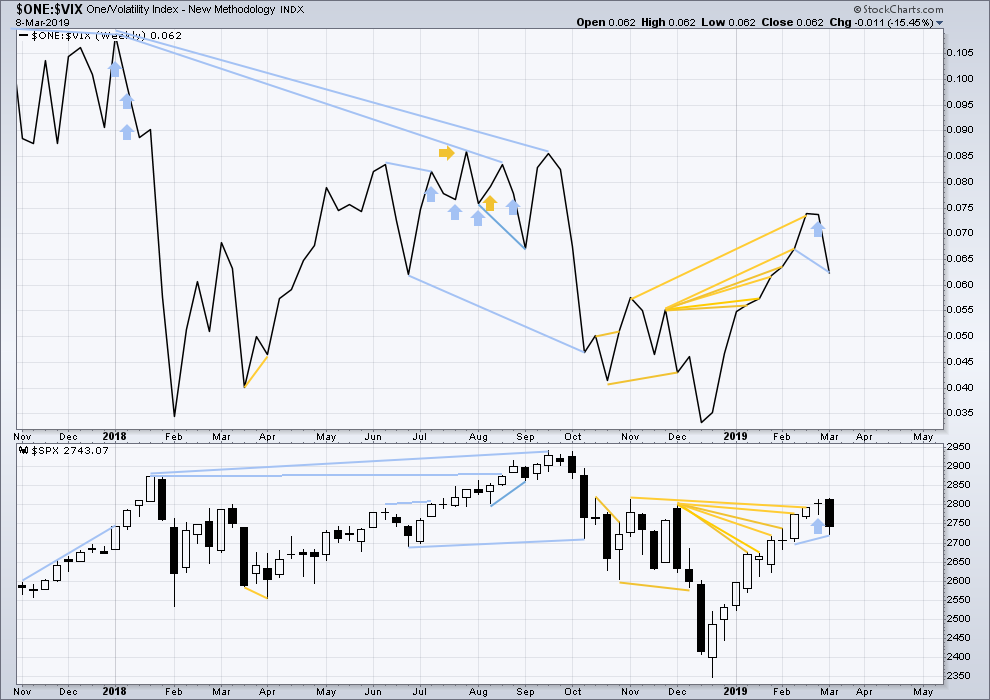
Click chart to enlarge. Chart courtesy of StockCharts.com. So that colour blind members are included, bearish signals
will be noted with blue and bullish signals with yellow.
Inverted VIX has made a new low below the prior low of the week beginning 11th of February, but price has not. This divergence is bearish.
DAILY CHART
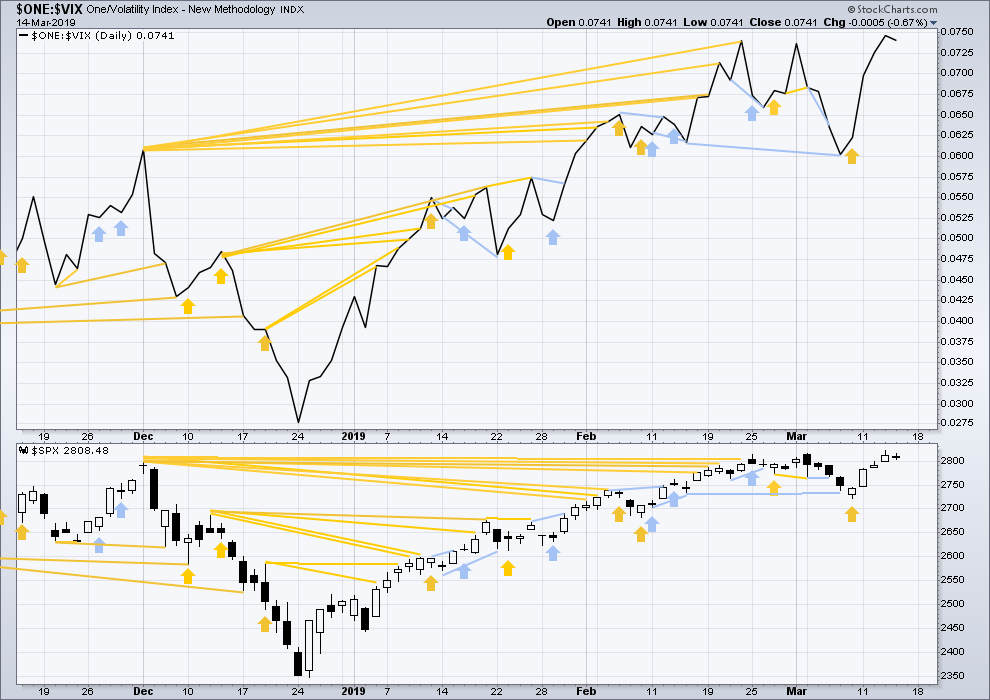
Click chart to enlarge. Chart courtesy of StockCharts.com. So that colour blind members are included, bearish signals
will be noted with blue and bullish signals with yellow.
Today both price and inverted VIX moved sideways. There is no divergence.
DOW THEORY
Dow Theory confirms a bear market. This does not necessarily mean a bear market at Grand Super Cycle degree though; Dow Theory makes no comment on Elliott wave counts. On the 25th of August 2015 Dow Theory also confirmed a bear market. The Elliott wave count sees that as part of cycle wave II. After Dow Theory confirmation of a bear market in August 2015, price went on to make new all time highs and the bull market continued.
DJIA: 23,344.52 – a close on the 19th of December at 23,284.97 confirms a bear market.
DJT: 9,806.79 – price has closed below this point on the 13th of December.
S&P500: 2,532.69 – a close on the 19th of December at 2,506.96 provides support to a bear market conclusion.
Nasdaq: 6,630.67 – a close on the 19th of December at 6,618.86 provides support to a bear market conclusion.
With all the indices moving now higher, Dow Theory would confirm a bull market if the following highs are made:
DJIA: 26,951.81
DJT: 11,623.58
S&P500: 2,940.91
Nasdaq: 8,133.30.
Published @ 08:45 p.m. EST.
—
Careful risk management protects your trading account(s).
Follow my two Golden Rules:
1. Always trade with stops.
2. Risk only 1-5% of equity on any one trade.
Updated hourly chart:
Minor 2 must have been over for this count. The low so far today cannot be minor 4 because it may not overlap into minor 1 price territory. So another first and second wave may be complete.
However, this count today no longer agrees with MACD. Momentum should be strengthening as a third wave builds, not weakening.
I may relabel the subdivisions of intermediate (5) today.
Noticed something. Not a big thing, but maybe it’s a thing.
During this 3 month bull run, they have used a pattern to take it higher. I’ll call it (with a completely straight face) “the 5 candle flat-bottomed up-thrust”.
If it is a repeatable pattern, then Monday would be the 5th candle. After Monday the move can cool off a bit before continuing up. At close of business today we are 42 points away from my ES target.
I’m really laughing at your name for this pattern.
Thanks. I needed a wee laugh today.
: )
broke 2820, can they hold it…..
🙂
If RUT is still the canary in the coal mine…
It’s double topped here (daily and hourly views). May not be meaningful, probably not meaningful…but I’d suggest keeping an eye on RUT for “earlier” warnings of broader market weakness. Breaking below the “twin peaks” neckline formed at 1548 would be a first such warning.
It was bumping underneath my sma and looking weak yesterday… is it a double top or double tap ready to break through higher…
*hold skull of dear friend and ponders…
The dollar (UUP here, weekly) has now double topped at 78.6% retrace of the 2017-2018 swing down. It’s a nice spot to take a longer term short IMO, with a stop just above the recent highs. High potential turn point, high reward to risk, only question is, wait for a break of the last swing low, or get aboard now? I’m going to do both…1/2 now, 1/2 on a break of the prior weekly swing low.
Both hourly charts show a trip under 2800…. anyone thinking that’s actually going to happen today or tomorrow or the next 72 business hours? These hourly charts have been costing me thousands. I Better go back to paper trading this hocus pocus.
I’m riding this to 2832ish
Going overnight from here Peter?
I would put it in the far more unlikely than not category, based on up to the minute price action. And note that price is in the early/mid stages of an intermediate wave 5 going UP, not down. This isn’t a good time to be betting on the short side. In my opinion.
I’ve been there myself, so I can say this with total authority… Lara’s charts are not the cause of your problems.
Two words: Risk Management.
Excellent perspective. My entries have been decent- havent reached my max loss…. but I’m rigggggghhhht there lol
Spy Dividen falls tody
Dear Lara and Cesar,
I am sorry you and the people of New Zealand have experienced the evil and destructive nature of humankind in the mass shooting yesterday. Now we all know that there is no place on the planet that is safe from such horrific acts of evil. My thoughts and prayers are will you all. I hope the healing of the people of your nation begins immediately and is full. I hope you did not loose any family or friends in this unimaginable act of violence and terror. Once again, I am sorry.
I definitely concur with Rod’s comment and sentiment. It is truly a very sad event! And that’s big understatement
Thanks guys. My country is grieving.
But we’ll be fine. There’s a big outpouring of love happening to counter the hate.
Wishing you Peace, Love, and Understanding
Quite a few instruments give a look of the recent 6 days or so of move up being a wave 5, consistent with the current main model for SPX. For example, XLK. And with such an extended 3 wave, the nominal behavior (not certain, just “frequent”) is that the 5 wave will be equal in length to the 1 wave. I have that projection for SPX at 2895…
Anyone short off the double top (which happens to be at a nice 1.618 extension)? I did, not large but since I doubt the market is going up much today, why not. That was after taking quick SPY/IWM longs on the open and closing them in the same spot.
I sold AVGO puts two days ago. Bought back for 1/10th what I paid, today, huuuuge gap up. Semi’s in general are going crazy to the upside.
And on the sad side…all my wins will just cover my loss on a TLT put bought many weeks ago, which I should have bailed on many weeks ago. “Believe the market” I think is the right adage.
SPY down and ES up at the open….. what’s the clue here ?
Divident expiration I would think as Debbie mentioned above. Verne brought it up a couple of days ago also…
Nabbed it!