A new high leaves the alternate Elliott wave count valid but prompts a reanalysis of this upwards wave.
Two new Elliott wave counts are published for members. The main Elliott wave count has support from volume and VIX.
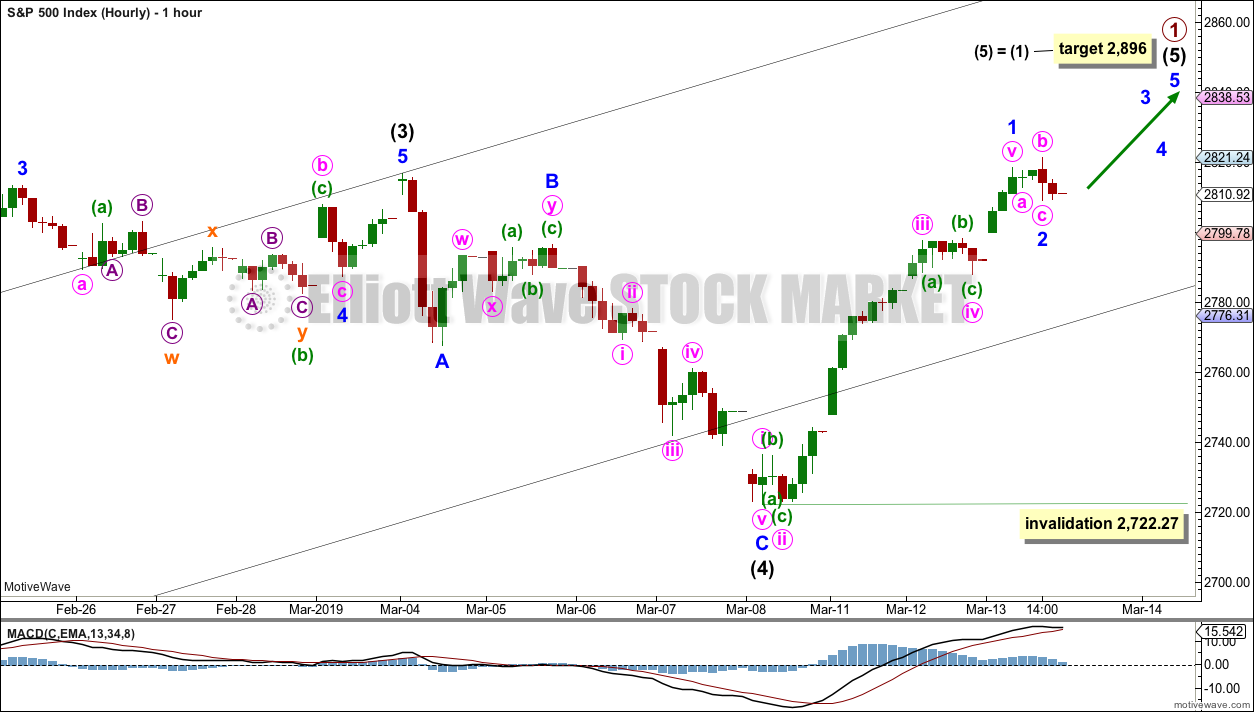
Summary: A new target for upwards movement to be interrupted by a larger correction is now about 2,896. Confidence in this target may be had if price closes above 2,816.88 tomorrow on an upwards day that has support from volume.
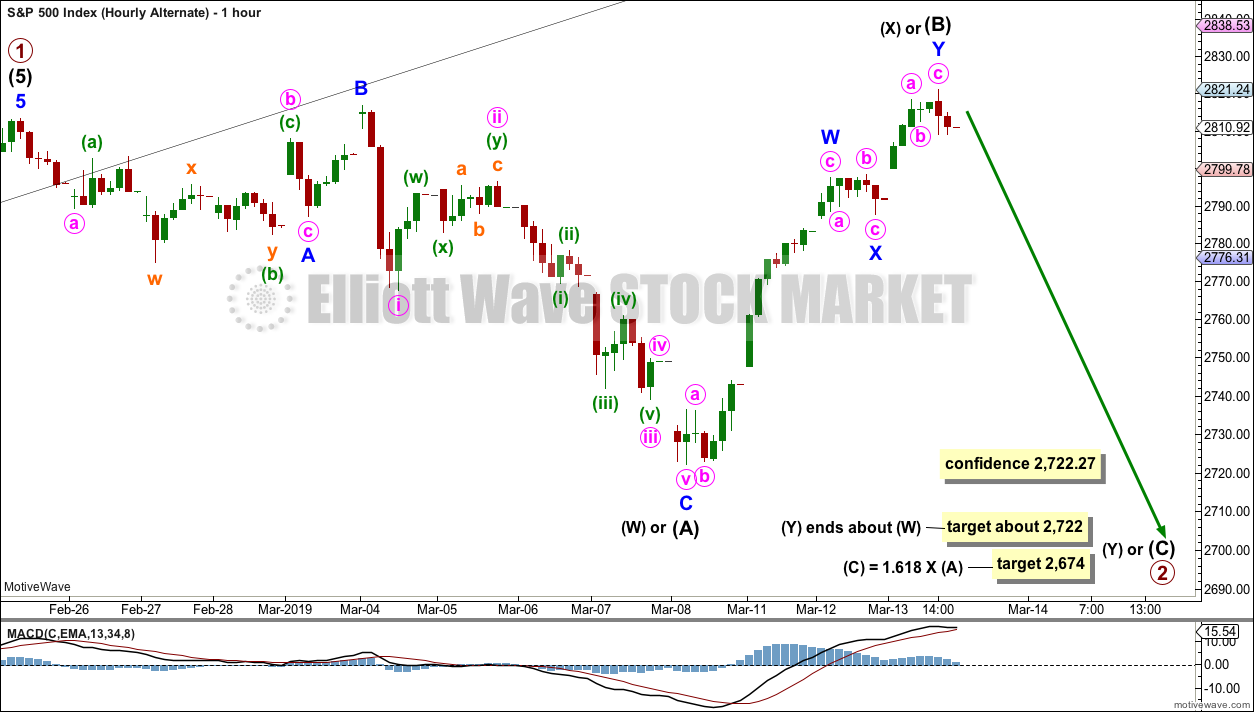
It remains possible that primary wave 2 is underway. It may continue sideways to end about 2,722 or lower to end about 2,674.
New updates to this analysis are in bold.
The biggest picture, Grand Super Cycle analysis, is here.
Last published monthly charts are here. Video is here.
ELLIOTT WAVE COUNTS
WEEKLY CHART
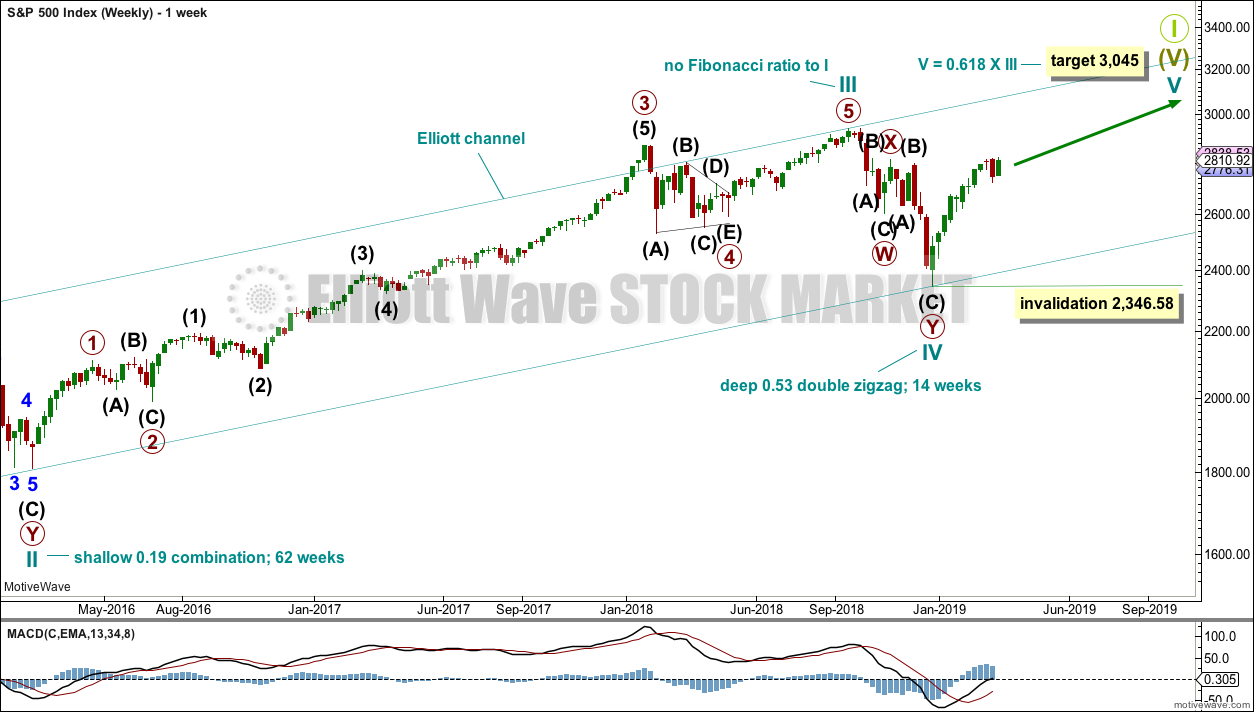
This weekly chart shows all of cycle waves III, IV and V so far.
Cycle wave II fits as a time consuming double combination: flat – X – zigzag. Combinations tend to be more time consuming corrective structures than zigzags. Cycle wave IV has completed as a multiple zigzag that should be expected to be more brief than cycle wave II.
Cycle wave IV may have ended at the lower edge of the Elliott channel.
Within cycle wave V, no second wave correction may move beyond the start of its first wave below 2,346.58.
Although both cycle waves II and IV are labelled W-X-Y, they are different corrective structures. There are two broad groups of Elliott wave corrective structures: the zigzag family, which are sharp corrections, and all the rest, which are sideways corrections. Multiple zigzags belong to the zigzag family and combinations belong to the sideways family. There is perfect alternation between the possible double zigzag of cycle wave IV and the combination of cycle wave II.
Although there is gross disproportion between the duration of cycle waves II and IV, the size of cycle wave IV in terms of price makes these two corrections look like they should be labelled at the same degree. Proportion is a function of either or both of price and time.
Draw the Elliott channel about Super Cycle wave (V) with the first trend line from the end of cycle wave I (at 2,079.46 on the week beginning 30th November 2014) to the high of cycle wave III, then place a parallel copy on the low of cycle wave II. Cycle wave V may find resistance about the upper edge.
It is possible that cycle wave V may end in October 2019. If it does not end there, or if the AD line makes new all time highs during or after June 2019, then the expectation for cycle wave V to end would be pushed out to March 2020 as the next possibility. Thereafter, the next possibility may be October 2020. March and October are considered as likely months for a bull market to end as in the past they have been popular. That does not mean though that this bull market may not end during any other month.
MAIN WAVE COUNT
DAILY CHART
The daily chart will focus on the structure of cycle wave V.
Within Super Cycle wave (V), cycle wave III may not be the shortest actionary wave. Because cycle wave III is shorter than cycle wave I, this limits cycle wave V to no longer than equality in length with cycle wave III at 3,477.39. A target is calculated for cycle wave V to end prior to this point.
Cycle wave V must subdivide as a five wave motive structure, either an impulse or an ending diagonal. An impulse is much more common and that will be how it is labelled. A diagonal would be considered if overlapping suggests it.
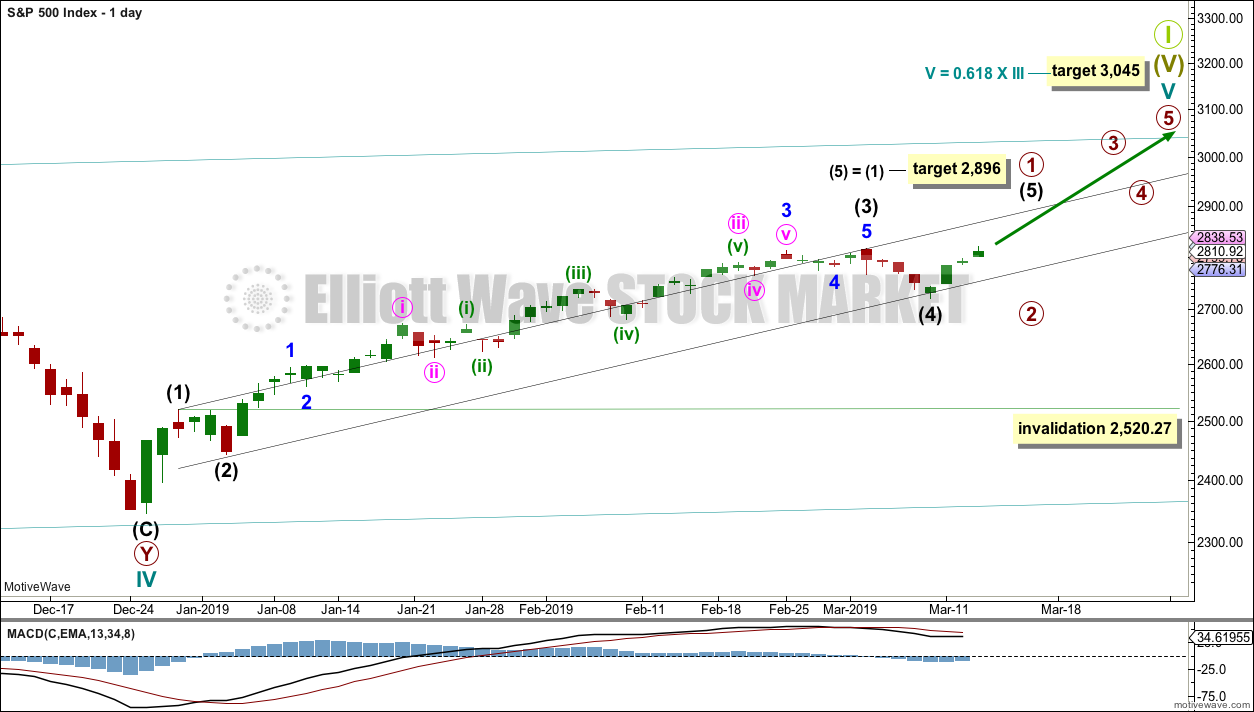
Primary wave 1 is again labelled as incomplete. Within primary wave 1, there is no Fibonacci ratio between intermediate waves (1) and (3). A target is calculated for intermediate wave (5) that expects the most common Fibonacci ratio to intermediate wave (1).
Intermediate wave (4) may not move into intermediate wave (1) price territory below 2,520.27.
The black channel is drawn about primary wave 1 using Elliott’s first technique. It shows about where intermediate wave (4) found support.
HOURLY CHART
Intermediate wave (4) may have been a relatively quick shallow zigzag. Intermediate wave (5) may be underway.
Within intermediate wave (5), minor wave 1 may be over. It is possible that minor wave 2 may also be over as a quick and relatively shallow flat correction. If it continues further, then minor wave 2 may not move beyond the start of minor wave 1 below 2,722.27.
ALTERNATE WAVE COUNT
DAILY CHART
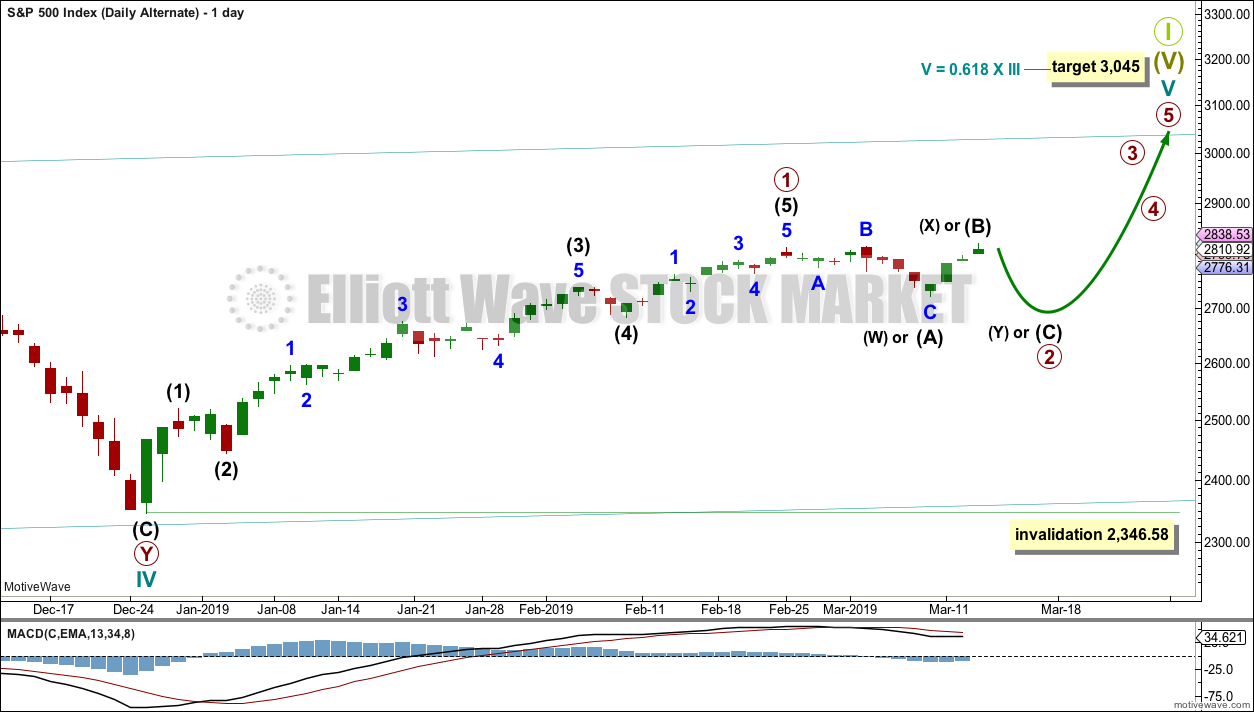
It is also possible that primary wave 1 was over on the 25th of February and primary wave 2 began there.
Primary wave 2 may be unfolding as either an expanded flat, double combination or double flat.
If primary wave 2 unfolds as an expanded flat, then within it intermediate wave (A) may be a complete flat correction, intermediate wave (B) may be a complete double zigzag and a 1.08 length of intermediate wave (A), and intermediate wave (C) may now unfold lower to end below the end of intermediate wave (A) to avoid a truncation and a very rare running flat. Expanded flats are fairly common structures.
If primary wave 2 unfolds as a double combination, then intermediate wave (W) may be a compete flat correction. The double may now be joined by a three in the opposite direction labelled intermediate wave (X), which may subdivide as a double zigzag. The second structure in a double combination would be labelled intermediate wave (Y) that would most likely subdivide as a zigzag and would most likely end about the same level as intermediate wave (W) at 2,722, so that the structure takes up time and moves price sideways. Double combinations are fairly common structures.
If primary wave 2 unfolds as a double flat, then the first flat may be complete and labelled intermediate wave (W). The double may now be joined by a three in the opposite direction labelled intermediate wave (X), which may subdivide as a double zigzag. Intermediate wave (Y) may now unfold sideways as a flat correction to end about the same level as intermediate wave (W) at 2,722, so that the structure takes up time and moves price sideways. Double flats are not common structures.
Primary wave 2 may not move beyond the start of primary wave 1 below 2,346.58.
HOURLY CHART
It is possible that intermediate wave (B) or (X) is over at today’s high. It is also equally as possible that it may yet continue higher.
If price closes to a new high above 2,816.88 on an upwards day, which has some support from volume, then this alternate wave count would be discarded.
If price continues higher but exhibits weakness, then this alternate wave count may still be considered. B or X waves should exhibit weakness.
Intermediate wave (C) of a flat correction must subdivide as a five wave motive structure.
Intermediate wave (Y) of a double combination would most likely subdivide as a zigzag.
Intermediate wave (Y) of a double flat would subdivide as a flat.
TECHNICAL ANALYSIS
WEEKLY CHART
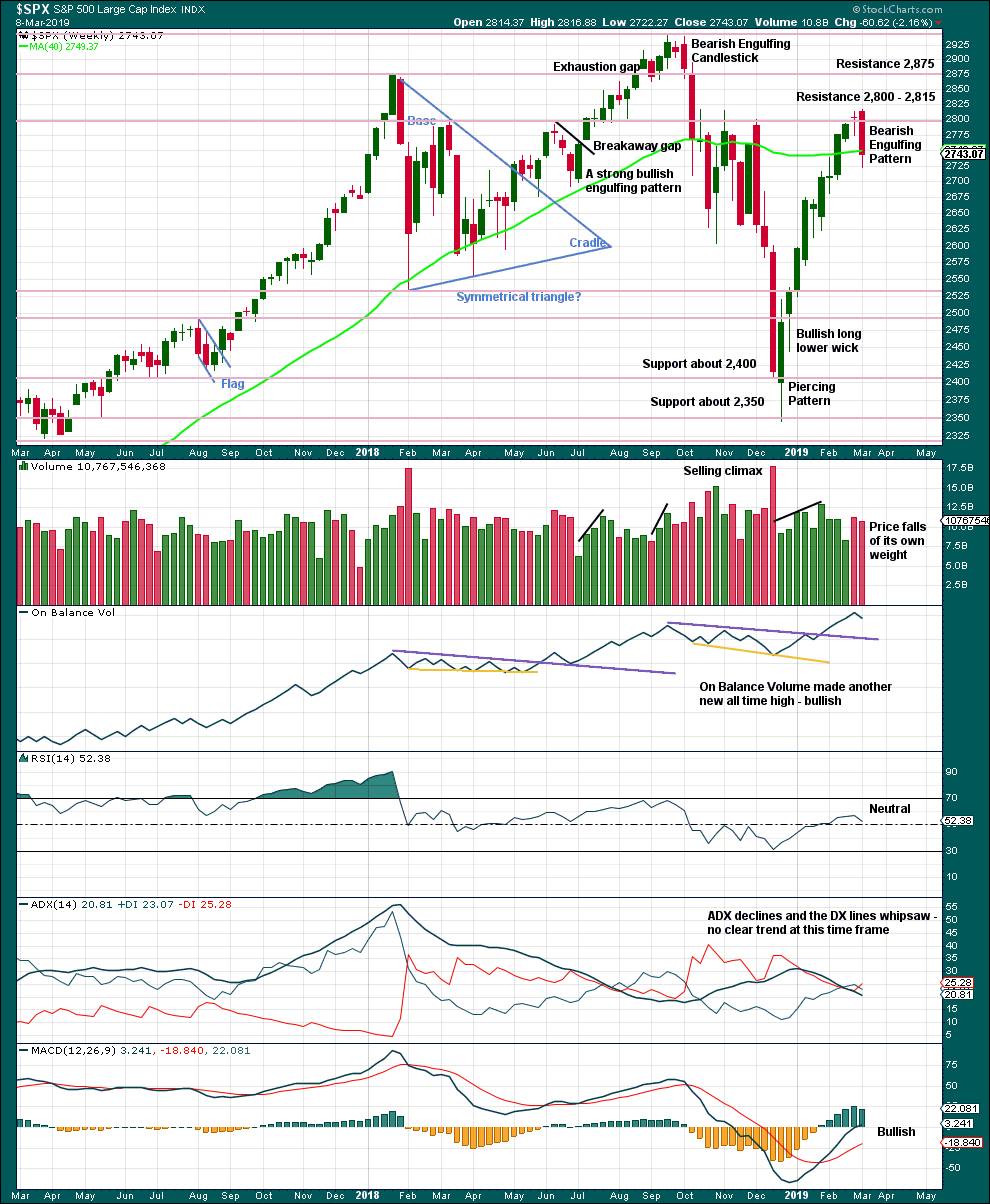
Click chart to enlarge. Chart courtesy of et=”_blank”>StockCharts.com.
Last week the strong Bearish Engulfing candlestick pattern supports the new alternate Elliott wave count.
DAILY CHART
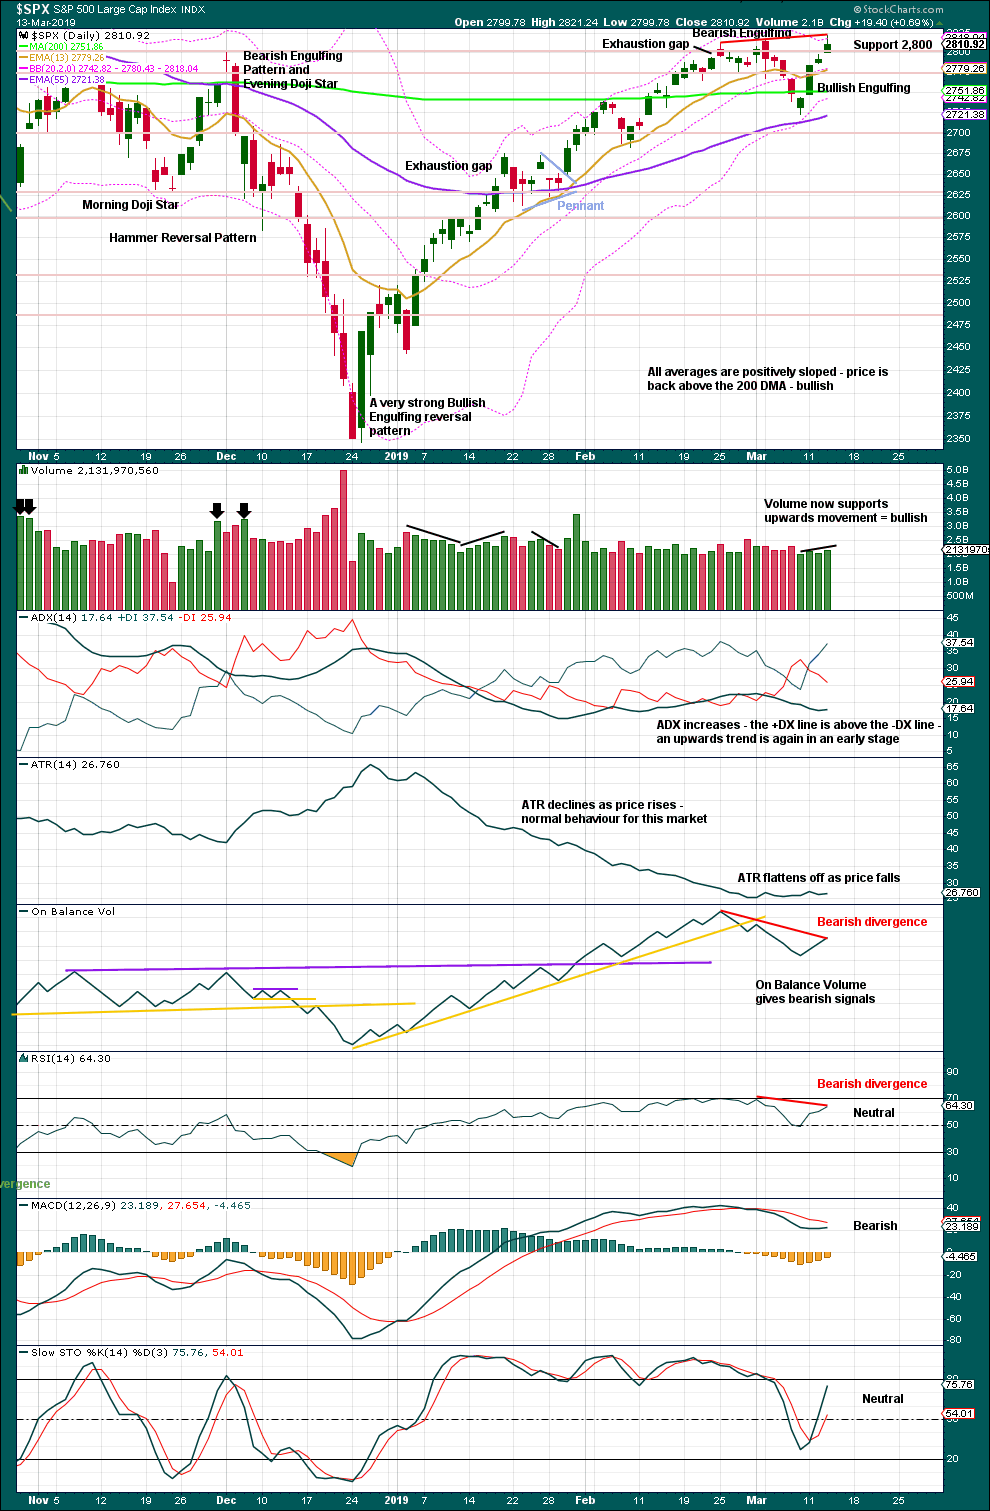
Click chart to enlarge. Chart courtesy of StockCharts.com.
The December 2018 low is expected to remain intact. The two 90% upwards days on 26th December 2018 and 6th January 2019 indicate this upwards trend has internal strength.
Bullish indications that support the main Elliott wave count:
– the short-term volume profile
– moving averages and price back above the 200 day average
– the strong Bullish Engulfing candlestick pattern at the last swing low
– ADX
Bearish indications that support the alternate Elliott wave count:
– single bearish divergence between price and On Balance Volume
– single bearish divergence between price and RSI
– MACD
– mid and small caps failed to make a new high.
BREADTH – AD LINE
WEEKLY CHART
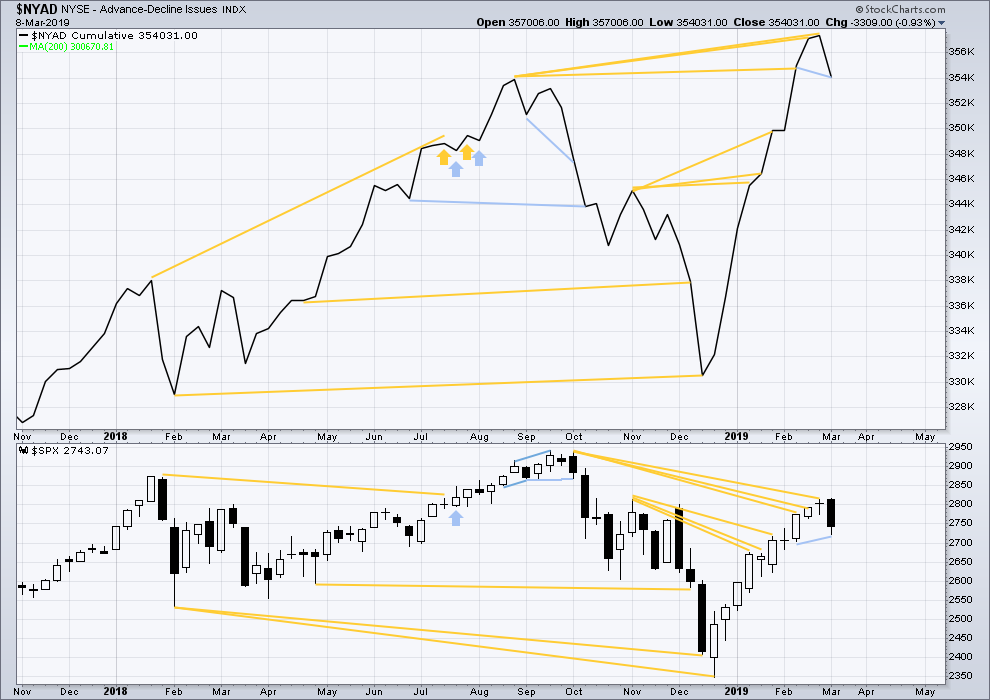
Click chart to enlarge. Chart courtesy of StockCharts.com. So that colour blind members are included, bearish signals
will be noted with blue and bullish signals with yellow.
Every single bear market from the Great Depression and onwards has been preceded by a minimum of 4-6 months divergence between price and the AD line. With the AD line making a new all time high again last week, the end of this bull market and the start of a new bear market must be a minimum of 4 months away, which is mid to end June 2019 at this time.
Last week the AD line has made a new low below the prior low of the week beginning 11th February, but price has not. This divergence is bearish for the short term.
DAILY CHART
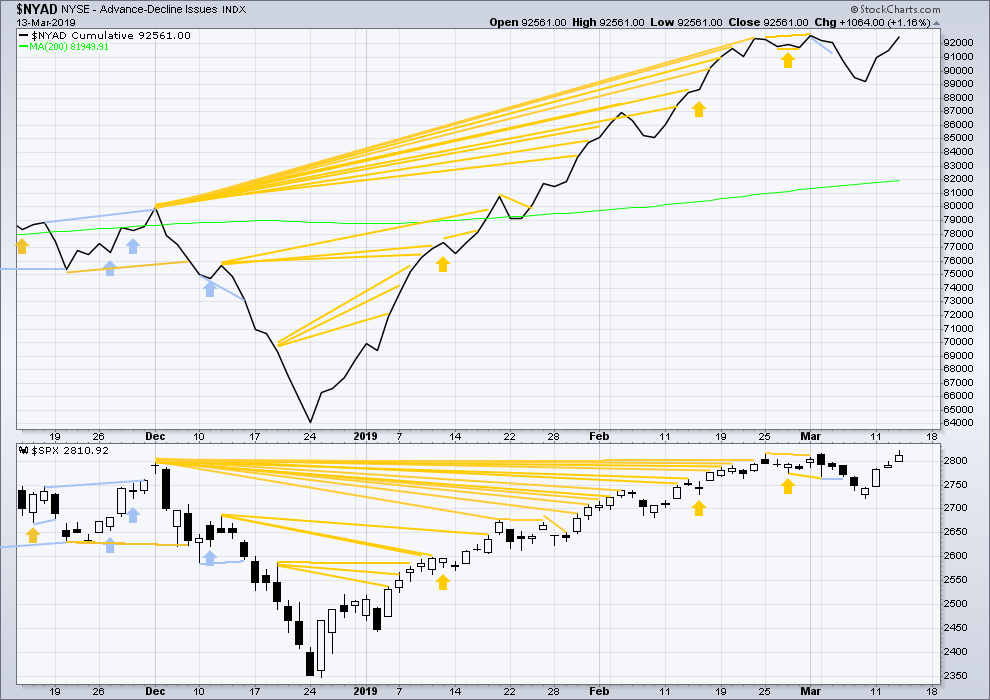
Click chart to enlarge. Chart courtesy of StockCharts.com. So that colour blind members are included, bearish signals
will be noted with blue and bullish signals with yellow.
Breadth should be read as a leading indicator.
Today both price and the AD line moved higher. Price has made a very slight new high, but the AD line has failed to do so by the very smallest of margins. This is bearish divergence, but it is extremely weak.
Today large caps made a very slight new high, but mid and small caps have not. This upwards movement does not have good support from market breadth.
VOLATILITY – INVERTED VIX CHART
WEEKLY CHART
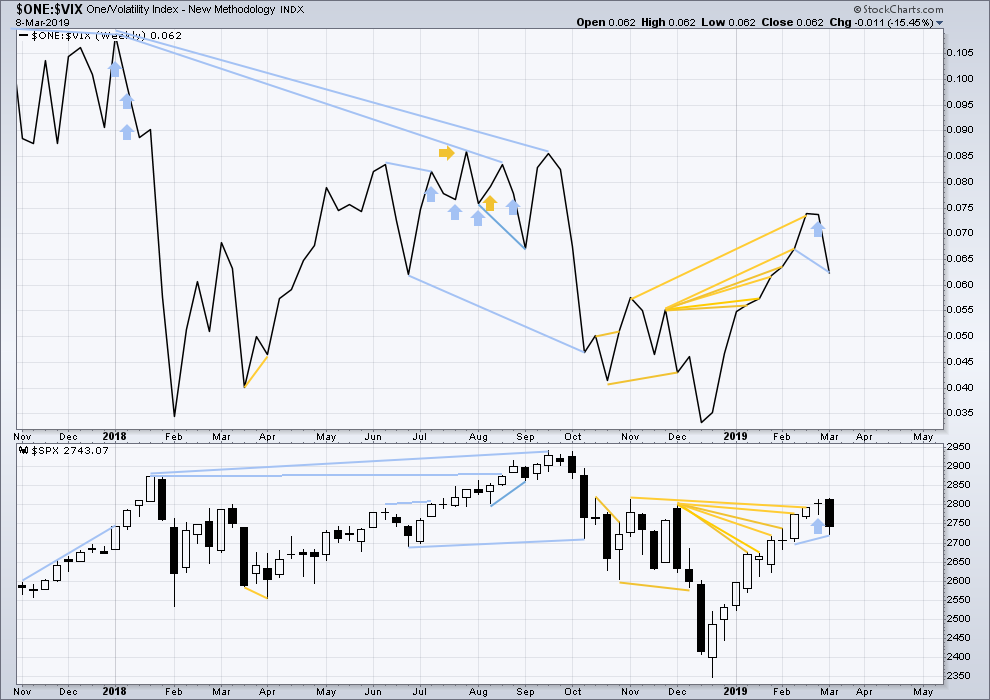
Click chart to enlarge. Chart courtesy of StockCharts.com. So that colour blind members are included, bearish signals
will be noted with blue and bullish signals with yellow.
Inverted VIX has made a new low below the prior low of the week beginning 11th of February, but price has not. This divergence is bearish.
DAILY CHART
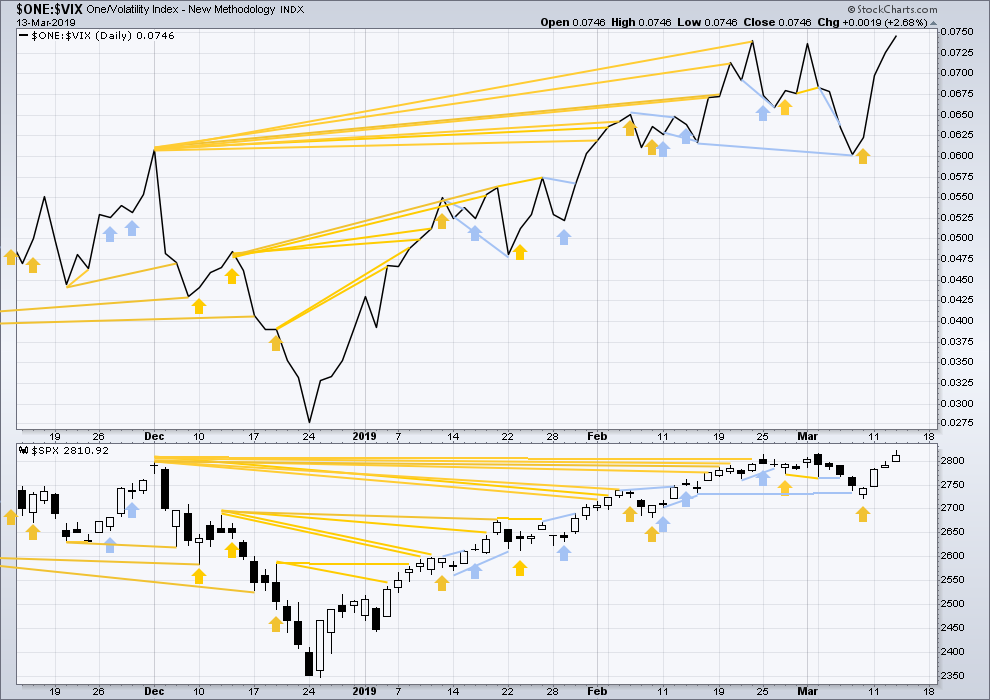
Click chart to enlarge. Chart courtesy of StockCharts.com. So that colour blind members are included, bearish signals
will be noted with blue and bullish signals with yellow.
Today both price and inverted VIX have made new highs. Upwards movement today from price has support from a normal corresponding decline in VIX. There is no divergence.
DOW THEORY
Dow Theory confirms a bear market. This does not necessarily mean a bear market at Grand Super Cycle degree though; Dow Theory makes no comment on Elliott wave counts. On the 25th of August 2015 Dow Theory also confirmed a bear market. The Elliott wave count sees that as part of cycle wave II. After Dow Theory confirmation of a bear market in August 2015, price went on to make new all time highs and the bull market continued.
DJIA: 23,344.52 – a close on the 19th of December at 23,284.97 confirms a bear market.
DJT: 9,806.79 – price has closed below this point on the 13th of December.
S&P500: 2,532.69 – a close on the 19th of December at 2,506.96 provides support to a bear market conclusion.
Nasdaq: 6,630.67 – a close on the 19th of December at 6,618.86 provides support to a bear market conclusion.
With all the indices moving now higher, Dow Theory would confirm a bull market if the following highs are made:
DJIA: 26,951.81
DJT: 11,623.58
S&P500: 2,940.91
Nasdaq: 8,133.30.
Published @ 09:28 p.m. EST.
—
Careful risk management protects your trading account(s).
Follow my two Golden Rules:
1. Always trade with stops.
2. Risk only 1-5% of equity on any one trade.

Hourly chart updated:
There’s still room for minor 2 to continue sideways or lower if it wants to.
It would look pretty good if it was over at todays low though, the proportion is good.
As Verne notes below, there could be a triangle forming currently. For this count it would be minute b within minor 2, the breakout from a triangle would be a short sharp downwards thrust. Which should be over quickly.
But when I look at this move on the five minute chart IMO it is too early to say a triangle is forming. I am very wary of triangles, what you think may be a triangle is more often than not invalidated and it turns out to be something else.
The something else here could be a series of overlapping first and second waves, to be resolved with a sharp upwards thrust for a third wave.
I think we have at least one more push up.
Rolling up bull SPY put credit spreads a few strikes to 278/279.
Now watch them gap it down past 2800 and stop me out…Lol!
Have a great week-end everyone!!
Another cash dump to push above 25,700.
I think Kevin is right.
They clearly intend to defend it through OpEx tomorrow.
Market probably a yawn until then
Also keep an eye on DJIA 25,700.
They gapped price up passed it in a leveraged attempt to entice the bulls to pile in but they declined. They unwound and price moved back below. Price now tapping on shelf from beneath….
SPY hourly volume profile.
If you believe price “likes” being at the high volume nodes (which is kindof “by definition”, right?), then price dropping here to 279 area seems a bit more likely than not.
looks to me like the Big Money wants to keep SPX right around here until the close tomorrow (“triple witching”). Fireworks may then commence…over the weekend/Monday.
Oh Yeah! 🙂
Well I managed to eek out a tiny little profit on the move up in RUT.
But not a good day for short term trading. “Dangerous” except the range is so small it’s not even really dangerous…just potentially frustrating.
That said, I’ve marked the day’s range, and might consider going a break out either way. Not that I expect it to go far today.
I’m expecting down next week (but not betting on it until I see it developing). It’s a whippy market, and the lash up appears complete, time for a lash down. And the 2820 zone has now rejected attempts to move through it SIX times….
Tough to SOH.
Buy back remaining short puts?
Reload and widen bull put spread?
Decisions, decisions…! 🙂
Trade some NFLX to keep yourself occupied…I just bought puts.
Oooh…! Let me take a gander…! 🙂
Also a very nice bull pennant in RIOT.
We should also see a pop higher there before too long…
Oops!
NFLX looking a bit bullish to moi.
Three down, two up…am I missing somethin’? 🙂
Yea, I was trading it intra-day.
Good situational awareness on the triple witching Kevin! Thx
Risk parity exposure has now become “Crazy Stupid”
Negative divergences in numerous metrics have only steepened as we moved higher, but we all know the old adage about “irrational markets”! 🙂
what will be the clue that we are in a melt up?
Look for ES to let the cat out of the bag, with either an initial break of 2800, or a move up past 2820….
We have entered yet another triangle formation from which we are likely to see a violent break. I am not sure which direction. I once read an interesting paper on “Wave Personalities” and triangles and diagonals were said to tend to appear in the context of an impending trend change being strongly resisted, and which is why they often represent penultimate and terminal (respectively) patterns.
Banksters are buying, and that is the bottom line. They aggressively bought the break from the bearish rising wedge yesterday so that means we are likely going higher before the turn. The initial wave down after we top will impulsively take out 2800.
Bears need to be patient.
I have a hard time going long when QQQ is on its second day above it’s BB…
Very dicey market at the moment.
If you look back over a few month’s worth of candles, you will see the remarkable frequency with which all kinds of typically bearish reversal signals have been completely negated: spinning tops, shooting stars, gravestone dojis, dragon-fly dojis, island reversals, and most recently, bearish engulging candles. It is beyond stunning when you stop and think about the implications. It is for this reason that the only signal I now trust is evidence of exit from leveraged long trades. They bought the initial breakdown yesterday so we are likely not done. An unwind is going to decisively take out 2800.
Sent with ProtonMail Secure Email.
Thanks Verne 😉
Sorry about protonmail tag. I was e-mailing other Posse traders as well.
RUT hourly trend has dropped to neutral. If RUT polarity inverts on the hourly (move below the swing low at 1548), I get short on the hourly tf.
Here’s what I’m feeling. This was sparked by a comment that Kevin had yesterday, suggesting the possibility of this count.
The MA line helps me see the waves. The 3rd wave is a real whopper. The 5th wave takes us to the target level drawn on the chart.
The target level is the same one that I have been promoting. Using the March contract, the number was 2860. Using the current June contract, the number is 2872. Same process used in each case to derive the target. Same exact target, different value.
Once we get to ES 2872, this trade is over and Primary 1 is a wrap.
And then there are these signals. Like we used to say, “Bigger than Dallas”.
CM, thanks for the charts. I see the signals you so clearly indicate. However, I wonder about the four red bars just previous to the second indicated signal on your chart. Why are these not a bearish signal? Thanks in advance for helping me understand.
Hi Rodney,
Red bar #3 is when the ES began trading the June contract. Bars 3 and 4 could be seen as traders positioning themselves to buy low into the new contract. How’s that for a bit of blind justification? Ha!
FYI, that’s now Lara’s main.
Foist!