
Both Elliott wave counts for the short term expected a bounce to begin the week, which is what has happened.
Summary: Targets for a multi-week pullback are 2,637 or 2,526.
However, if price closes above 2,816.88 on an upwards day with support from volume, then that would be a classic upwards breakout and the pullback would then be considered over.
At its end, this pullback may offer an opportunity to join the upwards trend prior to new all time highs.
New updates to this analysis are in bold.
The biggest picture, Grand Super Cycle analysis, is here.
Last published monthly charts are here. Video is here.
ELLIOTT WAVE COUNT
WEEKLY CHART
Click chart to enlarge.
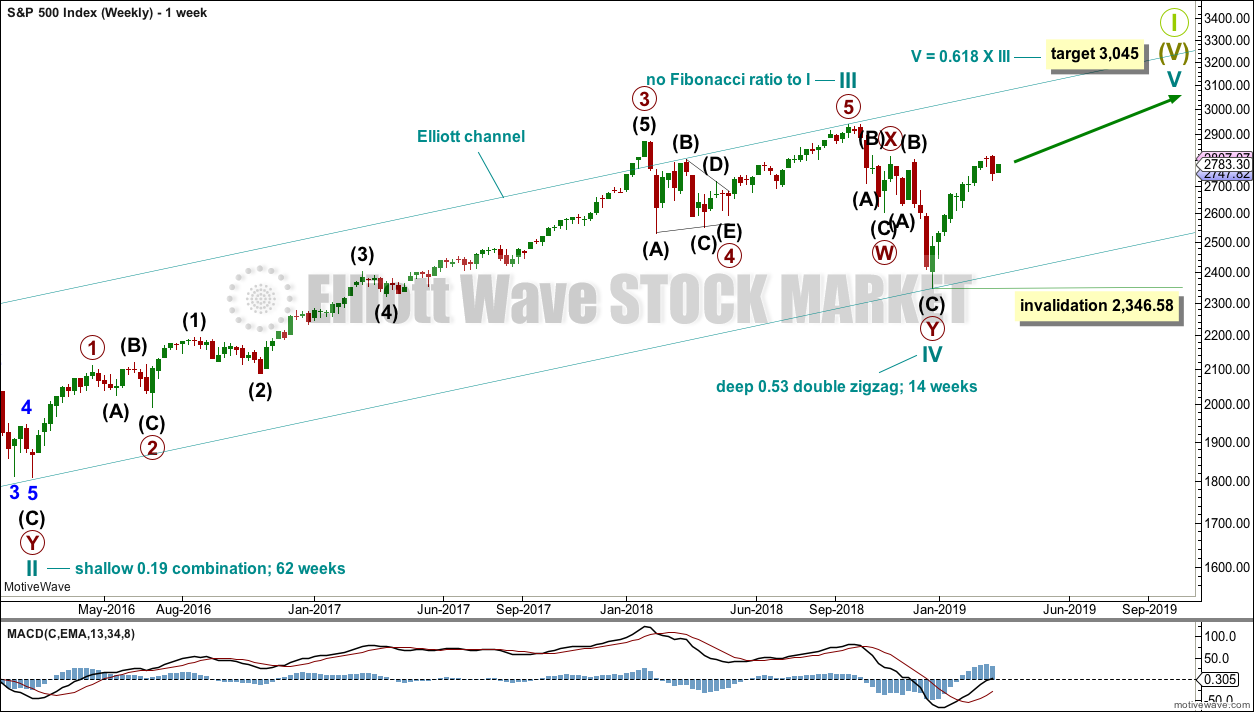
This weekly chart shows all of cycle waves III, IV and V so far.
Cycle wave II fits as a time consuming double combination: flat – X – zigzag. Combinations tend to be more time consuming corrective structures than zigzags. Cycle wave IV has completed as a multiple zigzag that should be expected to be more brief than cycle wave II.
Cycle wave IV may have ended at the lower edge of the Elliott channel.
Within cycle wave V, no second wave correction may move beyond the start of its first wave below 2,346.58.
Although both cycle waves II and IV are labelled W-X-Y, they are different corrective structures. There are two broad groups of Elliott wave corrective structures: the zigzag family, which are sharp corrections, and all the rest, which are sideways corrections. Multiple zigzags belong to the zigzag family and combinations belong to the sideways family. There is perfect alternation between the possible double zigzag of cycle wave IV and the combination of cycle wave II.
Although there is gross disproportion between the duration of cycle waves II and IV, the size of cycle wave IV in terms of price makes these two corrections look like they should be labelled at the same degree. Proportion is a function of either or both of price and time.
Draw the Elliott channel about Super Cycle wave (V) with the first trend line from the end of cycle wave I (at 2,079.46 on the week beginning 30th November 2014) to the high of cycle wave III, then place a parallel copy on the low of cycle wave II. Cycle wave V may find resistance about the upper edge.
It is possible that cycle wave V may end in October 2019. If it does not end there, or if the AD line makes new all time highs during or after June 2019, then the expectation for cycle wave V to end would be pushed out to March 2020 as the next possibility. Thereafter, the next possibility may be October 2020. March and October are considered as likely months for a bull market to end as in the past they have been popular. That does not mean though that this bull market may not end during any other month.
DAILY CHART
Click chart to enlarge.
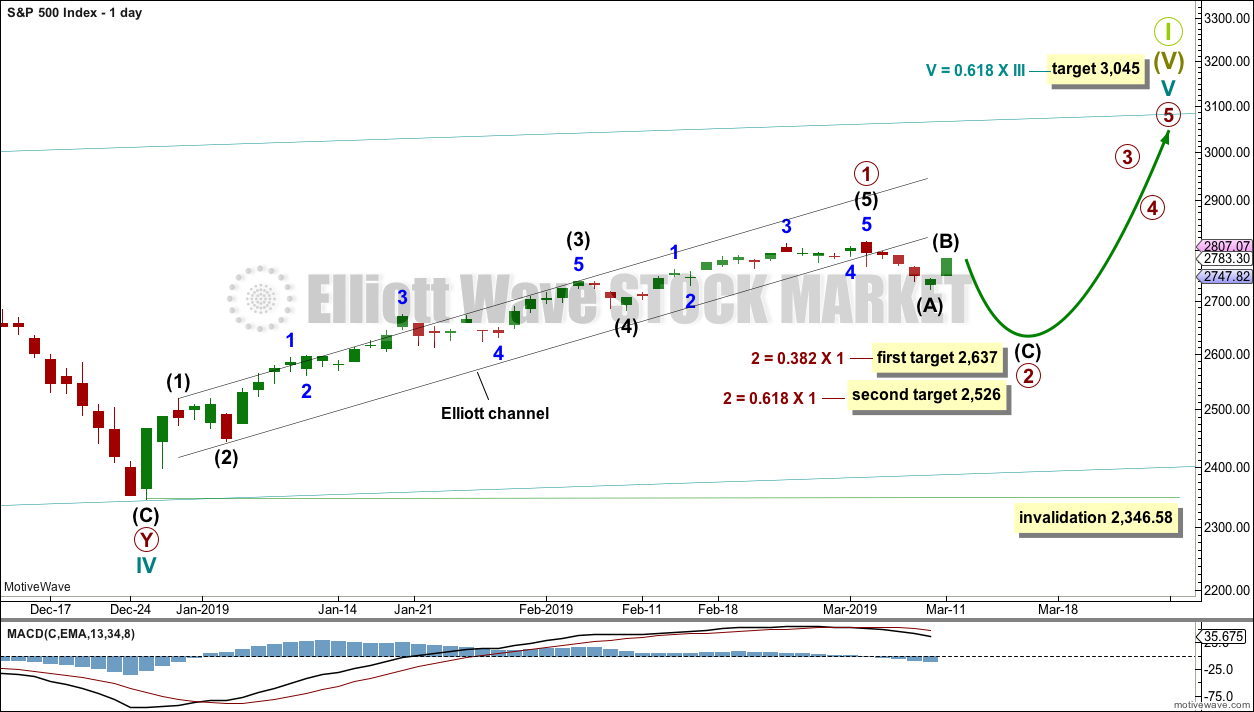
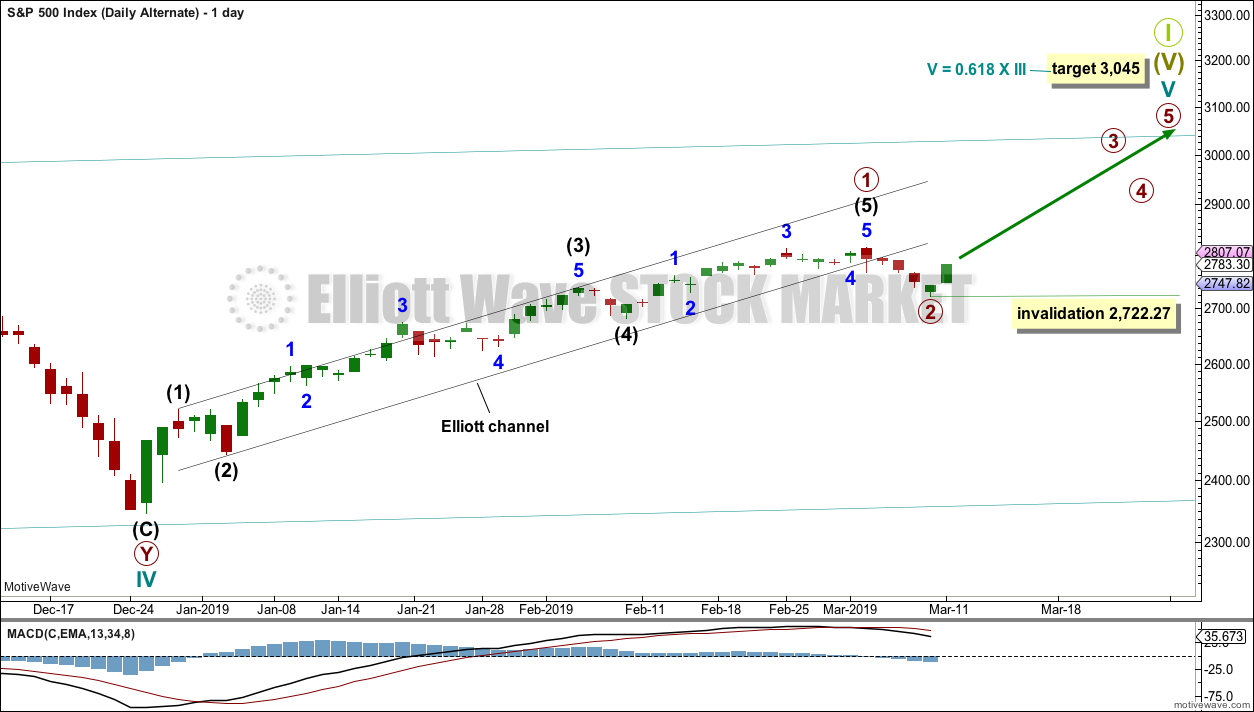
The daily chart will focus on the structure of cycle wave V.
Within Super Cycle wave (V), cycle wave III may not be the shortest actionary wave. Because cycle wave III is shorter than cycle wave I, this limits cycle wave V to no longer than equality in length with cycle wave III at 3,477.39. A target is calculated for cycle wave V to end prior to this point.
Cycle wave V must subdivide as a five wave motive structure, either an impulse or an ending diagonal. An impulse is much more common and that will be how it is labelled. A diagonal would be considered if overlapping suggests it.
Primary wave 1 is labelled as complete. Two targets are given for primary wave 2. The higher 0.382 Fibonacci ratio may be preferred in the first instance. If price keeps dropping through this target or if it gets there and the structure of primary wave 2 is incomplete, then the second lower target may be used.
Primary wave 2 may not move beyond the start of primary wave 1 below 2,346.58.
Primary wave 2 would most likely subdivide as a zigzag, but it may subdivide as any corrective structure except a triangle. The focus for the next few weeks will be on identifying when a complete structure for primary wave 2 may be seen.
MAIN HOURLY CHART
Click chart to enlarge.
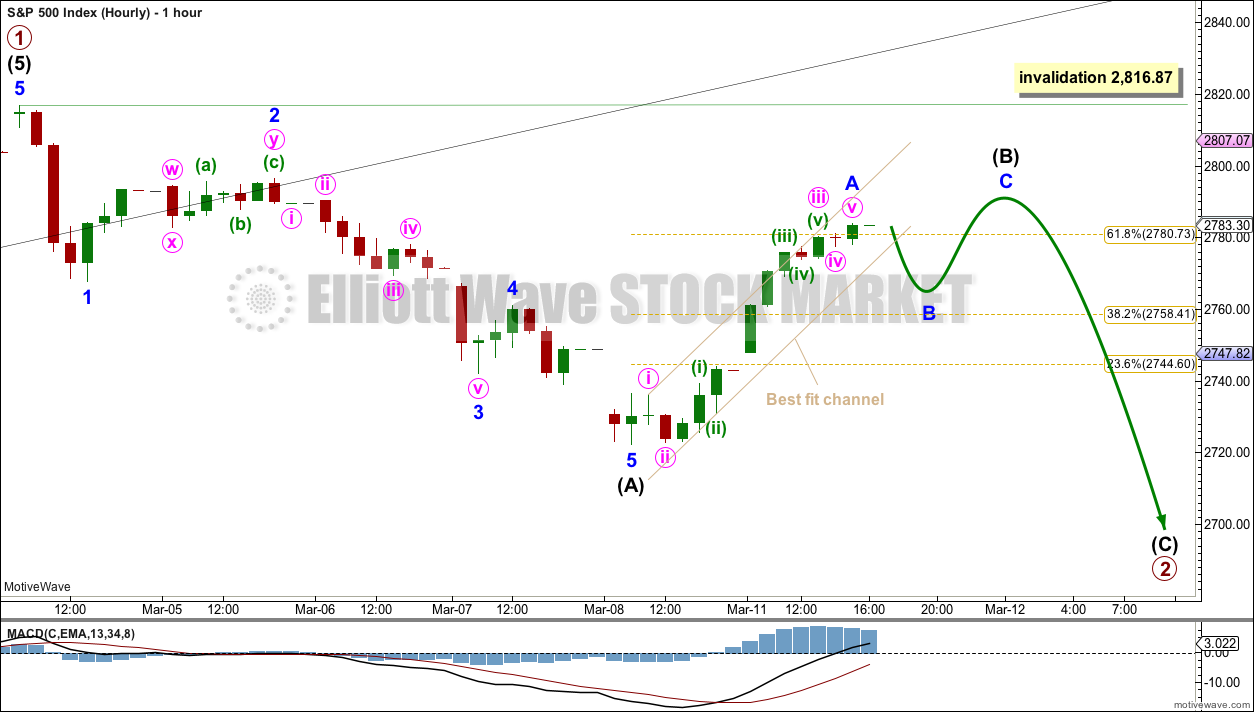
The most likely structure for primary wave 2 would be a zigzag. The next most likely structure would be a double zigzag.
Within a zigzag, intermediate wave (A) must subdivide as a five wave structure. It is possible again today to see intermediate wave (A) as complete.
Within a zigzag, intermediate wave (B) may not move beyond the start of intermediate wave (A) above 2,816.87.
Intermediate wave (B) may subdivide as any one of more than 23 corrective structures. It may be a quick sharp zigzag, or it may be a time consuming sideways triangle or combination. It is impossible to tell which structure intermediate wave (B) may be unfolding as until it is complete. Flexibility is essential with B waves; they exhibit the greatest variety in terms of structure and price behaviour and they are often complicated. Labelling within intermediate wave (B) is most likely to change as it unfolds.
At this stage, intermediate wave (B) is labelled as an incomplete zigzag. Within the zigzag, minor wave B may be a small quick pullback or a small consolidation.
Primary wave 1 lasted 45 sessions. Primary wave 2 may last a Fibonacci 21, 34 or 55 sessions. It may also be in proportion to primary wave 1 at about 45 sessions.
ALTERNATE HOURLY CHART
Click chart to enlarge.
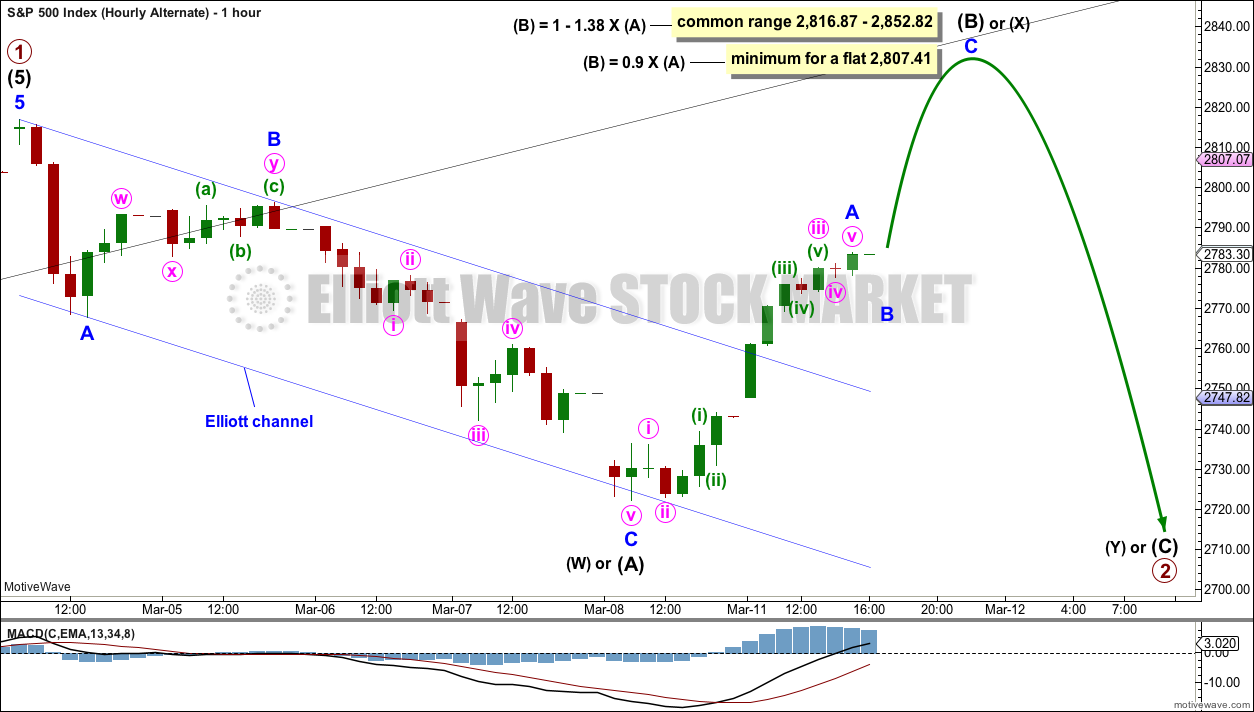
It is also possible to see intermediate wave (A) as a complete three wave structure.
When the first structure in a correction may be a three wave structure, then a flat, combination or double zigzag is indicated. Primary wave 2 may not subdivide as a triangle; triangles may not unfold in second wave positions.
If primary wave 2 unfolds as a flat correction, then within it intermediate wave (A) may be a complete zigzag. Intermediate wave (B) must retrace a minimum 0.9 length of intermediate wave (A) and it may make a new high above the start of intermediate wave (A) as in an expanded flat.
If primary wave 2 unfolds as a double combination, then the first structure in a double may be a complete zigzag labelled intermediate wave (W). Intermediate wave (X) within a double combination has no minimum requirement, but it would most likely be very deep and may make a new high above the start of intermediate wave (W).
A double zigzag now looks very unlikely. Double zigzags have relatively quick and shallow X waves, and here intermediate wave (X) looks too deep for an X wave within a double zigzag.
This wave count may see a new high above 2,816.87 as part of primary wave 2. However, if a new high does occur, then this wave count expects it should exhibit weakness: It should lack support from volume, ATR may decline, and MACD may exhibit bearish divergence with the last high.
If a new high occurs with some strength, then the alternate daily chart below should be considered.
ALTERNATE DAILY CHART
Click chart to enlarge.
It is just possible that primary wave 2 may have been over at Friday’s low. It may have been a very brief and shallow 0.20 zigzag.
There is some strength within upwards movement today that suggests this wave count should be considered as a possibility. However, it would be unusual for a primary degree second wave to be this brief and shallow.
For confidence this wave count requires a classic upwards breakout: a close above 2,816.87 on an upwards day that has support from volume. A bullish signal from either one or more of the AD line, On Balance Volume or inverted VIX wold also indicate this wave count may be correct.
TECHNICAL ANALYSIS
WEEKLY CHART
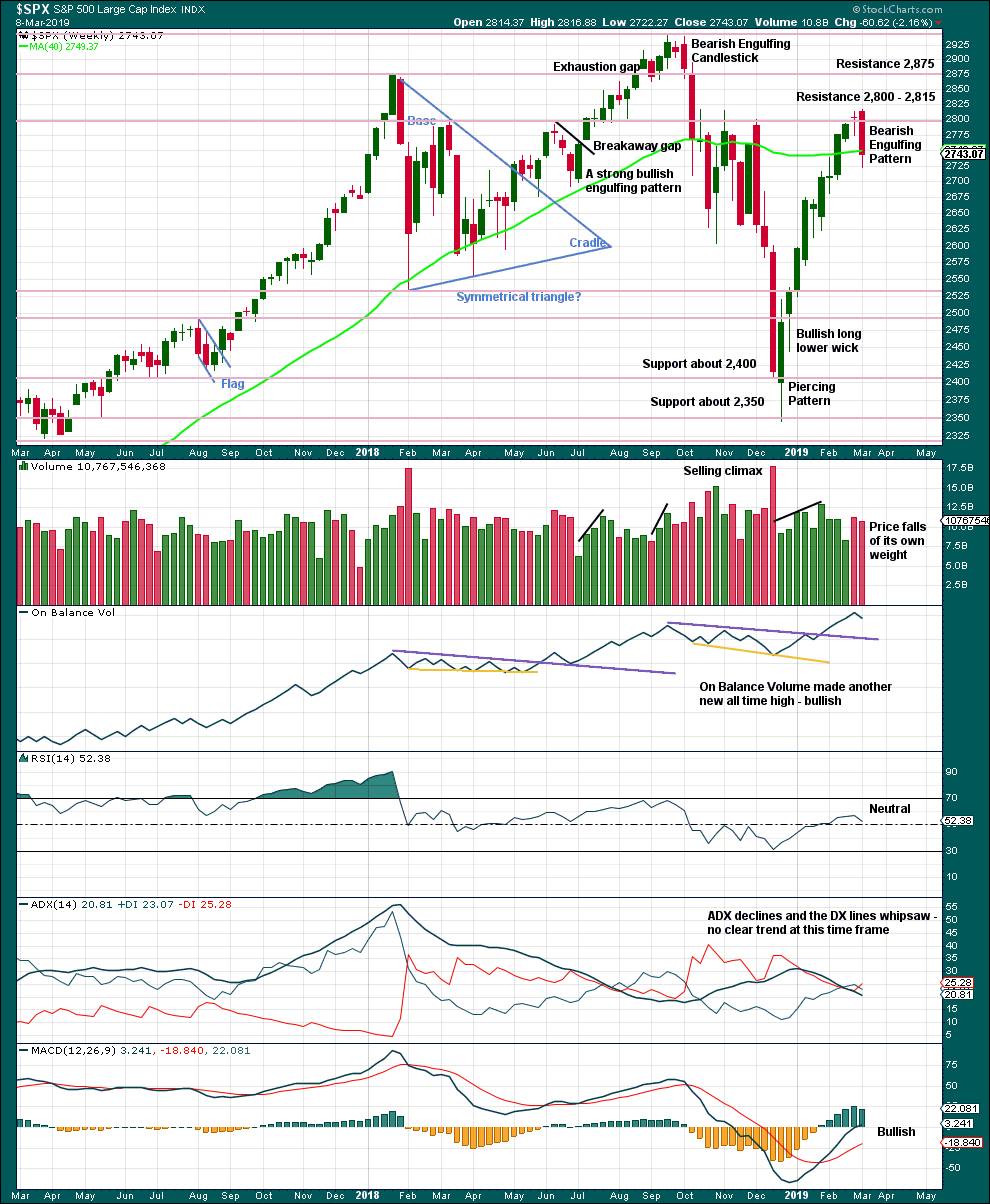
Click chart to enlarge. Chart courtesy of et=”_blank”>StockCharts.com.
Last week the strong Bearish Engulfing candlestick pattern supports the main Elliott wave count.
DAILY CHART
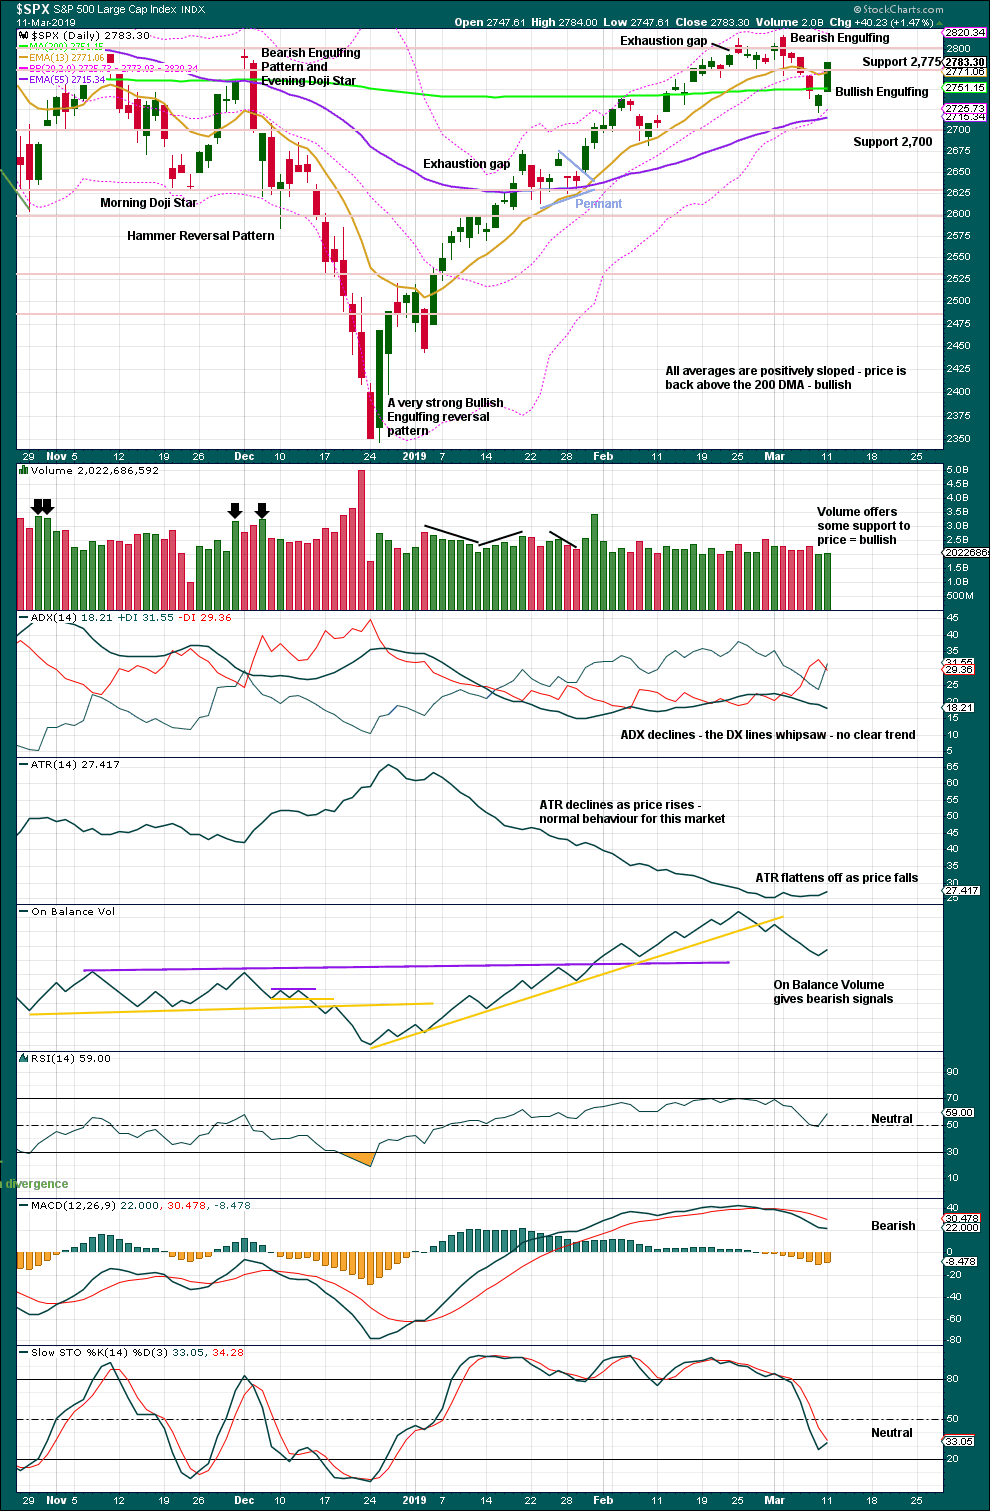
Click chart to enlarge. Chart courtesy of StockCharts.com.
The December 2018 low is expected to remain intact. The two 90% upwards days on 26th December 2018 and 6th January 2019 indicate this upwards trend has internal strength.
On Balance Volume remains overall bearish andsupports the Elliott wave count. Look for next support about 2,625 and then 2,600.
For the short term, the bounce seen today looks likely to continue higher tomorrow. Volume offers a little support to upwards movement and the close was near the high for the session.
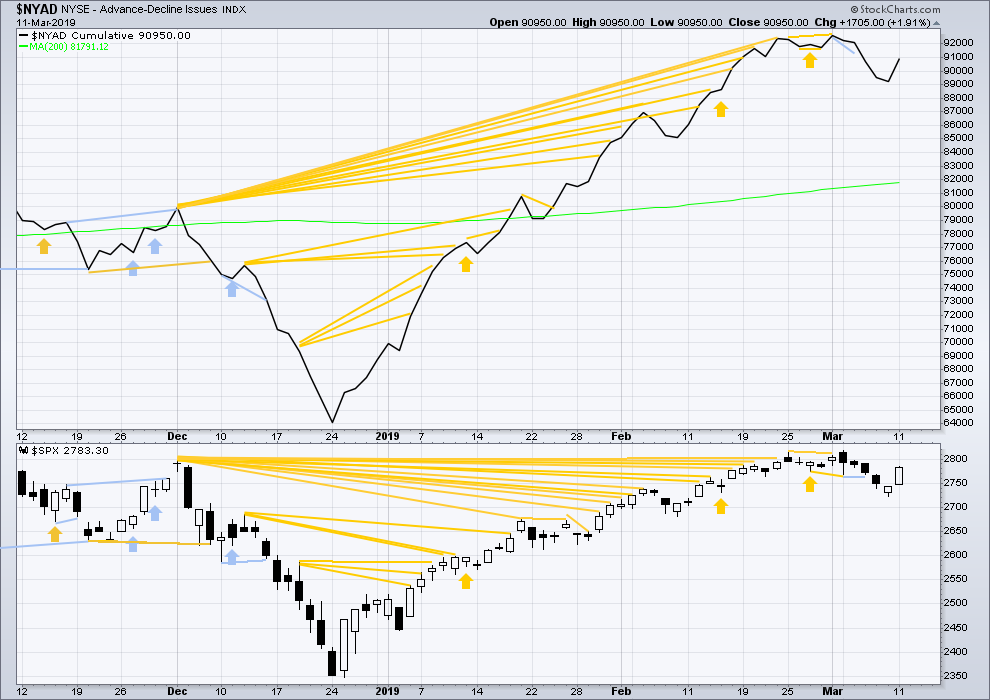
BREADTH – AD LINE
WEEKLY CHART
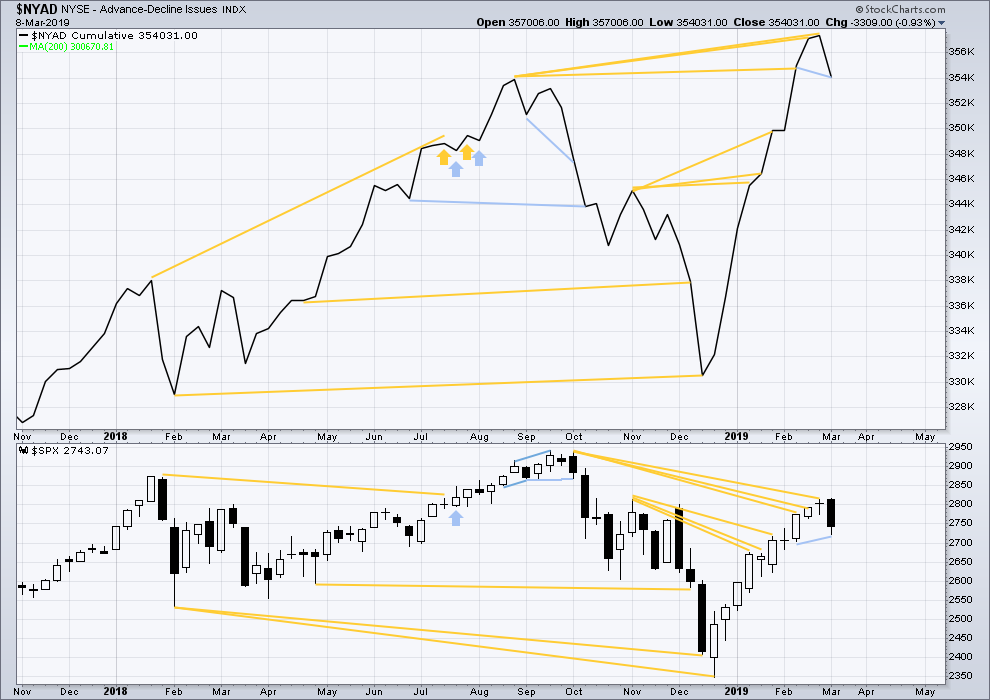
Click chart to enlarge. Chart courtesy of StockCharts.com. So that colour blind members are included, bearish signals
will be noted with blue and bullish signals with yellow.
Every single bear market from the Great Depression and onwards has been preceded by a minimum of 4-6 months divergence between price and the AD line. With the AD line making a new all time high again last week, the end of this bull market and the start of a new bear market must be a minimum of 4 months away, which is mid to end June 2019 at this time.
Last week the AD line has made a new low below the prior low of the week beginning 11th February, but price has not. This divergence is bearish for the short term.
DAILY CHART
Click chart to enlarge. Chart courtesy of StockCharts.com. So that colour blind members are included, bearish signals
will be noted with blue and bullish signals with yellow.
Breadth should be read as a leading indicator.
Today both price and the AD line moved higher. There is no new divergence. The rise in price today has support from rising market breadth.
VOLATILITY – INVERTED VIX CHART
WEEKLY CHART
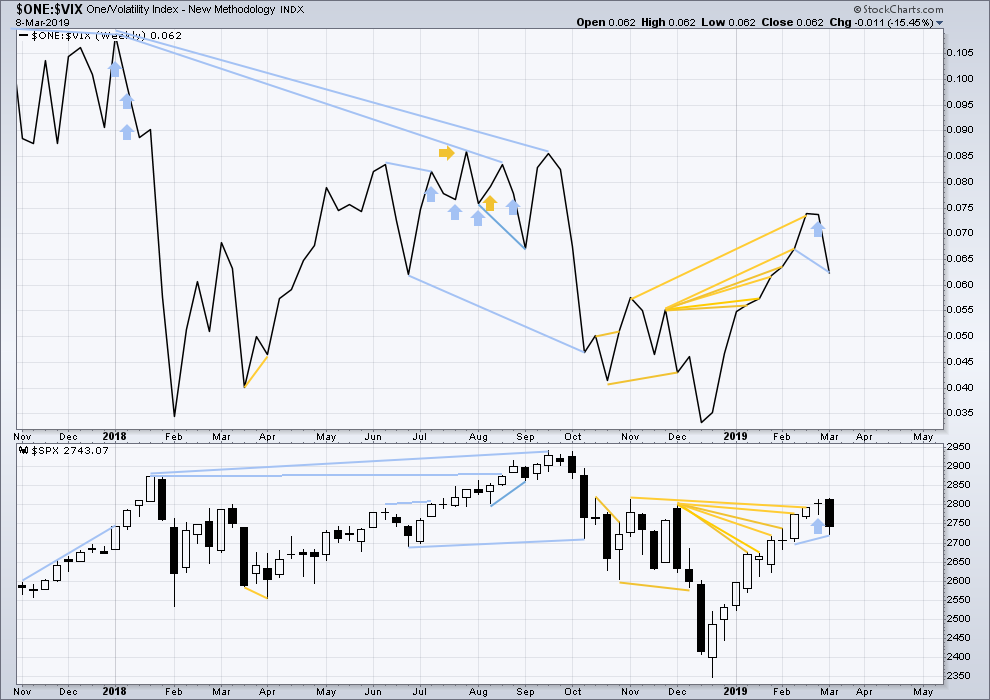
Click chart to enlarge. Chart courtesy of StockCharts.com. So that colour blind members are included, bearish signals
will be noted with blue and bullish signals with yellow.
Inverted VIX has made a new low below the prior low of the week beginning 11th of February, but price has not. This divergence is bearish.
DAILY CHART
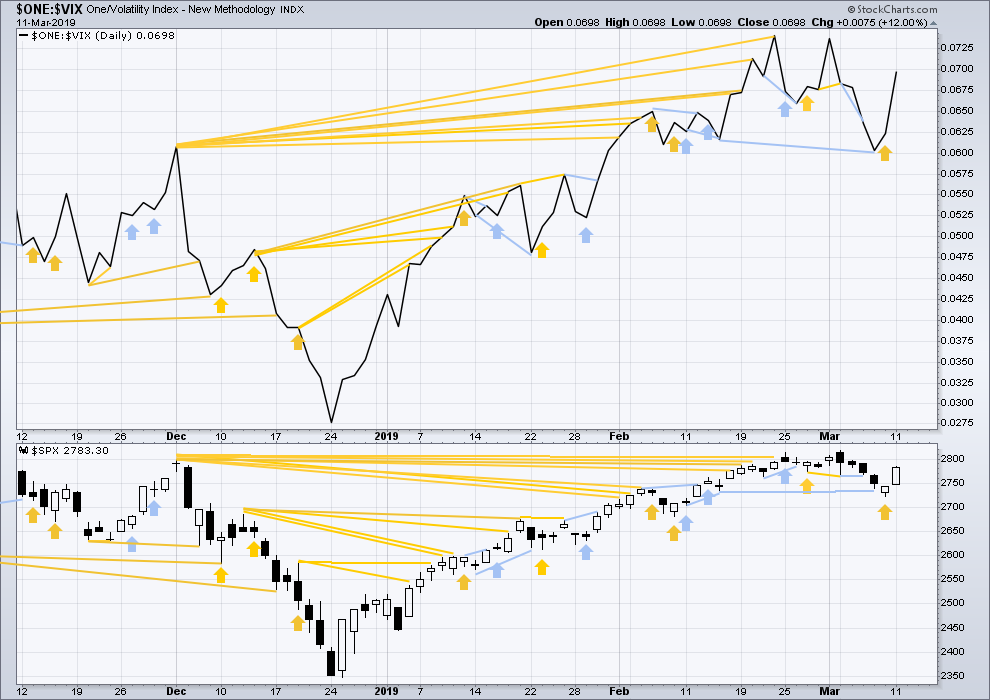
Click chart to enlarge. Chart courtesy of StockCharts.com. So that colour blind members are included, bearish signals
will be noted with blue and bullish signals with yellow.
Today both price and inverted VIX moved higher. However, inverted VIX is moving higher faster than price, so there is a little bullish divergence that supports the alternate daily Elliott wave count. But this is not a very reliable indicator and it is given only a very little weight today in this analysis.
DOW THEORY
Dow Theory confirms a bear market. This does not necessarily mean a bear market at Grand Super Cycle degree though; Dow Theory makes no comment on Elliott wave counts. On the 25th of August 2015 Dow Theory also confirmed a bear market. The Elliott wave count sees that as part of cycle wave II. After Dow Theory confirmation of a bear market in August 2015, price went on to make new all time highs and the bull market continued.
DJIA: 23,344.52 – a close on the 19th of December at 23,284.97 confirms a bear market.
DJT: 9,806.79 – price has closed below this point on the 13th of December.
S&P500: 2,532.69 – a close on the 19th of December at 2,506.96 provides support to a bear market conclusion.
Nasdaq: 6,630.67 – a close on the 19th of December at 6,618.86 provides support to a bear market conclusion.
With all the indices moving now higher, Dow Theory would confirm a bull market if the following highs are made:
DJIA: 26,951.81
DJT: 11,623.58
S&P500: 2,940.91
Nasdaq: 8,133.30.
Published @ 08:38 p.m. EST.
—
Careful risk management protects your trading account(s).
Follow my two Golden Rules:
1. Always trade with stops.
2. Risk only 1-5% of equity on any one trade.
We are very likely looking at exhaustion gaps all around….
speaking of broken triangles…
MNKD is a stock which I have day traded very successfully over that last 2 years
I have always been skeptical to go long and strong since the main drug is having a very difficult time gaining market share.
From a technical point of view, does the apex of this triangle (at around $1.11) provide a strong support?
thanks to anyone who has time to chime in….
Personally, I would want to see price bounce off the top wedge boundary and not return below…fwiw…
I brought something for show and tell. It’s a quick and easy way to tell when you’re in an uptrend or a downtrend or when the trend has changed. For the brief time (probably less than 6 months) that I have been using this it has been very reliable.
The chart that is used is
• The Heikin-Ashi 10 minute chart
• With the Exponential Moving Average set to a 13 period time frame
In this technique we pay attention to the real bodies of the candlesticks. We ignore the shadows of the candlesticks. Here are the rules
• If the entire real body is above the EMA line, you are in an uptrend
• If the entire real body is below the EMA line, you are in a downtrend
• If the entire real body is on both sides of the EMA line, the trend may be changing
To verify a trend change, here is the rule
• After a real body that is on both sides of the EMA line, the next real body that is entirely either above or below the line is telling you what the trend is.
And the above rule will verify whether the trend has changed or not.
Examples from today …
• Real body A indicates that the trend may be changing, and the next candle verifies that the trend HAS changed from down to up
• Real body B indicates that the trend may be changing, and the next candle verifies that the trend HAS NOT changed
• Real body C indicates that the trend may be changing, and the next candle verifies that the trend HAS NOT changed
• Real body D indicates that the trend may be changing, and the next candle also indicates a possible trend change. Finally, the second candle after D indicates that the trend HAS changed from up to down
Without using this technique, look at the candlesticks from 11 o’clock through 3 o’clock. It’s extremely difficult to tell that the trend has changed from up to down when you get to 3 o’clock. Using this technique today, you would have started at 3 o’clock to exit longs and enter short positions.
thank you, very interesting and helpful
YW
Thanks for the info CM, very interesting and informative.
The more I see and hear about Heikin Ashi candles, the more untreated I get. There’s a free intro to this type of candlestick at a website called cartingwealth.com.
Do you have any other suggestions to learn about these techniques?
Hi ari,
I don’t have a good source for an authoritative guide to H-A . I learned about them from online info. The techniques that I have mentioned are all invented in-house by me, based on real world observations.
From what I see, the HFT algo’s that run the market are also using price to draw charts that are based on H-A signals. I think that H-A is a main tool in signaling market direction. H-A isn’t just a quirky little side show novelty.
I’ll check out cartingwealth.com thanks!
This is good work brother …
And a very concise overview..
Makes it understandable… especially as it relates to other signs
Makes probability increase tremendously and if you just handle proper sizing and account management
You could make serious returns if coupled with the right trading instrument and timing of premiums
That’s an art that still applies and is a lost art in some ways…
So you can get quality leveraging at the right moments and make large % hits on lower total money risked
And if you know you are going to be right a certain % and take enough “shots”
The % return because of the multiples … makes up for any misses
Sounds like we need to make an algorithm ..:)
Make a trading strategy be automatic with the proper sizing, timing and derivative trading instrument
I bet you could be really rich in a year or two
Starting with around 100k
Hey Scott,
The 10 minute chart is the key. I’ve tried to apply the same idea to all the other timeframes and that will get you whipsawed. So, the 10 minute chart has been a valid intraday tactic for me.
One additional quick note … this works for me on trading the ES
I have no idea how it would work on NFLX or GM or anything other than the ES
Main hourly chart updated:
A small barrier triangle may be ending for minor wave B.
Alternate hourly chart updated:
Essentially the same.
My!
Nice charting…! 🙂
?
Aaaaannnd… another triangle bites the dust.
Here we go! 🙂
where’s that triangle thrust ?
Anticipation….! 🙂
They are going to let this play out going into the close it appears.
This is likely going to be a terminal move up so probably not a bad idea to ring the register on some profits at least. It would be just like them to try and trap longs overnight.
Thanks for the market play by play Verne!
I really missed you guys!
I will be going on Sabbatical for about six months so I thought I would hang with the crew for a few days.
I cannot believe I am not going to do ANY trading for that long, ahead of getting the new trading group up and running.
Say what? Wow, this is news to me. Best of luck with the new launch! I’m sure you will do great! There will be a hole on this board … I have enjoyed your posts very much. Knock ‘em out of the park!
Is that little spurt it??
Come on banksters.
You can do a lot better than that!! 🙂
Six taps on the 2800 ceiling rejected so far ( 15 min.)
The bulls are not biting so the banksters are going to HAVE to use leverage to propel price past that pivot. What are they waiting for?
Out of bullets? 🙂
No coiling anymore Verne?
Still is. I expect an upward break.
oh its coiling, got a big bet here north , stop loss at A of the triangle SPY 279.2
good R/R
Not today
We have another excellent potential sign post to alert of a trend change. The second gap in NDX 100 as well as the prior both SHOULD be closed on the first wave down. If either provides support we are not quite done imho…
No possibility of trend change until hourly bars start having lower lows. That hasn’t happened since mid-day last Friday (day session data). Daily trend is (today) at neutral (after 2 bars of “down”), hourly trend is definitely up. For now.
Yep! I agree.
Opening “stink bid” in SPY 3/22 276 strike puts for 0.75 or better.
Idea is to get filled on any spike upward out of coiling formation.
Remember, sometimes coils can collapse as well….
The spike above 2800 might be short-lived, designed to draw in bulls keenly watching that level. I would be wary if we fail to CLOSE above…
SPX is stalling at the 78.6% retrace level of the 5 day downmove (2797). Turns out there’s lots of resistance exactly here showing from early last week, as well.
A natural place to stall and consolidate…or turn back down entirely.
Stalling, or coiling?
Yep! Looks like they are getting ready to gap past 2800.
How do I know that, you ask? 😉
Is it because QQQ made a new high over March 4th, or is it because of VIX gaping down?
Peter S? 🙂 🙂 🙂
oh man, I went to a Muse concert last night and just tuned in …..
maybe a cobra coil? lol 🙂
You are hereby awarded an honorary membership to the new Monument Trading Alliance Posse!
50K minimum is also waived! 🙂 🙂 🙂
How do I start my membership benefits? 🙂
ES ran into a buzz saw at 2800.
Few sellers. Few buyers.
The banksters are going to have to apply more leverage to power past this resistance pivot.
If they do, we will see a gap higher past the pivot.
I will be shorting any such manouevre…Hyuk!
Are you short yet?
Deployed a big SPY 274/275 bull put credit spread three weeks out early yesterday and already bought back short puts at just about break even. A close above 2800 and I re-deploy another at 276/277 same expiration.
I cannot ever remember seeing major indices gap in opposite directions at the open, much less two days in succession. The market is telling us that something is rotting in Denmark….! Can anyone smell it? 🙂
Yepppp.
Here’s 4 hour /ES including overnight data. This is time #4 there’s been a significant price pullback; each time prices fairly quickly work up to new highs and beyond. This time the same? The momentum is very high here; it would seem likely. I like Shark’s idea this pullback was the 4 of the five wave move off the Dec lows, but I don’t know if/how such a count might work. This chart shows the sell off came a bit short of the head and shoulders measured move depth. If price doesn’t march to new highs here but comes back down…another H&S top sets up with the neckline at the 2729 (/ES, not spx) lows. A measured move down from there would take things down to about the 2650 area.
I’m pretty much assuming price is going to continue in this channel until it doesn’t, particularly if new highs are hit here shortly. Don’t argue with a bull charging.
🙂
Foiled again.