
Downwards movement continued as the Elliott wave analysis expected.
Summary: Targets for a multi-week pullback are 2,637 or 2,656.
At its end, this pullback may offer an opportunity to join the upwards trend prior to new all time highs.
New updates to this analysis are in bold.
The biggest picture, Grand Super Cycle analysis, is here.
Last published monthly charts are here. Video is here.
ELLIOTT WAVE COUNT
WEEKLY CHART
Click chart to enlarge.
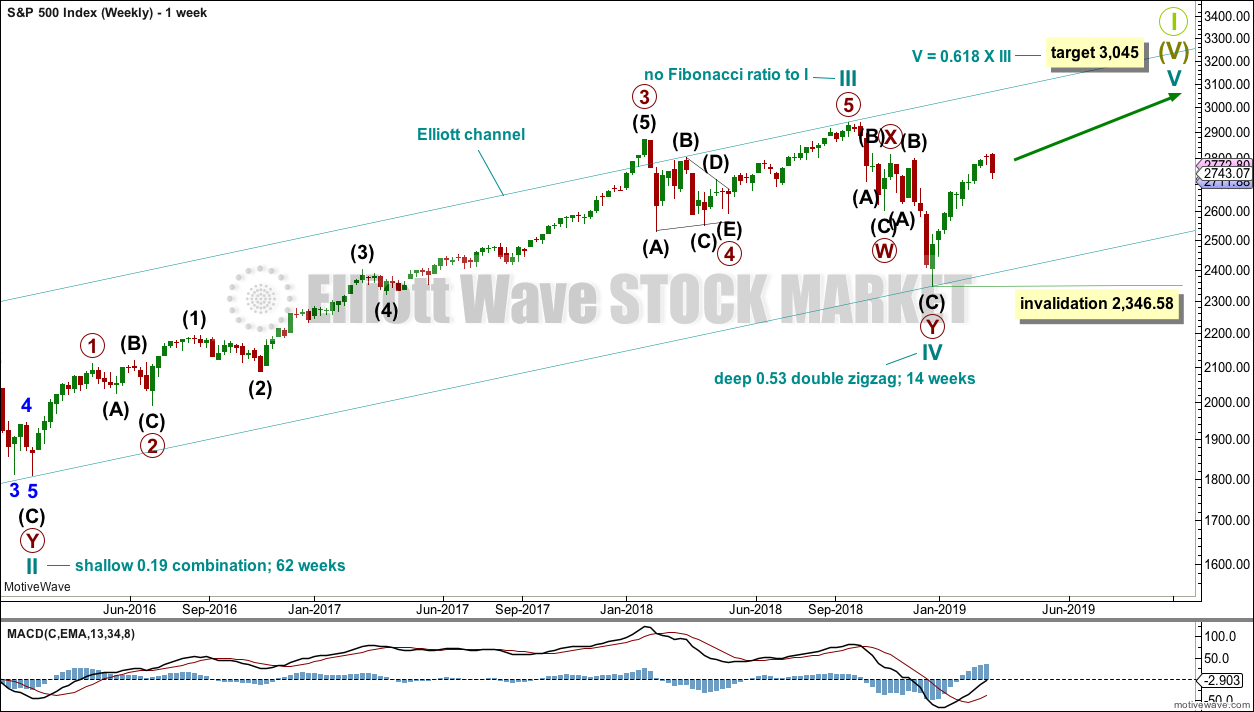
This weekly chart shows all of cycle waves III, IV and V so far.
Cycle wave II fits as a time consuming double combination: flat – X – zigzag. Combinations tend to be more time consuming corrective structures than zigzags. Cycle wave IV has completed as a multiple zigzag that should be expected to be more brief than cycle wave II.
Cycle wave IV may have ended at the lower edge of the Elliott channel.
Within cycle wave V, no second wave correction may move beyond the start of its first wave below 2,346.58.
Although both cycle waves II and IV are labelled W-X-Y, they are different corrective structures. There are two broad groups of Elliott wave corrective structures: the zigzag family, which are sharp corrections, and all the rest, which are sideways corrections. Multiple zigzags belong to the zigzag family and combinations belong to the sideways family. There is perfect alternation between the possible double zigzag of cycle wave IV and the combination of cycle wave II.
Although there is gross disproportion between the duration of cycle waves II and IV, the size of cycle wave IV in terms of price makes these two corrections look like they should be labelled at the same degree. Proportion is a function of either or both of price and time.
Draw the Elliott channel about Super Cycle wave (V) with the first trend line from the end of cycle wave I (at 2,079.46 on the week beginning 30th November 2014) to the high of cycle wave III, then place a parallel copy on the low of cycle wave II. Cycle wave V may find resistance about the upper edge.
It is possible that cycle wave V may end in October 2019. If it does not end there, or if the AD line makes new all time highs during or after June 2019, then the expectation for cycle wave V to end would be pushed out to March 2020 as the next possibility. Thereafter, the next possibility may be October 2020. March and October are considered as likely months for a bull market to end as in the past they have been popular. That does not mean though that this bull market may not end during any other month.
DAILY CHART
Click chart to enlarge.
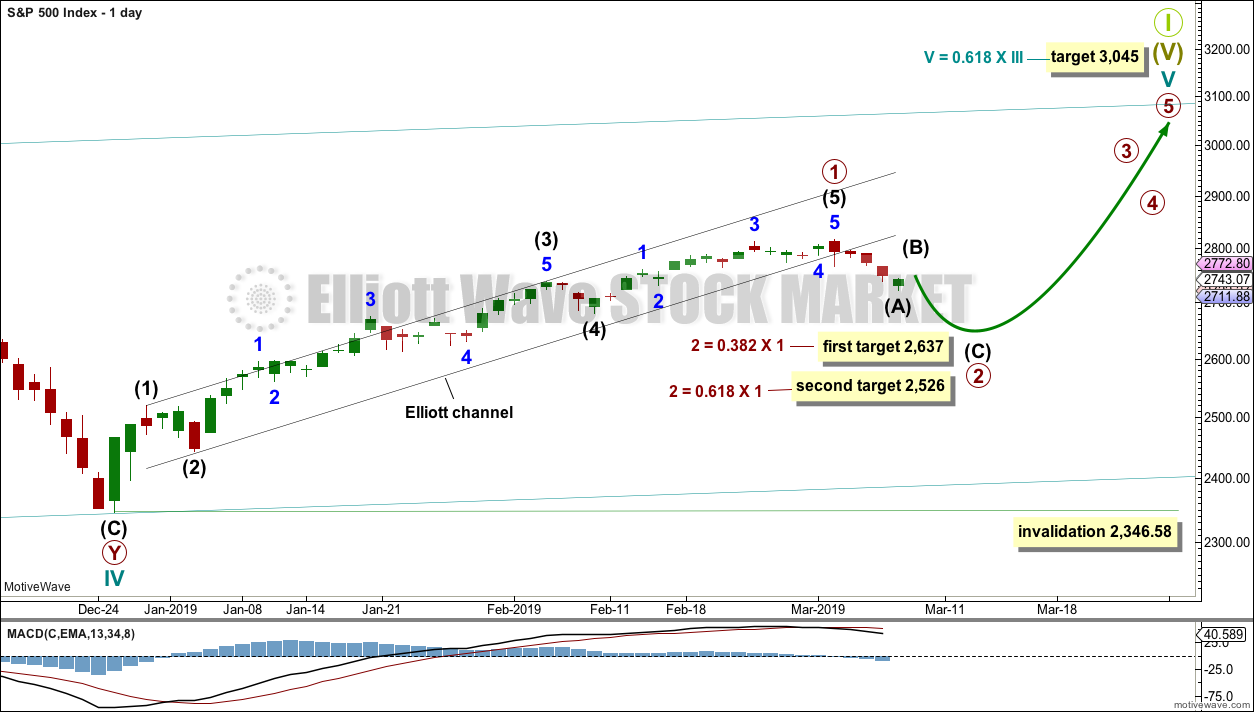
The daily chart will focus on the structure of cycle wave V.
Within Super Cycle wave (V), cycle wave III may not be the shortest actionary wave. Because cycle wave III is shorter than cycle wave I, this limits cycle wave V to no longer than equality in length with cycle wave III at 3,477.39. A target is calculated for cycle wave V to end prior to this point.
Cycle wave V must subdivide as a five wave motive structure, either an impulse or an ending diagonal. An impulse is much more common and that will be how it is labelled. A diagonal would be considered if overlapping suggests it.
Primary wave 1 is labelled as complete. Two targets are given for primary wave 2. The higher 0.382 Fibonacci ratio may be preferred in the first instance. If price keeps dropping through this target or if it gets there and the structure of primary wave 2 is incomplete, then the second lower target may be used.
Primary wave 2 may not move beyond the start of primary wave 1 below 2,346.58.
Primary wave 2 would most likely subdivide as a zigzag, but it may subdivide as any corrective structure except a triangle. The focus for the next few weeks will be on identifying when a complete structure for primary wave 2 may be seen.
MAIN HOURLY CHART
Click chart to enlarge.
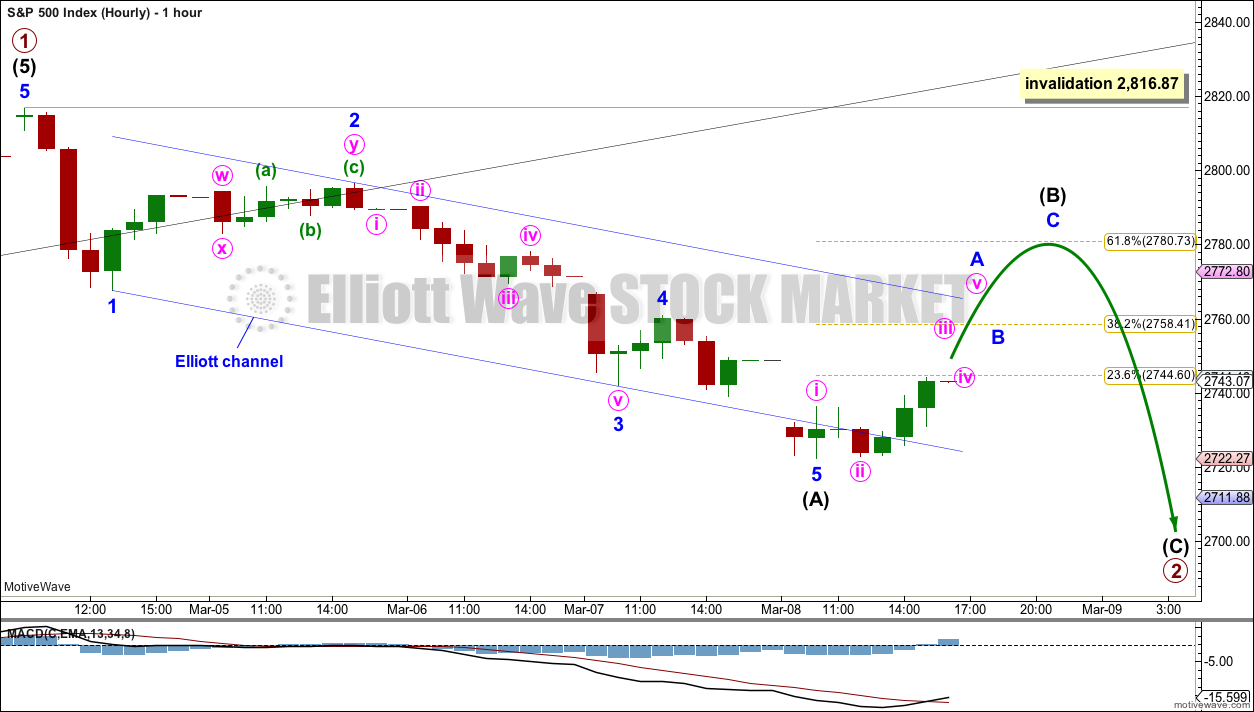
The most likely structure for primary wave 2 would be a zigzag. The next most likely structure would be a double zigzag.
Within a zigzag, intermediate wave (A) must subdivide as a five wave structure. It is possible again today to see intermediate wave (A) as complete.
Within a zigzag, intermediate wave (B) may not move beyond the start of intermediate wave (A) above 2,816.87.
Intermediate wave (B) may subdivide as any one of more than 23 corrective structures. It may be a quick sharp zigzag, or it may be a time consuming sideways triangle or combination. It is impossible to tell which structure intermediate wave (B) may be unfolding as until it is complete. Flexibility is essential with B waves; they exhibit the greatest variety in terms of structure and price behaviour and they are often complicated. Labelling within intermediate wave (B) is most likely to change as it unfolds.
Primary wave 1 lasted 45 sessions. Primary wave 2 may last a Fibonacci 21, 34 or 55 sessions. It may also be in proportion to primary wave 1 at about 45 sessions.
ALTERNATE HOURLY CHART
Click chart to enlarge.
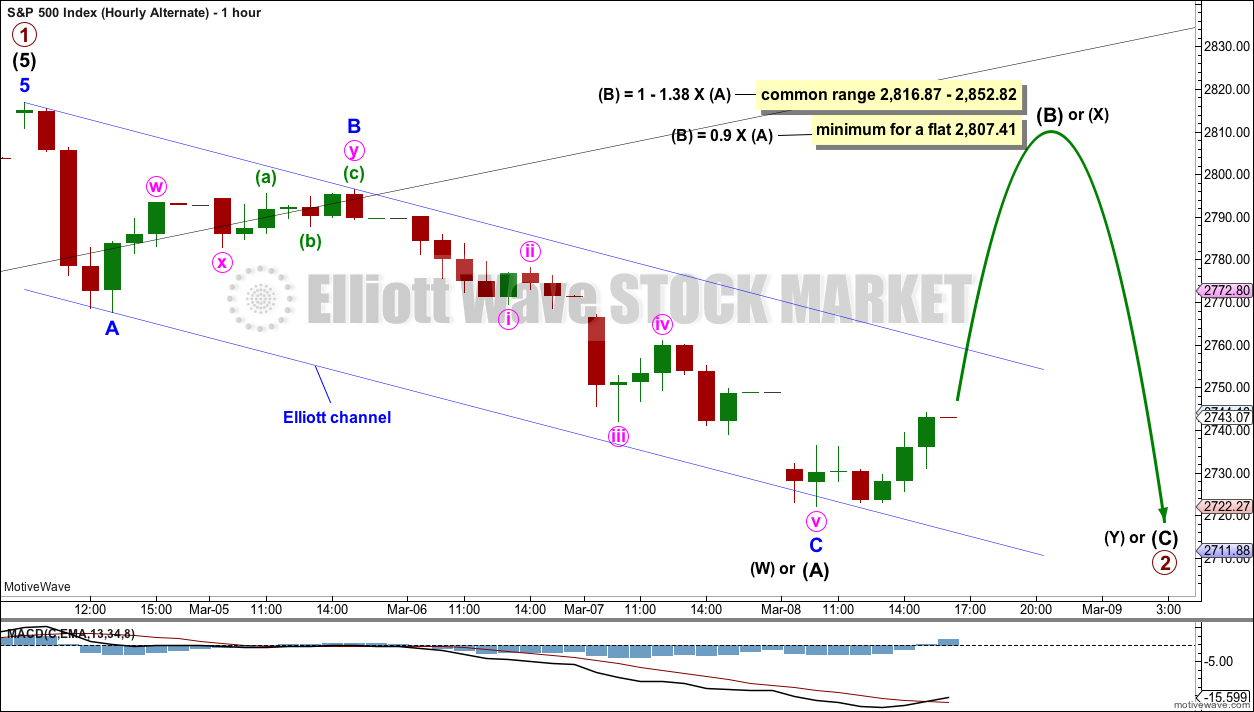
It is also possible again that a zigzag may be complete at today’s low.
When the first structure in a correction may be complete as a three wave structure, then a flat, combination or double zigzag is indicated. Primary wave 2 may not subdivide as a triangle; triangles may not unfold in second wave positions.
If primary wave 2 unfolds as a flat correction, then within it intermediate wave (A) may be a complete zigzag. Intermediate wave (B) must retrace a minimum 0.9 length of intermediate wave (A) and it may make a new high above the start of intermediate wave (A) as in an expanded flat.
If primary wave 2 unfolds as a double combination, then the first structure in a double may be a complete zigzag labelled intermediate wave (W). Intermediate wave (X) within a double combination has no minimum requirement, but it would most likely be very deep and may make a new high above the start of intermediate wave (W).
If primary wave 2 unfolds as a double zigzag, then the first zigzag in the double may be complete labelled intermediate wave (W). The double may then be joined by a three in the opposite direction labelled intermediate wave (X), which would be incomplete. Intermediate wave (X) within a double zigzag would most likely be shallow and may subdivide as any corrective structure, but would most likely be a single zigzag. Intermediate wave (Y) would then be expected to move reasonably below the end of intermediate wave (W) to achieve its purpose of deepening the correction and giving the double zigzag a strong slope.
TECHNICAL ANALYSIS
WEEKLY CHART
Click chart to enlarge. Chart courtesy of et=”_blank”>StockCharts.com.
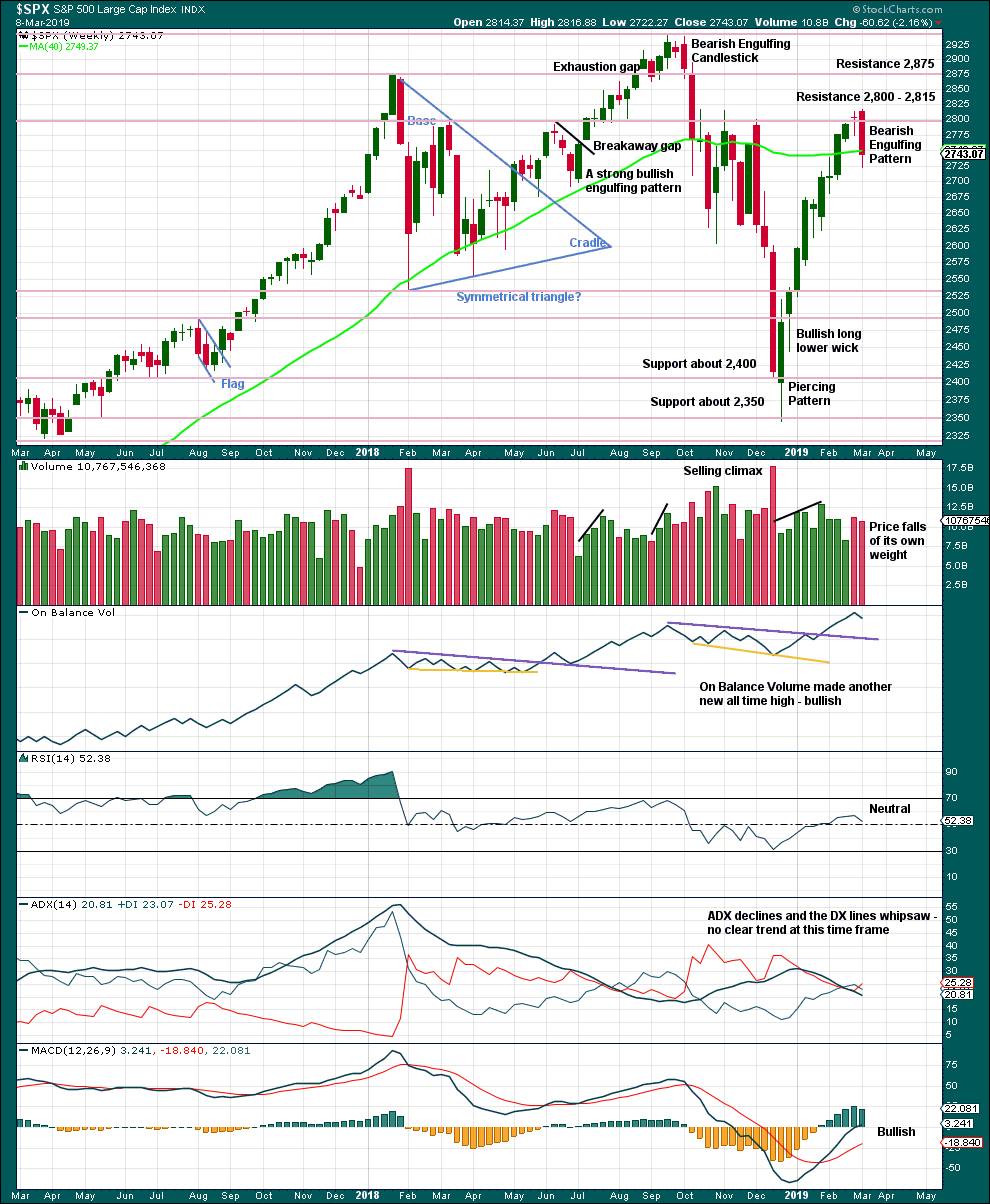
This week the strong Bearish Engulfing candlestick pattern supports the Elliott wave count.
DAILY CHART
Click chart to enlarge. Chart courtesy of StockCharts.com.
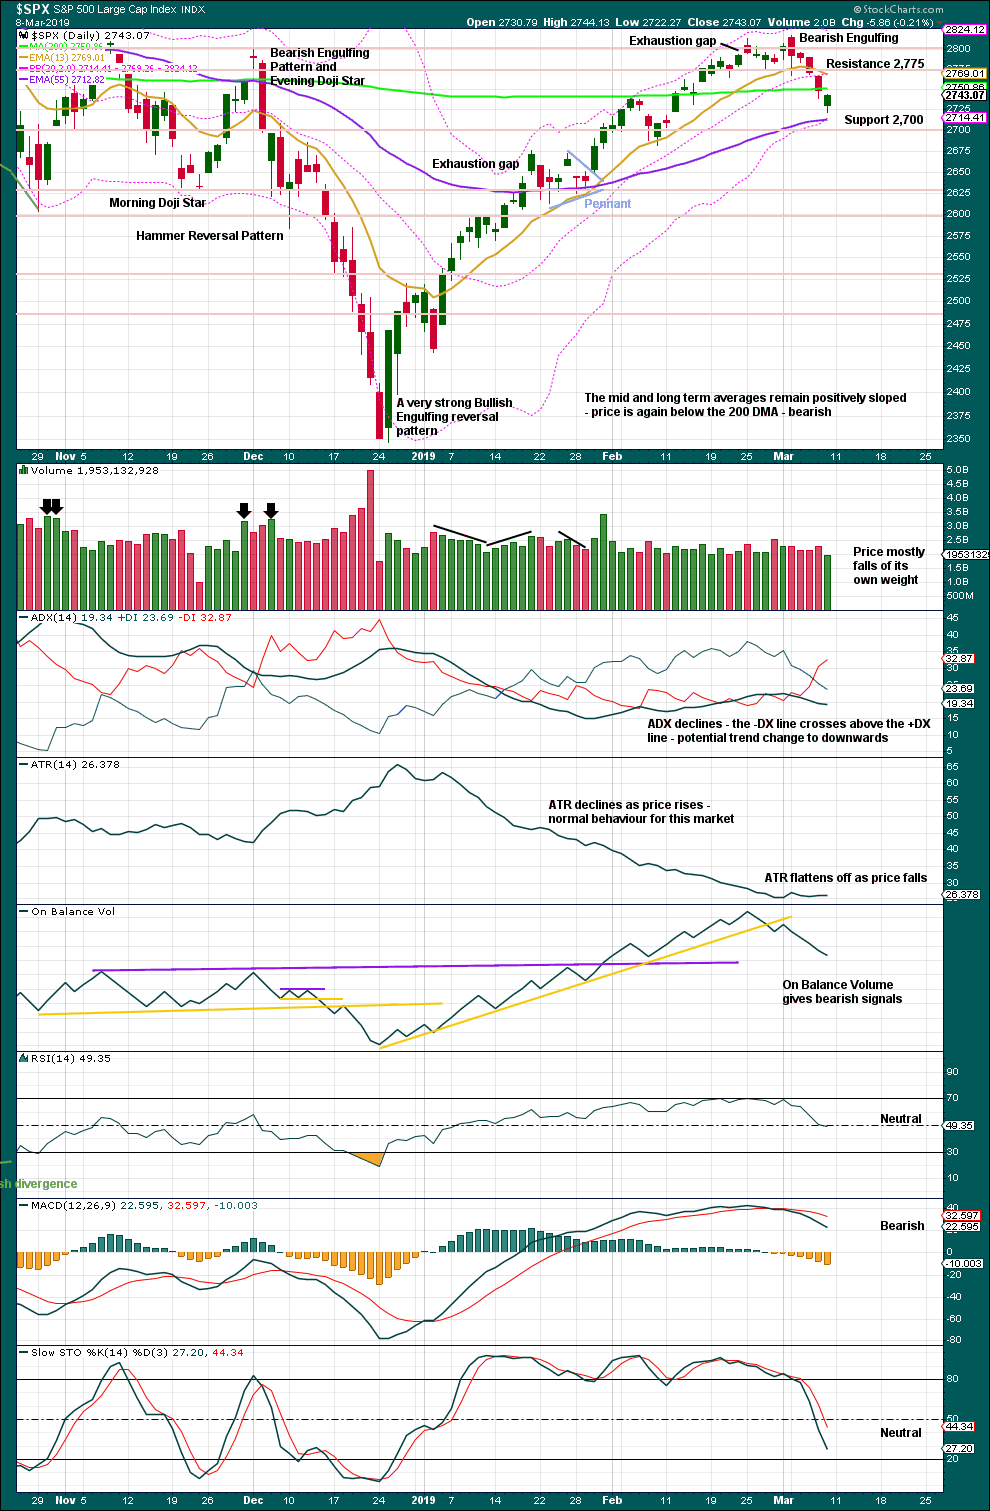
The December 2018 low is expected to remain intact. The two 90% upwards days on 26th December 2018 and 6th January 2019 indicate this upwards trend has internal strength.
On Balance Volume supports the Elliott wave count. Look for next support about 2,625 and then 2,600.
BREADTH – AD LINE
WEEKLY CHART
Click chart to enlarge. Chart courtesy of StockCharts.com. So that colour blind members are included, bearish signals
will be noted with blue and bullish signals with yellow.
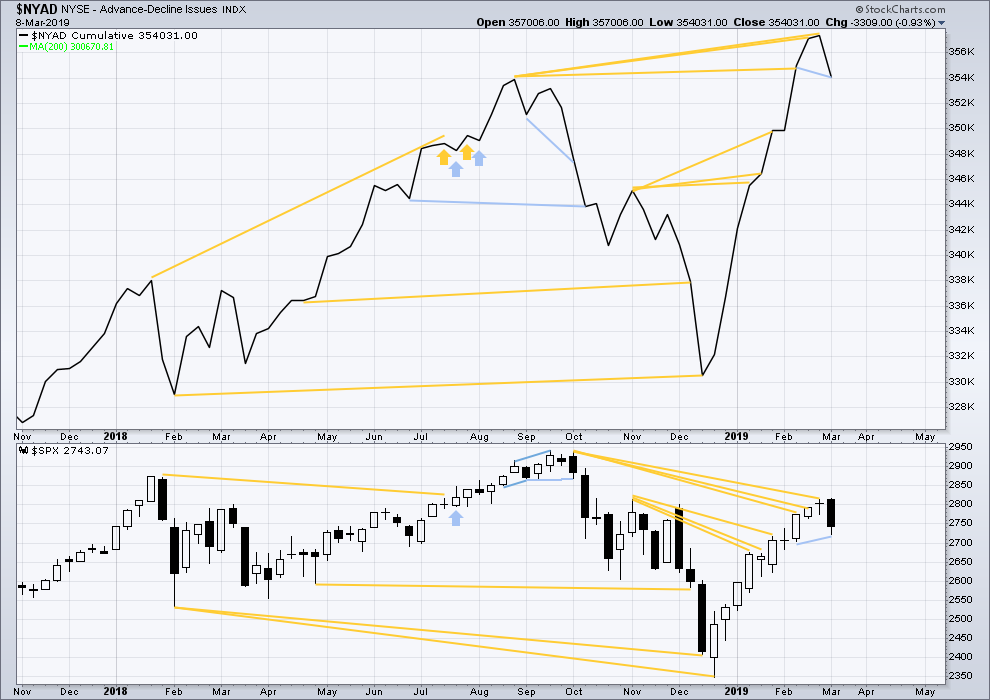
Every single bear market from the Great Depression and onwards has been preceded by a minimum of 4-6 months divergence between price and the AD line. With the AD line making a new all time high again last week, the end of this bull market and the start of a new bear market must be a minimum of 4 months away, which is mid to end June 2019 at this time.
This week the AD line has made a new low below the prior low of the week beginning 11th February, but price has not. This divergence is bearish for the short term.
DAILY CHART
Click chart to enlarge. Chart courtesy of StockCharts.com. So that colour blind members are included, bearish signals
will be noted with blue and bullish signals with yellow.
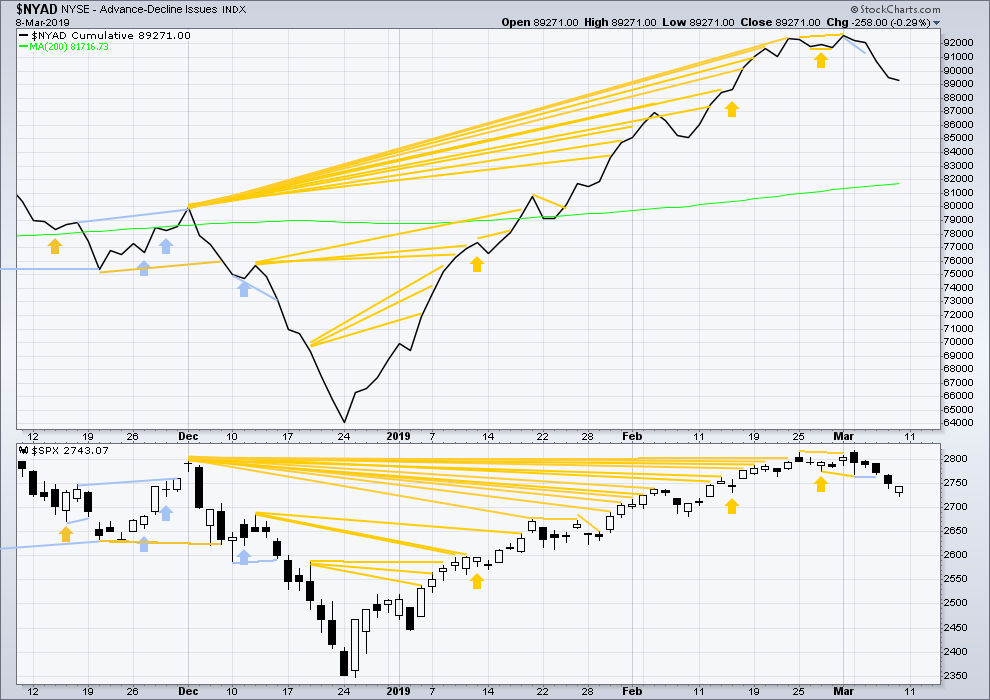
Breadth should be read as a leading indicator.
Today both price and the AD line moved lower. There is no new divergence. The fall in price today has support from a decline in market breadth.
VOLATILITY – INVERTED VIX CHART
WEEKLY CHART
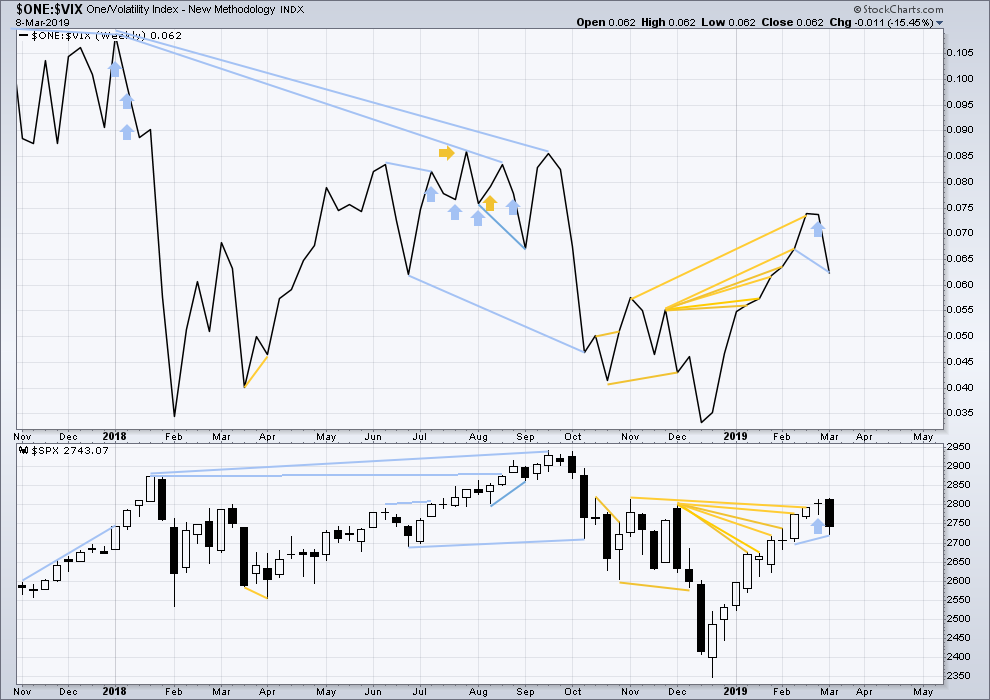
Click chart to enlarge. Chart courtesy of StockCharts.com. So that colour blind members are included, bearish signals
will be noted with blue and bullish signals with yellow.
Inverted VIX has made a new low below the prior low of the week beginning 11th of February, but price has not. This divergence is bearish.
DAILY CHART
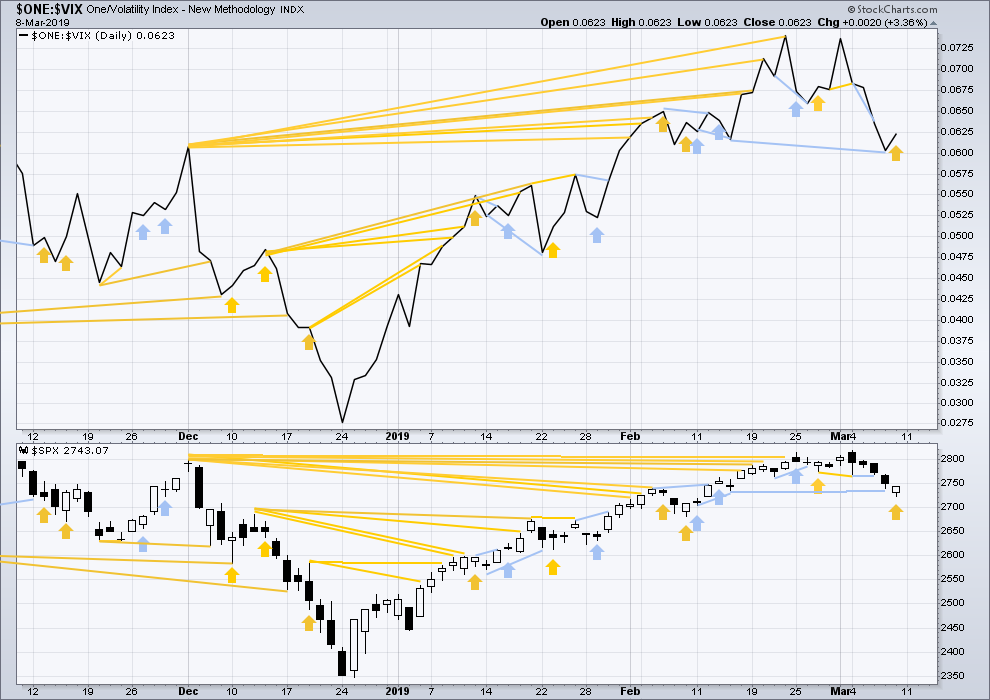
Click chart to enlarge. Chart courtesy of StockCharts.com. So that colour blind members are included, bearish signals
will be noted with blue and bullish signals with yellow.
On Friday price moved lower, but inverted VIX moved higher. This divergence is bullish for the short term.
DOW THEORY
Dow Theory confirms a bear market. This does not necessarily mean a bear market at Grand Super Cycle degree though; Dow Theory makes no comment on Elliott wave counts. On the 25th of August 2015 Dow Theory also confirmed a bear market. The Elliott wave count sees that as part of cycle wave II. After Dow Theory confirmation of a bear market in August 2015, price went on to make new all time highs and the bull market continued.
DJIA: 23,344.52 – a close on the 19th of December at 23,284.97 confirms a bear market.
DJT: 9,806.79 – price has closed below this point on the 13th of December.
S&P500: 2,532.69 – a close on the 19th of December at 2,506.96 provides support to a bear market conclusion.
Nasdaq: 6,630.67 – a close on the 19th of December at 6,618.86 provides support to a bear market conclusion.
With all the indices moving now higher, Dow Theory would confirm a bull market if the following highs are made:
DJIA: 26,951.81
DJT: 11,623.58
S&P500: 2,940.91
Nasdaq: 8,133.30.
Published @ 10:19 p.m. EST.
—
Careful risk management protects your trading account(s).
Follow my two Golden Rules:
1. Always trade with stops.
2. Risk only 1-5% of equity on any one trade.
I’ve figured out why I was late this morning. It must be daylight savings in the northern hemisphere.
Okay. I’ll be quicker to the mark tomorrow folks.
I was expecting an up day, but not like this! It was a very bullish day right into the close. I expect a gap up tomorrow…
Sorry I’m late today everybody.
It’s possible that intermediate (B) could be a quick sharp zigzag. It’s equally as possible that it could continue sideways all week from here.
Substituting SPX variability into the model, I no longer have any higher targets. I’m reading today as a pullback for entry into primary 2. This isn’t a real newsflash since Lara told us this last week but anyway I’m on board. Ditto for primary one being done.
Im still off the mind like I said last week that its possible the last selloff was a wave 4 down and am looking for slight new highs
Hard to argue with that thesis here. NDX is REALLY strong…
I realize it could be a B but the proportion to 2 looks right to me anyway. Have stops tight here in either case.
TVIX on sale!
Incredible they smashed it down to 29.76….wow! 🙂
Yes brother
Time to re enter
I sold 30-29 put spreads in vxxb end of day as a start
And sold fridays 280-282 call spreads in spy end of day as well ….
Those are going to be long and short strikes respectively if they wind up in the money
Sold my lower part of my GM call butterfly hedge for Friday
Holding the short upside call spread bearish for more shares if they win up in money
Looking to sell nflx upside calls again tomorrow and maybe do some put spreads in spy for Wednesday
I would normally trade this apparent bullish price action to the upside but something not quite right about it. Despite the bullish appearance, the larger context suggests it could be a cabal contrivance. Apart from long vol trades I am on the sidelines for now.
This is all way too cute. I should have held those SPY 273 calls a bit longer lol!
I’m happy to have exited my short spreads late Friday and put on long spreads instead. That was fortuitous. I’d not be happy holding short spreads here.
Yep. Those intra-day reversals generally a good warning for bears to exit the pool. I covered by SPY 272 short calls as well…
Flagging action has now morphed into yet another sideways coil.
Remarkably bullish price action and not at all what I expected, Tom’s chart notwithstanding. Lol! Curious to see how EW count is affected.
Flagging action. We could go much higher….
Anyone took a look at Tom’s energy chart? Amazing isn’t it??!!! Wow!
2785…. lots of resistance
The banksters are buying, so we have to be very circumspect about usual T.A.
If we close above 2750 I think they are going to power through that area….
61.8%. While NDX scribbles on the 78.6%, and RUT hits and starts to turn off it 38.2%. “Alignment”, which doesn’t mean they all turn here; they may turn right back up together and keep charging.
It took massive (read leverage) buying power to print that DJIA bullish engulfing candle after the huge gap down. If the banksters are buying, we are headed higher, period.
My only question is how much higher. I doubt they will negate the weekly outside reversal candle but who is to say they won’t?
Oh so typical.
They always send the cubbies running for the hills just ahead of the real downside action.
Kudos to Peter S that caught that coil! 🙂
I am learning, slowly …
Didn’t someone short BA last week …. nice call
that was me, on general principle of it being grossly overbought at the same time the market was looking quite toppy. however, I took my profit late last week too, in anticipation of this market bounce. Little did I know a plane would crash…
SPX hourly back to neutral trend and pushing against 38% retrace level already…I expect a turn back down higher though, 62% or 78%.
NDX much strong today, already at 61.8%, and stalling there at the moment.
While RUT can’t make it above it’s 23% retrace level. Hmmm…the canary isn’t real healthy, here.
NDX now getting close to the 78.6% at 7150.
An awfully strong “bounce”. Most of last week’s sell off recovered in about 1/2 a day. Hmmm.
Hey Kevin, do you see a move back into the Elliot channel as favoring the hourly alternate ?
not sure which elliott channel you are referring to, but I assume the one actually on the hourly alternate chart (vs. the one on the daily chart).
I’m not thinking at the moment about main hourly vs. alt hourly. I’m thinking about the probability associated with the main period, given this remarkable strength.
Lara,
It looks like the weekly on balance volume ticked down on the week although the comment in the chart says another new high for on balance volume. Could you please clarify? Thanks.
Hi Paul C. On the video just following the 10 minute mark, Lara indicates that the new all time high in weekly on-balance volume was for the previous week not this immediate past week. She left that comment on the weekly TA chart as a reminder.
Hope that helps clarify the remarks.
What Rodney said.
I’m trying to point out the last ATH from OBV. Which was the week prior.
SPY ex-dividend date is next Friday, March 15. A dividend of 1.15 per share will be paid to shareholders of record as of the close on Thursday March 14.
This is important to keep track of if you trade SPY options, or the options of any company that pays a dividend. Selling in the money calls prior to the ex-dividend date could result in those calls being exercised the day before ex-dividend and put you on the hook for the dividend due to being short the shares. This can happen even in a spread with both legs in the money with just the short calls being exercised and leaving you unintentionally short the stock. I learned this the hard way some time ago and had to cough up a huge dividend check as I had a very big spread. They ambush you by doing it just before the close the day prior to the ex-dividend date, so even though you can cover the shares by exercising the long calls, it would not be in time to collect the dividend. Bottom line?
Don’t be short SPY in the money calls at the close next Thursday.
Just a bit of inside baseball if you trade spreads. No one ever gave me a heads-up on that one!
Dang! Thanks Verne as always. Gotta look out for that…
Nabbed it again, first. Two in a row is nice. Three times will be a charm. Have a great weekend everyone.
Just a few minutes behind you…
TGIF folks! It was an eventful week.
IWM and the Transports were pointing the way 🙂
I guess the theoretically impending bounce (B or X up) is another chance to load up short on completion. Meanwhile I believe the adage is “stay away from B waves…”
I am curious that we did not breach 2700 on the FIRST wave down. For me personally it does raise a cautionary flag. You simply cannot hide a true leveraged unwind and my trading triggers for high probability “all-in” short side trades don’t go green until and unless we see one. March
OpEx generally the year’s most bullish….
I’m guessing this first wave “might be” minor 1. We have a bearish engulfing candle on the weekly chart in all markets. Most of them engulf the last 2 weekly candles. Im definitely scaling into shorts on this wave up. If we go up that is
BA in the gutter over the wknd due to the another crash of its new 737 fleet. China has grounded all of their new 737’s until further notice. Dow will have the hardest time staying positive tomorrow
Also worth mentioning is that SPX had the lowest RSI on the 60 minute charts since the low December 24th. So we were due for a bounce off Fridays lows.
Could be. I have seen do many violent negations of bearish signals by the banksters that I am even more cautious when they are as clear as an outside reversal week. The busted log-scale trend-line from 2009 was back-tested from below and proved resistance. Surrender of the 200 day also bearish. They never make it easy for the bears. A very deep possible second wave or even some kind of double top would be very much in character.