
Downwards movement was expected after yesterday’s analysis and that is exactly what has happened. Targets remain the same.
Summary: Targets for a multi-week pullback are 2,637 or 2,526. *Edit: corrected
At its end, this pullback may offer an opportunity to join the upwards trend prior to new all time highs.
New updates to this analysis are in bold.
The biggest picture, Grand Super Cycle analysis, is here.
Last published monthly charts are here. Video is here.
ELLIOTT WAVE COUNT
WEEKLY CHART
Click chart to enlarge.
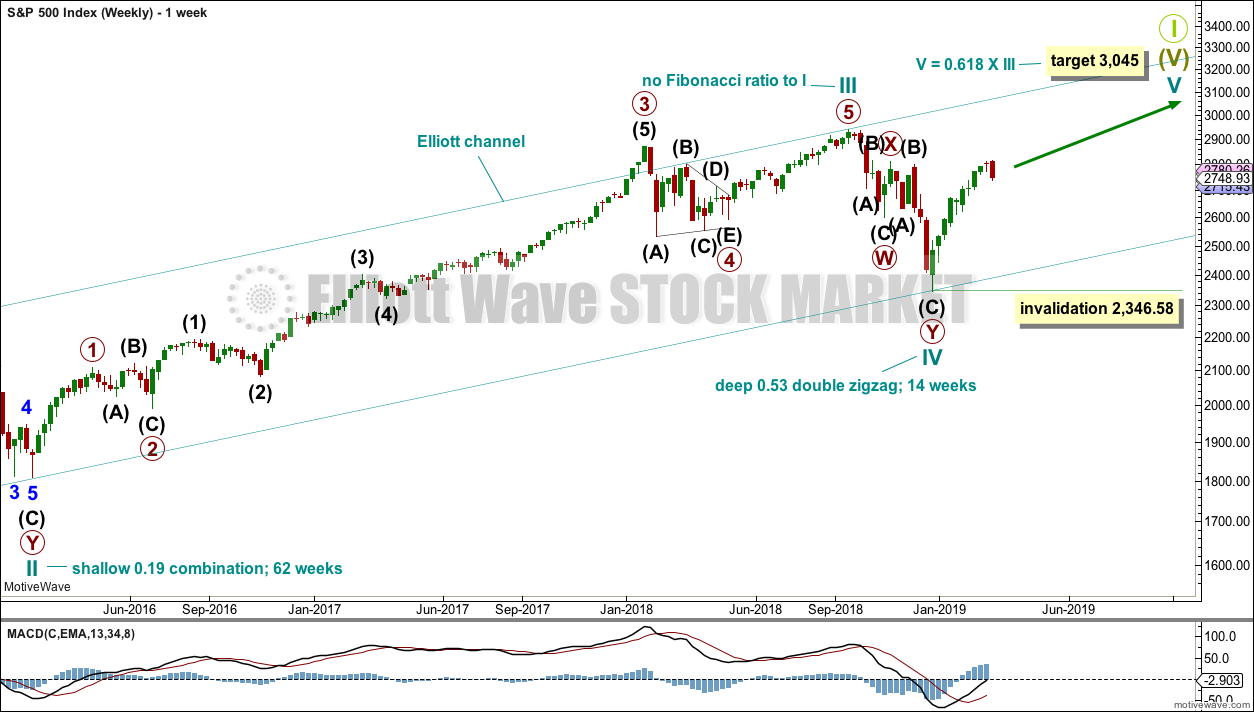
This weekly chart shows all of cycle waves III, IV and V so far.
Cycle wave II fits as a time consuming double combination: flat – X – zigzag. Combinations tend to be more time consuming corrective structures than zigzags. Cycle wave IV has completed as a multiple zigzag that should be expected to be more brief than cycle wave II.
Cycle wave IV may have ended at the lower edge of the Elliott channel.
Within cycle wave V, no second wave correction may move beyond the start of its first wave below 2,346.58.
Although both cycle waves II and IV are labelled W-X-Y, they are different corrective structures. There are two broad groups of Elliott wave corrective structures: the zigzag family, which are sharp corrections, and all the rest, which are sideways corrections. Multiple zigzags belong to the zigzag family and combinations belong to the sideways family. There is perfect alternation between the possible double zigzag of cycle wave IV and the combination of cycle wave II.
Although there is gross disproportion between the duration of cycle waves II and IV, the size of cycle wave IV in terms of price makes these two corrections look like they should be labelled at the same degree. Proportion is a function of either or both of price and time.
Draw the Elliott channel about Super Cycle wave (V) with the first trend line from the end of cycle wave I (at 2,079.46 on the week beginning 30th November 2014) to the high of cycle wave III, then place a parallel copy on the low of cycle wave II. Cycle wave V may find resistance about the upper edge.
It is possible that cycle wave V may end in October 2019. If it does not end there, or if the AD line makes new all time highs during or after June 2019, then the expectation for cycle wave V to end would be pushed out to March 2020 as the next possibility. Thereafter, the next possibility may be October 2020. March and October are considered as likely months for a bull market to end as in the past they have been popular. That does not mean though that this bull market may not end during any other month.
DAILY CHART
Click chart to enlarge.
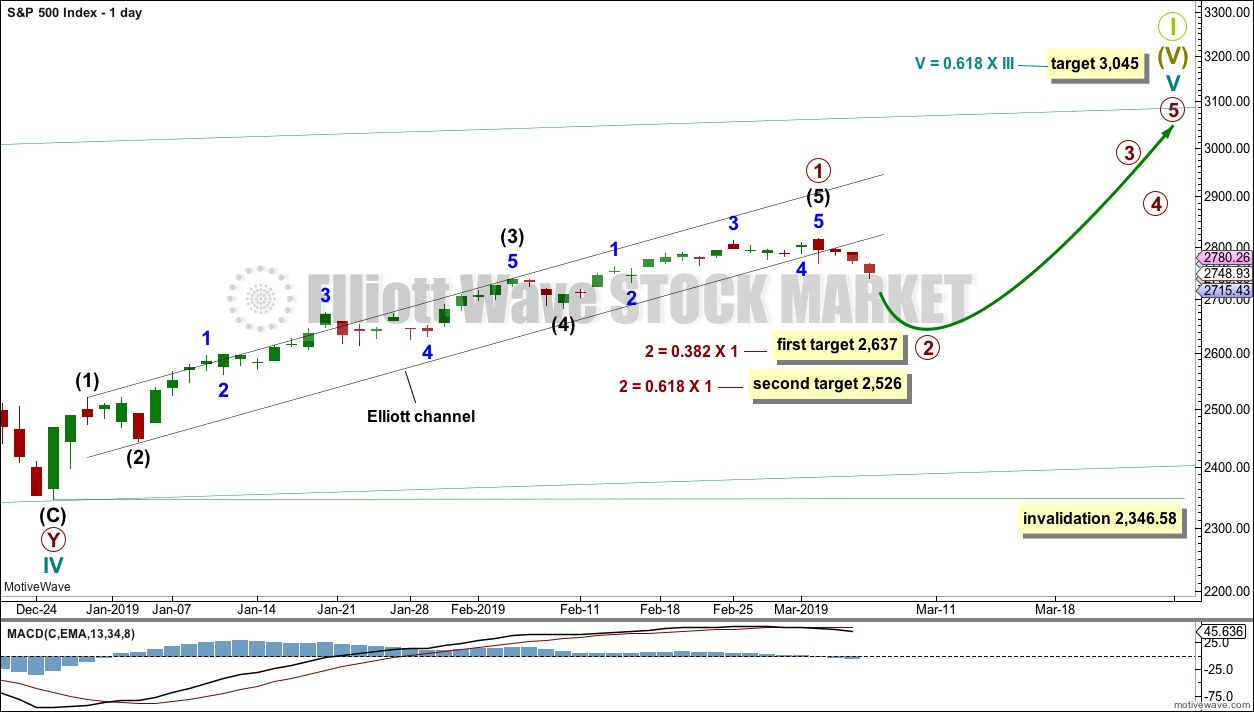
The daily chart will focus on the structure of cycle wave V.
Within Super Cycle wave (V), cycle wave III may not be the shortest actionary wave. Because cycle wave III is shorter than cycle wave I, this limits cycle wave V to no longer than equality in length with cycle wave III at 3,477.39. A target is calculated for cycle wave V to end prior to this point.
Cycle wave V must subdivide as a five wave motive structure, either an impulse or an ending diagonal. An impulse is much more common and that will be how it is labelled. A diagonal would be considered if overlapping suggests it.
Primary wave 1 is labelled as complete. Two targets are given for primary wave 2. The higher 0.382 Fibonacci ratio may be preferred in the first instance. If price keeps dropping through this target or if it gets there and the structure of primary wave 2 is incomplete, then the second lower target may be used.
Primary wave 2 may not move beyond the start of primary wave 1 below 2,346.58.
MAIN HOURLY CHART
Click chart to enlarge.
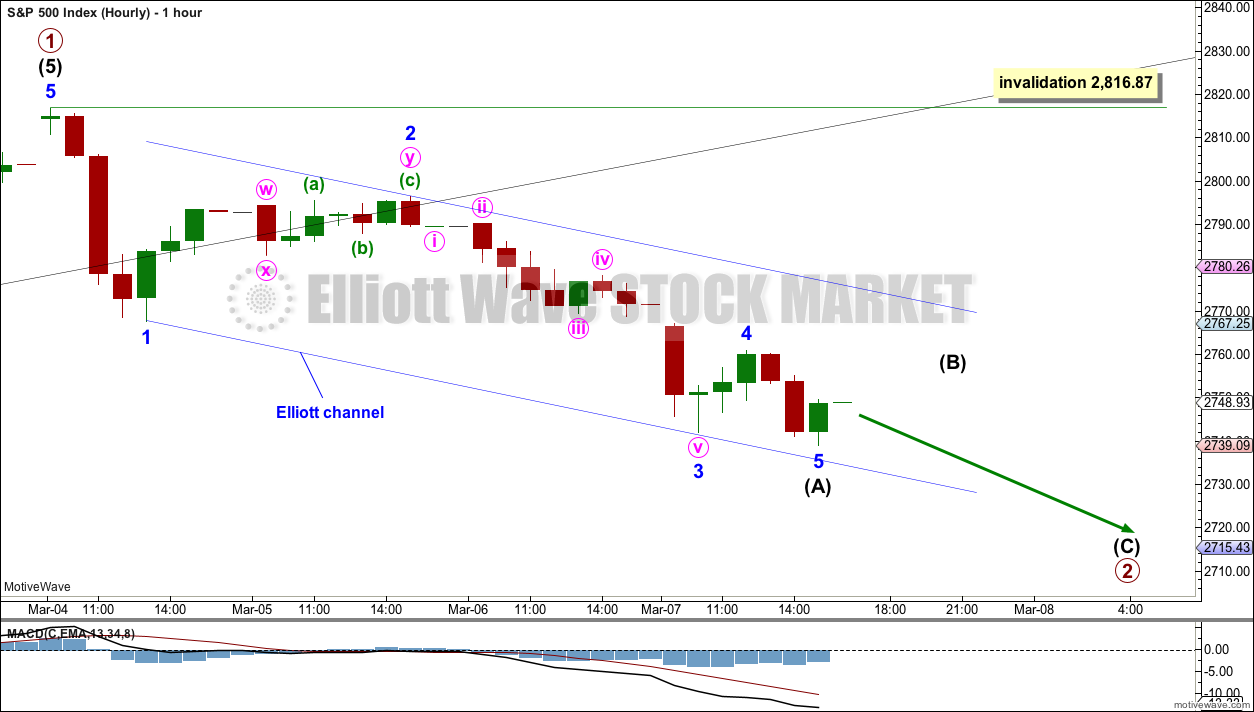
The most likely structure for primary wave 2 would be a zigzag. The next most likely structure would be a double zigzag.
Within a zigzag, intermediate wave (A) must subdivide as a five wave structure. It is possible today to see intermediate wave (A) as complete. It is also possible that the degree of labelling within this five down may be moved down one degree and only minor wave 1 may be over at today’s low.
Within a zigzag, intermediate wave (B) may not move beyond the start of intermediate wave (A) above 2,816.87.
Primary wave 1 lasted 45 sessions. Primary wave 2 may last a Fibonacci 21, 34 or 55 sessions. It may also be in proportion to primary wave 1 at about 45 sessions.
ALTERNATE HOURLY CHART
Click chart to enlarge.
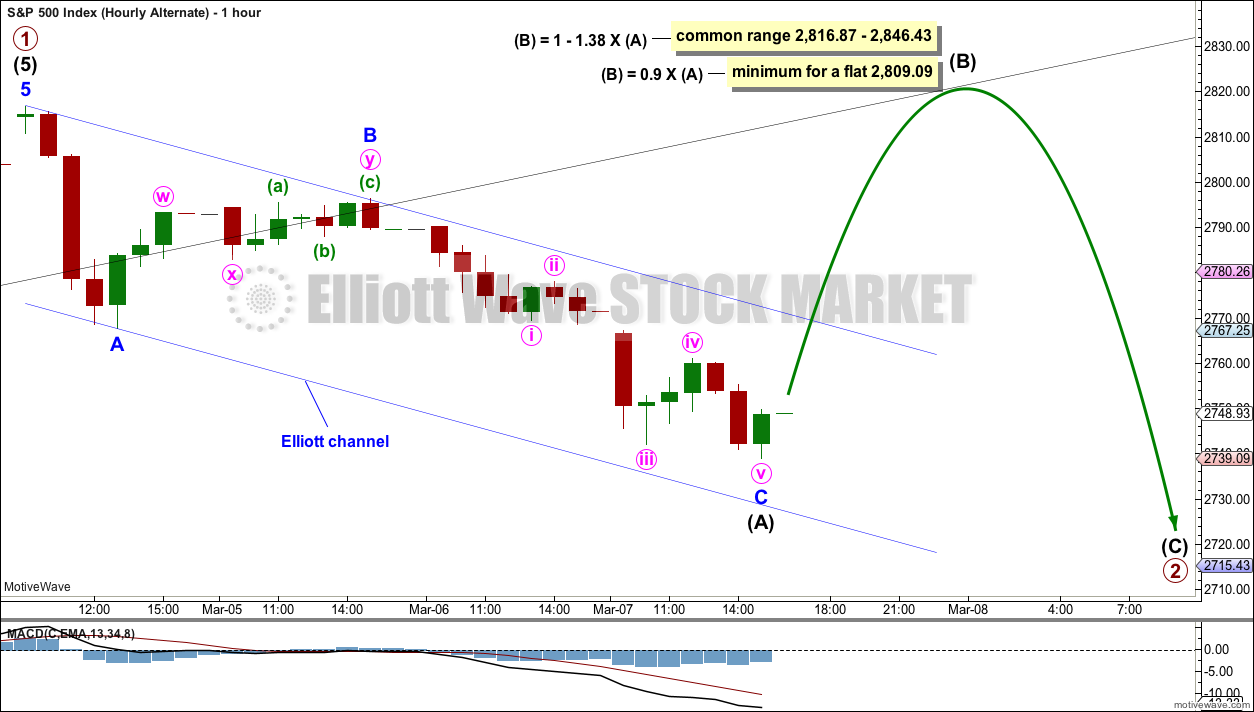
It is also possible to see a zigzag complete at today’s low, which may be a three wave structure downwards for intermediate wave (A). If intermediate wave (A) subdivides as a three, then primary wave 2 may unfold as a flat correction.
Within a flat correction, intermediate wave (B) may make a new high above the start of intermediate wave (A). There is no upper invalidation point for this wave count.
It is also possible that the degree of labelling may be moved down one degree and only minor wave A may be complete as a zigzag. Intermediate wave (A) may subdivide as a flat correction.
This wave count is judged to be fairly unlikely. There is very strong resistance above at 2,815, which would need to be overcome, and flat corrections are not the most common structure for second waves.
TECHNICAL ANALYSIS
WEEKLY CHART

Click chart to enlarge. Chart courtesy of et=”_blank”>StockCharts.com.
Volume and On Balance Volume are very bullish. But the doji candlestick last week again signals a warning. A doji on its own is not a reversal signal, but it is enough to put the trend from up into more neutral territory.
DAILY CHART
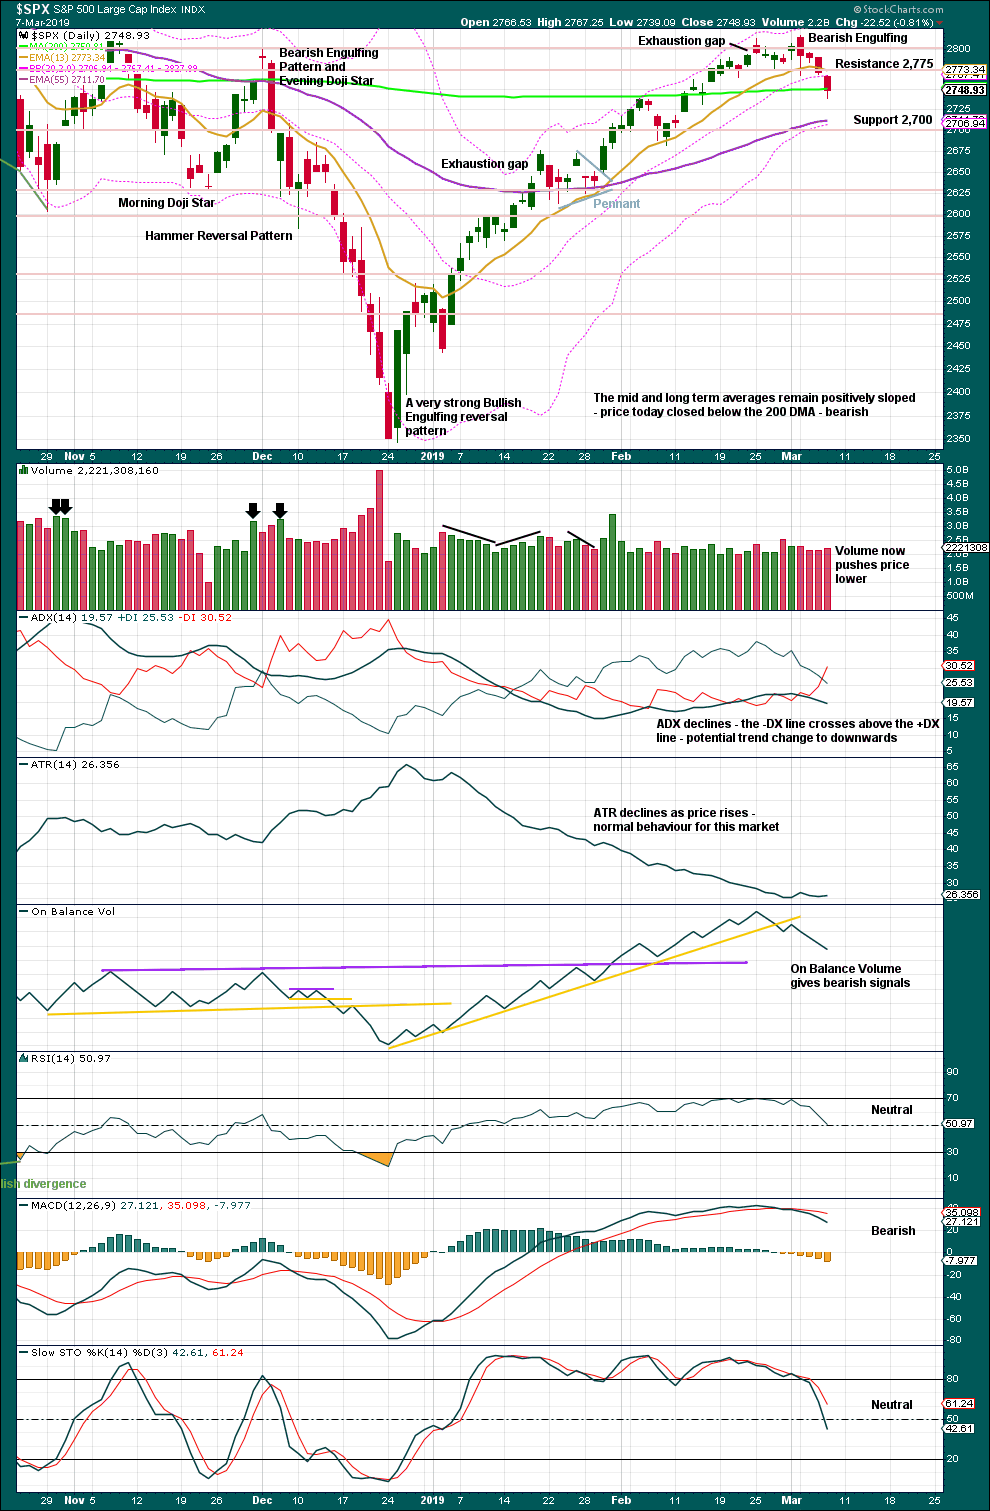
Click chart to enlarge. Chart courtesy of StockCharts.com.
With volume pushing price lower and resistance about 2,815 holding, it looks like more downwards movement for a deeper pullback may now be expected.
The December 2018 low is expected to remain intact. The two 90% upwards days on 26th December 2018 and 6th January 2019 indicate this upwards trend has internal strength.
BREADTH – AD LINE
WEEKLY CHART
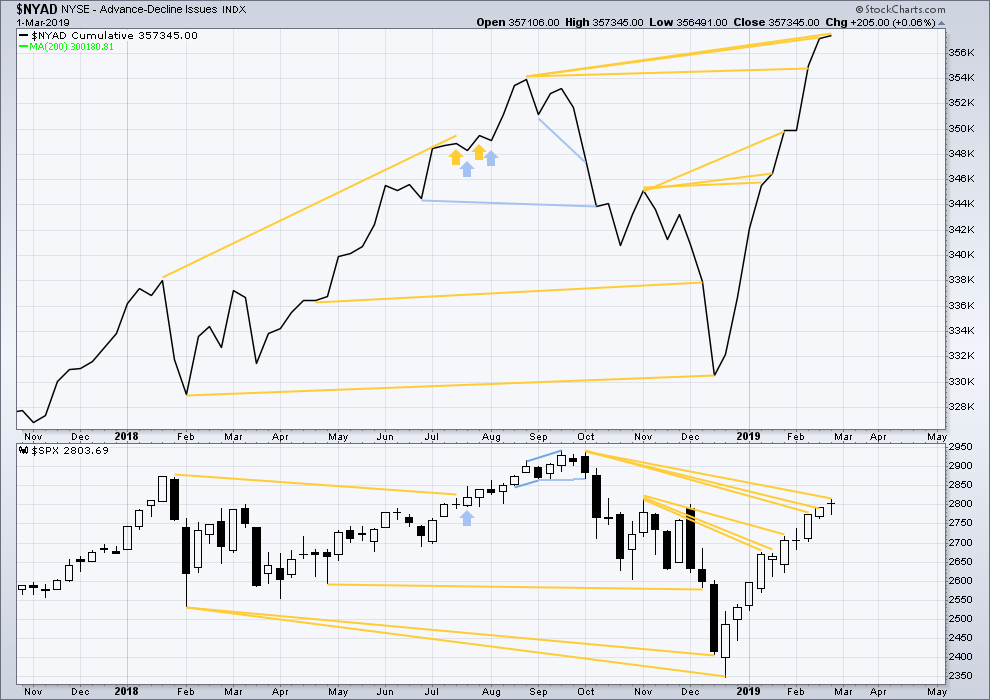
Click chart to enlarge. Chart courtesy of StockCharts.com. So that colour blind members are included, bearish signals
will be noted with blue and bullish signals with yellow.
Every single bear market from the Great Depression and onwards has been preceded by a minimum of 4-6 months divergence between price and the AD line. With the AD line making a new all time high again last week, the end of this bull market and the start of a new bear market must be a minimum of 4 months away, which is mid to end June 2019 at this time.
DAILY CHART
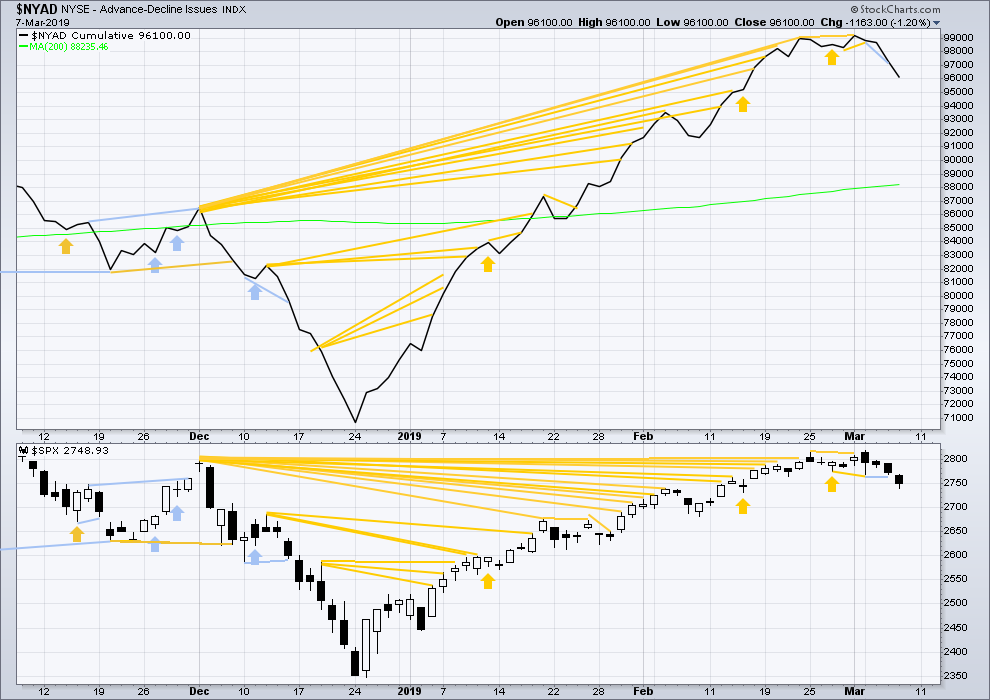
Click chart to enlarge. Chart courtesy of StockCharts.com. So that colour blind members are included, bearish signals
will be noted with blue and bullish signals with yellow.
Breadth should be read as a leading indicator.
Short-term bearish divergence noted in yesterday’s analysis has now been followed by downwards movement. Today both price and the AD line moved lower. There is no new divergence. The fall in price today has support from a decline in market breadth.
VOLATILITY – INVERTED VIX CHART
WEEKLY CHART
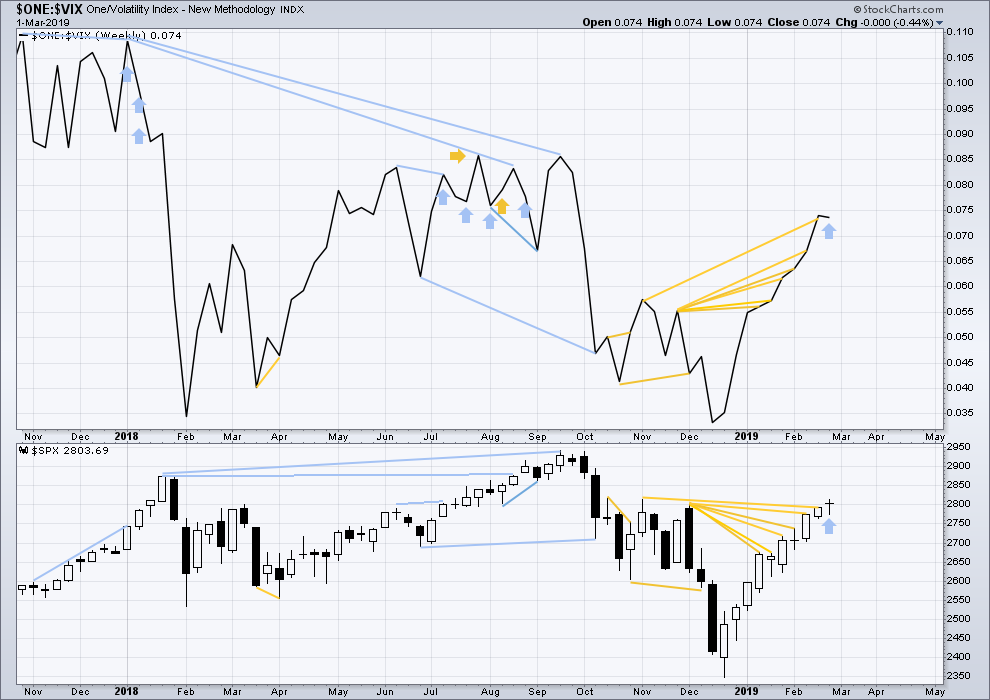
Click chart to enlarge. Chart courtesy of StockCharts.com. So that colour blind members are included, bearish signals
will be noted with blue and bullish signals with yellow.
Upwards movement for last week came with a normal corresponding decline in VIX. There is no new divergence.
DAILY CHART
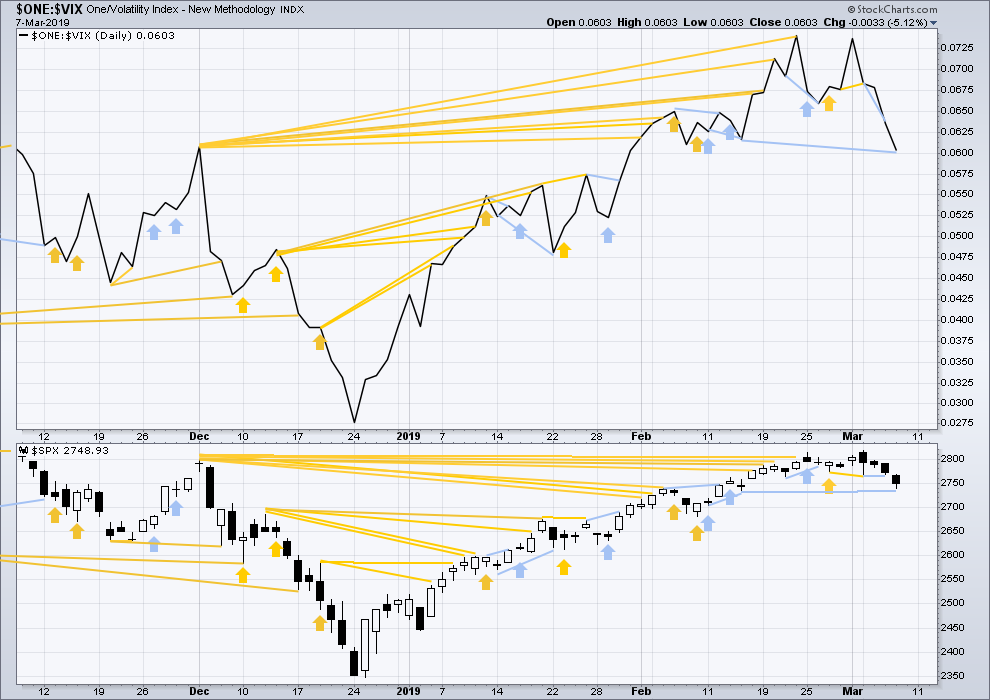
Click chart to enlarge. Chart courtesy of StockCharts.com. So that colour blind members are included, bearish signals
will be noted with blue and bullish signals with yellow.
Bearish divergence noted in yesterday’s analysis has been followed by downwards movement.
Today inverted VIX has made a new low below the prior swing low of the 14th of February, but price has not. Downwards movement today comes with a stronger than normal increase in VIX. This divergence is bearish.
DOW THEORY
Dow Theory confirms a bear market. This does not necessarily mean a bear market at Grand Super Cycle degree though; Dow Theory makes no comment on Elliott wave counts. On the 25th of August 2015 Dow Theory also confirmed a bear market. The Elliott wave count sees that as part of cycle wave II. After Dow Theory confirmation of a bear market in August 2015, price went on to make new all time highs and the bull market continued.
DJIA: 23,344.52 – a close on the 19th of December at 23,284.97 confirms a bear market.
DJT: 9,806.79 – price has closed below this point on the 13th of December.
S&P500: 2,532.69 – a close on the 19th of December at 2,506.96 provides support to a bear market conclusion.
Nasdaq: 6,630.67 – a close on the 19th of December at 6,618.86 provides support to a bear market conclusion.
With all the indices moving now higher, Dow Theory would confirm a bull market if the following highs are made:
DJIA: 26,951.81
DJT: 11,623.58
S&P500: 2,940.91
Nasdaq: 8,133.30.
Published @ 06:42 p.m. EST.
—
Careful risk management protects your trading account(s).
Follow my two Golden Rules:
1. Always trade with stops.
2. Risk only 1-5% of equity on any one trade.
One thing I enjoy about the Heikin-Ashi chart is the way it connects the dots for me. This week’s down move was a nice 100 point slam-bam. If you focus on the red real bodies in this chart, we see that there wasn’t much backfilling and retracing going on. Just a big ‘ole (99.25 actually) point drop.
There are two things that are bugging me about declaring the recent move up as being finished. There is still a higher target that hasn’t been hit and the 76.4% fib level hasn’t failed (the daily closes, including today’s, are all above that level). However, the 76.4 has been breached by a good bit today. Which is not a source of great bullish comfort.
I agree with Kevin. Trade what the chart tells you to trade.
And, of course, I wouldn’t disagree with Lara.
You’re most welcome to disagree with me. I’m wrong sometimes. And sometimes a member brings another piece of information to my attention which helps.
Have a great week-end all!
You too Verne 🙂
Yeah, you too Verne!
I’ve started with a nice morning surf session, so I’m all good 🙂
The most significant attribute of today’s price action, IMO?
An ENTIRE DAILY BAR under the 200 sma.
Does anyone notice anything “interesting” (1 min chart) about the move off the lows? 🙂
King Cobra?
Hehe!
Inverted head and shoulders?
3-3-5
Well, actually not. But sump’n seems off…
Updated hourly chart:
It is possible that intermediate wave (A) could be over at todays low.
It is also possible that the degree of labelling may need to be moved down one degree, this may only be minor wave 1 within intermediate wave (A). I’ll have to make that decision today when I do end of week analysis.
Either way, the rule for wave 2 or B is the same. Neither may make a new high of wave 1 or A is a five.
Here is link to Tom’s energy chart.
Sometimes correlation with market price action is inverted.
Perhaps you- know- who- is watching! ?
https://ibb.co/JvM1hpq
Here is link to Tom’s energy chart.
Sometimes correlation with market price action is inverted.
Perhaps you- know- who- is watching! 🙂
https://ibb.co/JvM1hpq
My seat-o-the-pants wave count has me looking for one more quick new low before a strong bounce. We shall see…
Logged back in to add that it looks like our bounce has probably arrived… and there was Lara’s updated chart, above. Yep!
Howzabout dem apples? THREE, no FOUR! hits on EXACTLY 2722.88 for ES!
Algos at work? 🙂
Yep. Gave back a bit of earlier profit (in ESM).
Take ALL you can, give NOTHING back!! 🙂
— insert smiley face here —
Aaarrrrggghhh!!! 🙂
They defended 2723, but rallies are hard to come by. All small rallies being sold… we’ll see if there will be some buying into the close
Never underestimate those guys. Very deep, AND leveraged pockets!
You meant SPX, not /ES.
/ES low for the day is 2726.5 on my chart.
Nice curveball.
Yikes! The data changed! Wassup wid dat??!!
Those four candles went kaput!
I believe the contracts changed today from March to June. So the prices went up a few bucks.
Aha!
Double bottom in ES…?
If we get a bounce into next week in either a “B” or second wave, might we see a scrumptious TWS VIX pattern developing next week…?
So far, 2720 being defended…a break there will be the first warning of trouble ahead….
On the other hand…if this baby breaks down through 2700 before the close….
“Katie Bar The Door!!!!”
So much for the 2729-32 cluster.
Next stop down is the 2708-10 cluster.
Rolling out long leg of put debit spreads down two strikes, and converting to bull put credit spreads.
VIX hinting a turn could be on deck. What are up up to Kevin? 🙂
Being cautious. Waiting for clarification of next direction. I “think” it will be up. But that’s a big counter trend trade right now, against the hourly and daily trends. Also, the current lows don’t thrill me, in hyperspace relative to fibo levels, that increases my uncertainty. So…I’m playing some guitar and trying to stay off the keyboard, lol!. Holding some longer term bear call spreads in the money at the moment for deeper prices later this month most likely.
If we go green today, a few, or even a BUNCH, of bull put credit spreads are going to look mighty tasty…!
Now I like it a tad more, more of a double bottom look and the 5 minute is breaking up through the 21 period ema…and it’s a nice little hedge on my short spreads. Okay, I took a smallish spy bull put spread. Let’s see if that can make a little hay in some kind of B up here.
Bounce could be quite robust. You know they are going to be trying to “shake the trees” ahead of a sharp third or “C” down!
breaking down out of a triangle…
Verne,
If you don’t mind sharing your idea of the Cobra Coil, I would love to hear it.
Gary
Oh My! How I wish I could go back and aggregate some of my earlier posts! They were a lot more fun when viewed in real time.
In a nutshell, sometimes a sideways wedge does not meet the technical requirements as a triangle but can give a hint, (in conjunction with some other indicators) that a huge move is coming. It does not ALWAYS play out but it often does. I call the pattern the “Cobra Coil”. Break, as is typically the case, will be in the direction from which the the coil entered, in other words, a continuation pattern.
You can generate some juicy ES (and cash session) profits if you can spot ’em! Cheers!
There is an old rule (or classical rule) in classical TA. It is that, when a wedge breaks out of the pattern and goes in the opposite direction, it is a quick strong move to the origin of the wedge.
In our case with SPX breaking out of an upward sloping wedge, the origin of the wedge is about 2680.
Nice Rod!
I wish my charts would behave when I attempt to post them. I need some tutoring!
You’re way ahead if me, Verne. I can’t even manage to post a smiley face!
Easy peasy. If your computer does not offer emojis, colon followed by right parenthesis does it!
My best take here is the v down of the first impulse down is just completing now. Down to 2708 fibos first is possible. I could be all wrong, too.
I’m also thinking about what is the feasible “least” amount a primary 2 down can/should go.
The common rule for corrections is “to the level of the iv of the same degree wave up”. That’s 2738-2681. Price is in that range now (2724 at the moment).
That would, however, be a very shallow 2, as the other common rule for 2’s is that they tend to be deeper, 38% or 62%. 32% is 2639, and 62% is way down at 2528.
I’ll guess we’ll just have to let the market inform us about it.
The next critical fork in the road is 2700. The bulls and banksters HAVE to defend it.
If they don’t, or can’t, it will likely signal the most massive leveraged unwind in market history and usher in Volocaust II. VIX 100???!! Yikes!!!
Quite frankly my friend, I would be quite all right with that. However, that is quite a call and would mean a massive panic on Wall Street shaking the foundations of Main Street as well.
I know a guy who studies astro-physics and has a remarkable indicator he calls an “Energy Chart” The thing is freakishly uncanny and graphs the amount of energy, not just photons but other particles, striking the earth. It appears to correlate quite well with violent market moves. I will ask him if I can post a few of his charts for members to take a gander. It is predicting a ramp higher into 3/15 which will be an interim high.
With all due respect to Michael Douglas….”Panic is Good!”…for us wee traders laddie! 🙂
Nice find on the IWM puts brother ..: )
Going to be closing my “braveheart” naked 121 puts on gld this morning
And cashing on my 122-122.50 call spreads as well
Had to wait for the last day on those..:)
But they will be at least a triple on the call spreads ..
Thanks Verne! Always appreciate your insight… keep it coming…
🙂
If the last sell off (Oct-Dec) didn’t initiate “Volocaust II”, and this a primary 2 down which won’t go as deep, why would this one initiate it? Just wondering what’s different now.
Assuming it IS, P2…..
I pointed out the H/S structure in SPX. Now the neck line is breached. The measuring rule points to a matching low almost exactly on top of a 78.6% at 2711. This is a /ES hourly with overnight data.
How about that King Cobra in futures….? 🙂
Please, do tell
I know you remember my talking about what I refer to as the “Cobra Coil”, or did you forget? 🙂
I don’t know that I ever knew and I certainly don’t remember. As Peter said, “Please, do tell.”
You’re kidding!
You remember more about previous musings than anyone on the forum!!
🙂
Hi Lara,
just want to double check Summary: Targets for a multi-week pullback are 2,637 or 2,656.
versus targets shown on the daily chart
Thx!
I am sorry, the summary was wrong, the chart was right. Fixed now.
Finally. I am first. Yeah for me.
Indeed, now that I’ve arrived…break out the champagne!
ps: nice timing on the short. a very judicious entry point. Kaplaugh!!
Thanks. Still got my shorts on.
….and JUICY, as well…!