
Sideways movement continues but now all of On Balance Volume, the AD line, and inverted VIX give the same signals. The Elliott wave count is updated.
Summary: The channel on the daily chart is now fully breached today indicating a likely start to primary wave 2. Targets are 2,637 or 2,656.
For the short term, a close above 2,816.87 is now required to support a bullish scenario.
New updates to this analysis are in bold.
The biggest picture, Grand Super Cycle analysis, is here.
Last published monthly charts are here. Video is here.
ELLIOTT WAVE COUNT
WEEKLY CHART
Click chart to enlarge.
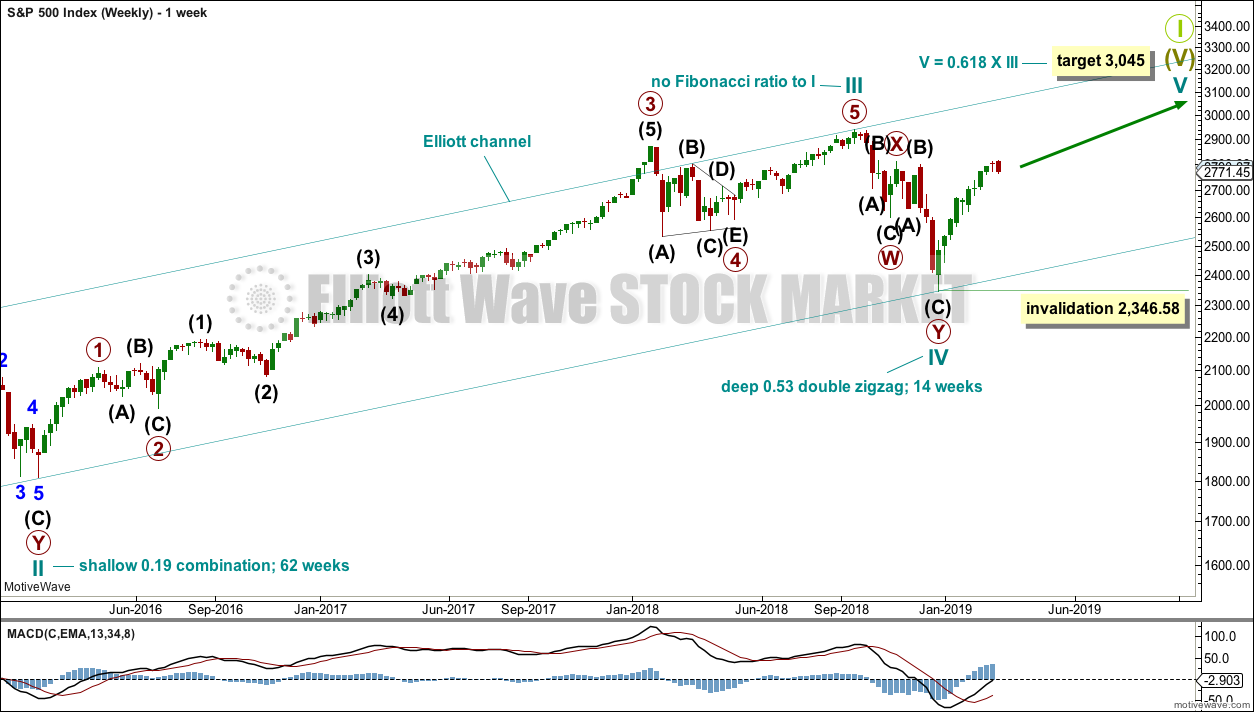
This weekly chart shows all of cycle waves III, IV and V so far.
Cycle wave II fits as a time consuming double combination: flat – X – zigzag. Combinations tend to be more time consuming corrective structures than zigzags. Cycle wave IV has completed as a multiple zigzag that should be expected to be more brief than cycle wave II.
Cycle wave IV may have ended at the lower edge of the Elliott channel.
Within cycle wave V, no second wave correction may move beyond the start of its first wave below 2,346.58.
Although both cycle waves II and IV are labelled W-X-Y, they are different corrective structures. There are two broad groups of Elliott wave corrective structures: the zigzag family, which are sharp corrections, and all the rest, which are sideways corrections. Multiple zigzags belong to the zigzag family and combinations belong to the sideways family. There is perfect alternation between the possible double zigzag of cycle wave IV and the combination of cycle wave II.
Although there is gross disproportion between the duration of cycle waves II and IV, the size of cycle wave IV in terms of price makes these two corrections look like they should be labelled at the same degree. Proportion is a function of either or both of price and time.
Draw the Elliott channel about Super Cycle wave (V) with the first trend line from the end of cycle wave I (at 2,079.46 on the week beginning 30th November 2014) to the high of cycle wave III, then place a parallel copy on the low of cycle wave II. Cycle wave V may find resistance about the upper edge.
It is possible that cycle wave V may end in October 2019. If it does not end there, or if the AD line makes new all time highs during or after June 2019, then the expectation for cycle wave V to end would be pushed out to March 2020 as the next possibility. Thereafter, the next possibility may be October 2020. March and October are considered as likely months for a bull market to end as in the past they have been popular. That does not mean though that this bull market may not end during any other month.
DAILY CHART
Click chart to enlarge.
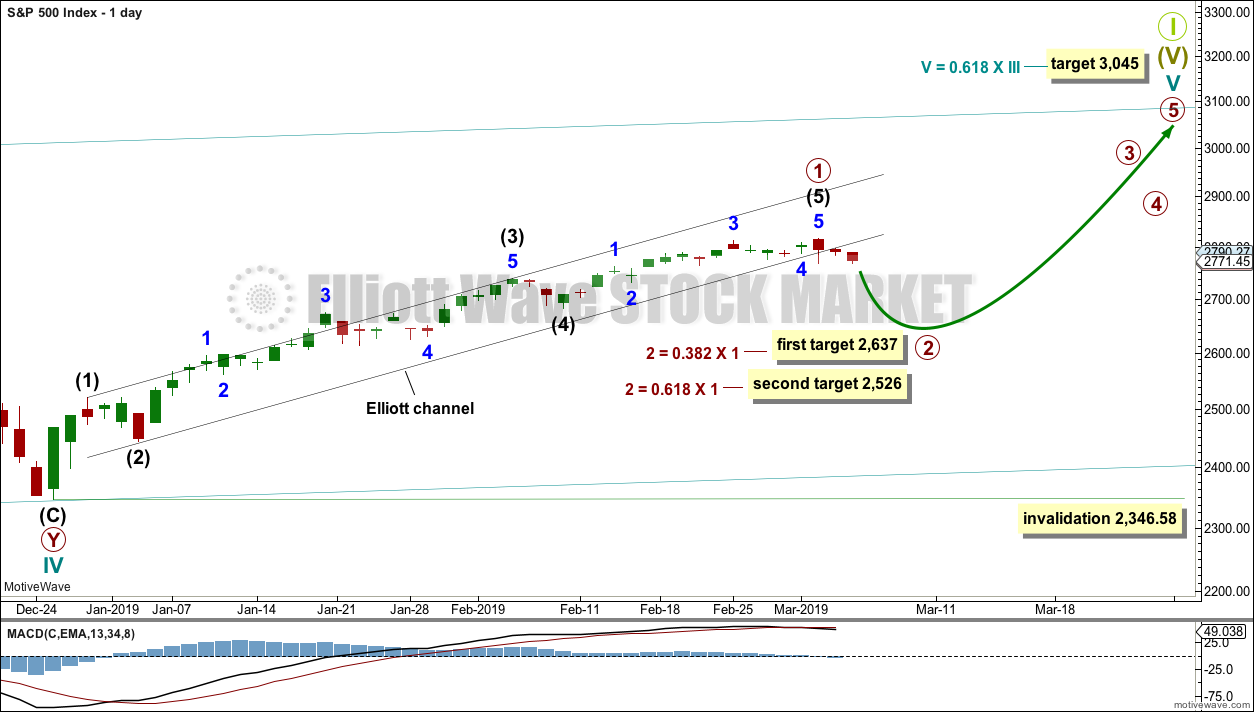
The daily chart will focus on the structure of cycle wave V.
Within Super Cycle wave (V), cycle wave III may not be the shortest actionary wave. Because cycle wave III is shorter than cycle wave I, this limits cycle wave V to no longer than equality in length with cycle wave III at 3,477.39. A target is calculated for cycle wave V to end prior to this point.
Cycle wave V must subdivide as a five wave motive structure, either an impulse or an ending diagonal. An impulse is much more common and that will be how it is labelled. A diagonal would be considered if overlapping suggests it.
Primary wave 1 is today again labelled as possibly complete. Two targets are given for primary wave 2. The higher 0.382 Fibonacci ratio may be preferred in the first instance. If price keeps dropping through this target or if it gets there and the structure of primary wave 2 is incomplete, then the second lower target may be used.
Primary wave 2 may not move beyond the start of primary wave 1 below 2,346.58.
MAIN HOURLY CHART
Click chart to enlarge.
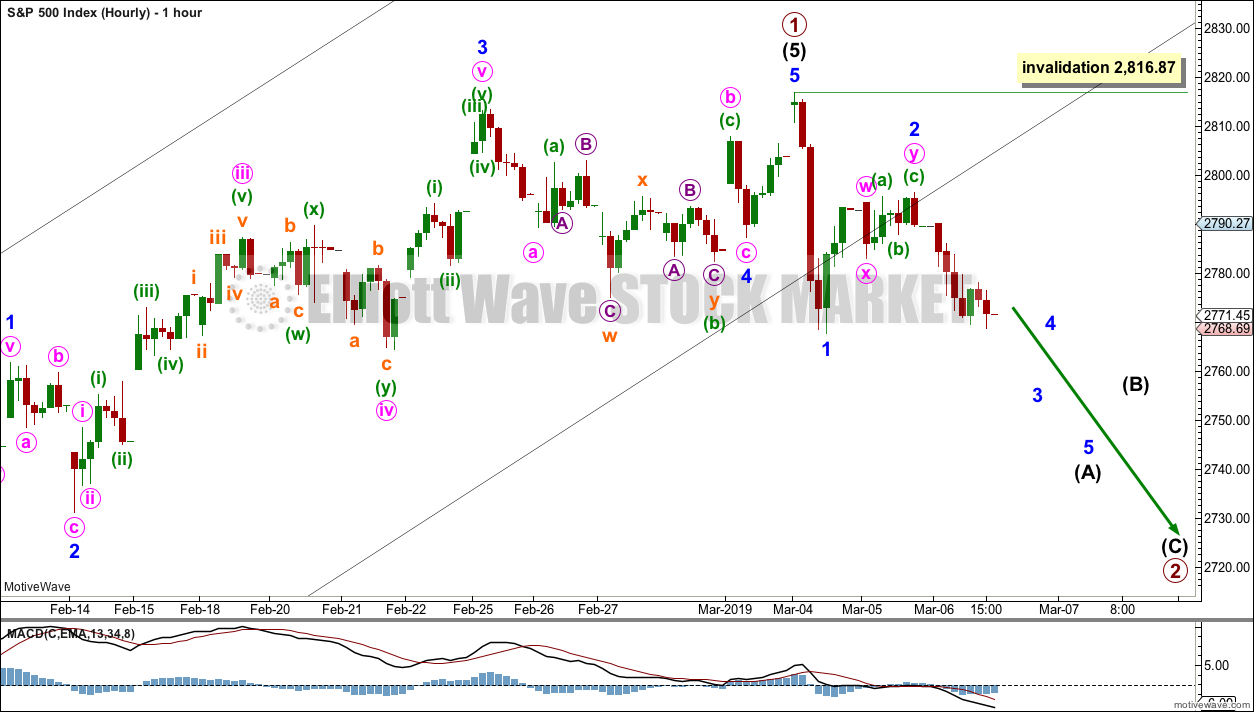
This wave count is new in that it sees a possible end to primary wave 1 at the last high. Thereafter, primary wave 2 may have just begun.
The most likely structure for primary wave 2 would be a zigzag. The next most likely structure would be a double zigzag.
Within a zigzag, intermediate wave (A) must subdivide as a five wave structure; within intermediate wave (A), minor wave 2 may not move beyond the start of minor wave 1 above 2,816.87.
Within a zigzag, intermediate wave (B) may not move beyond the start of intermediate wave (A) above 2,816.87.
Primary wave 1 lasted 45 sessions. Primary wave 2 may last a Fibonacci 21, 34 or 55 sessions. It may also be in proportion to primary wave 1 at about 45 sessions.
ALTERNATE HOURLY CHART
Click chart to enlarge.
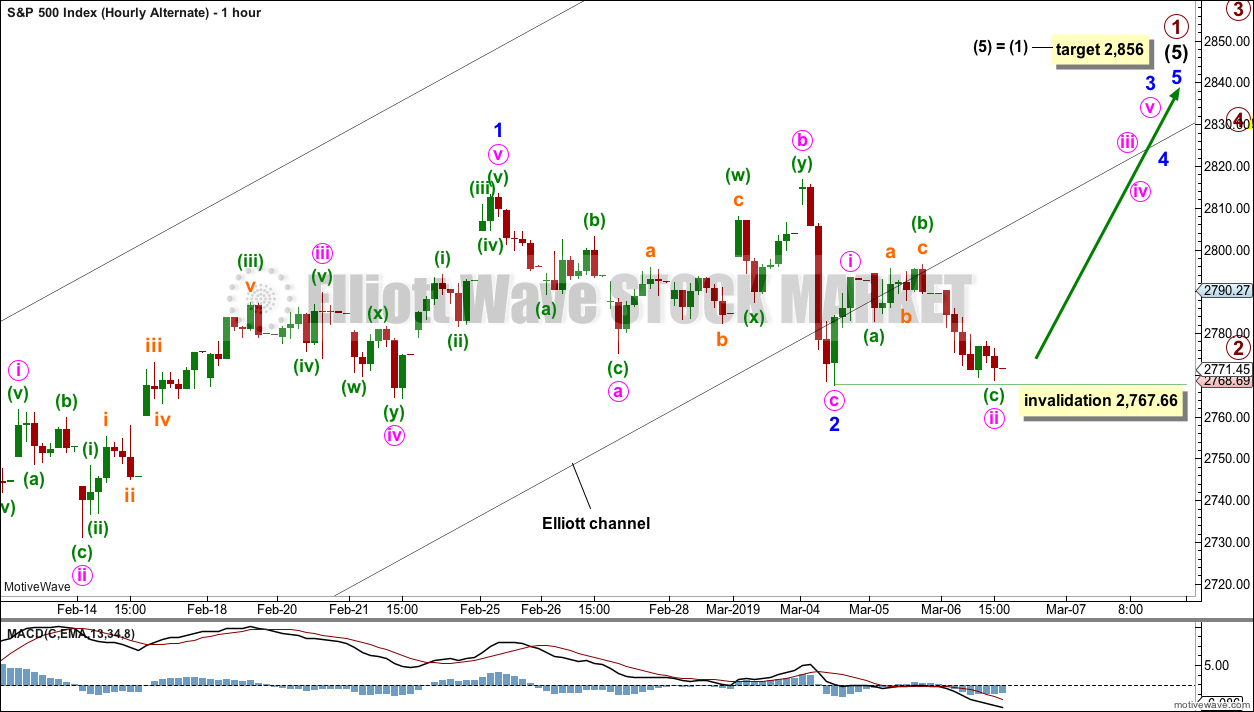
This hourly wave count expects intermediate wave (5) to be extended.
Within intermediate wave (5), minor wave 1 may have been over on the 25th of February.
Minor wave 2 may be a complete expanded flat correction.
Minor wave 3 should now exhibit some increase in upwards momentum. If should have the power to break above resistance at 2,815.
Within minor wave 3, minute wave ii may not move beyond the start of minute wave i below 2,767.66.
Minute wave ii may have ended today, but it strongly breaches the lower edge of the black Elliott channel. This wave count no longer has the right look. However, the S&P does not always fit neatly into trend channels, so this may still be correct.
TECHNICAL ANALYSIS
WEEKLY CHART

Click chart to enlarge. Chart courtesy of et=”_blank”>StockCharts.com.
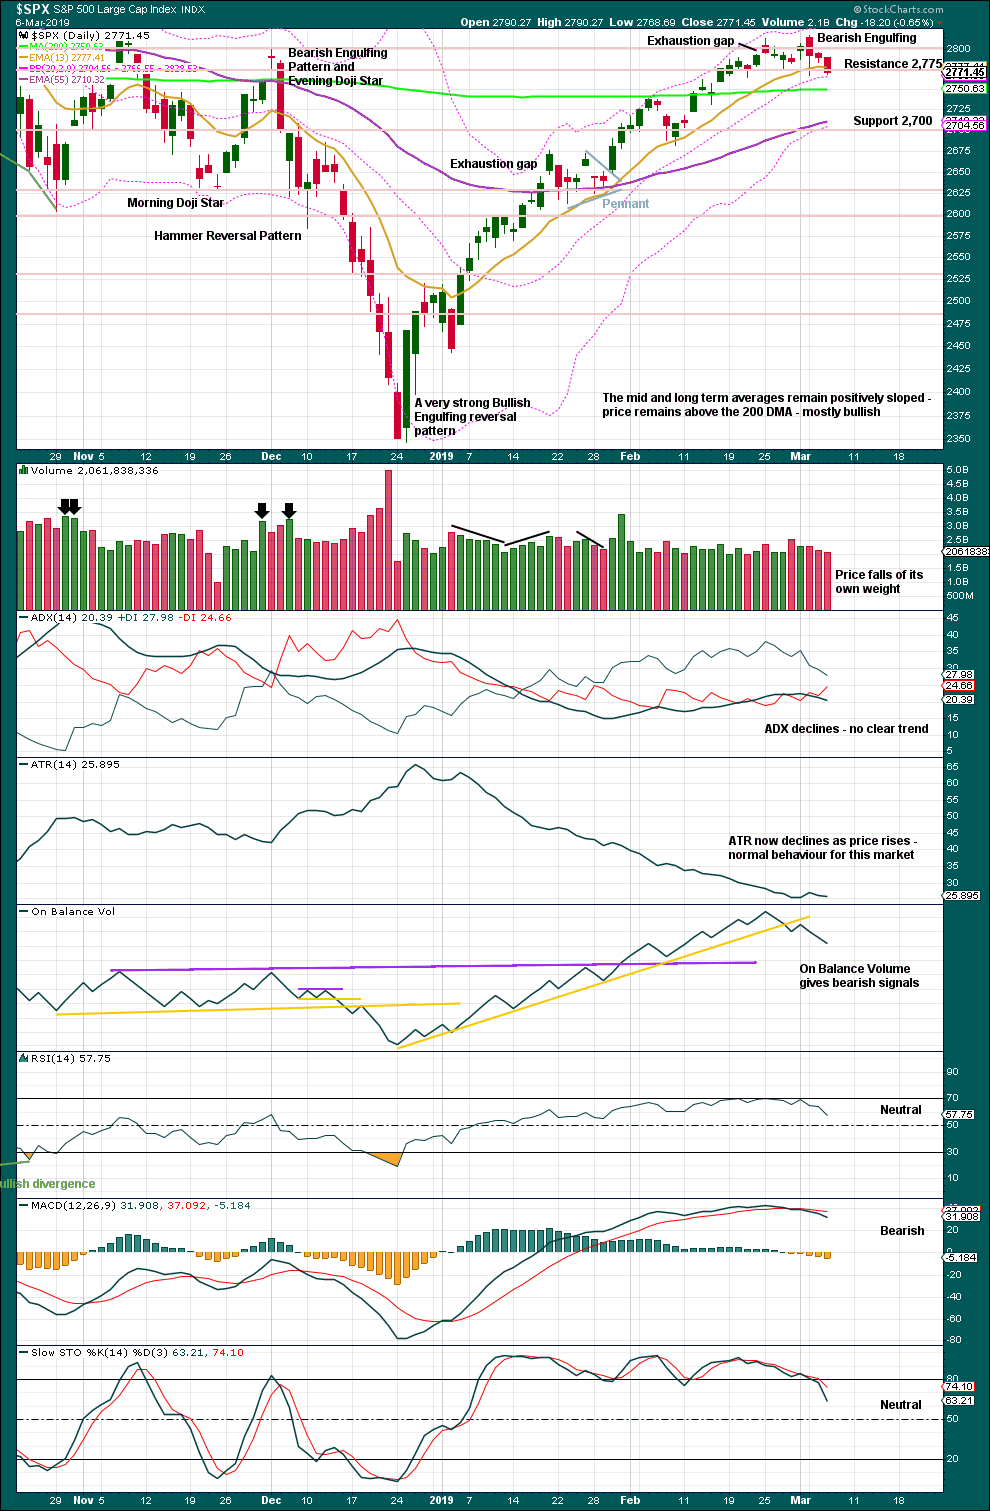
Volume and On Balance Volume are very bullish. But the doji candlestick last week again signals a warning. A doji on its own is not a reversal signal, but it is enough to put the trend from up into more neutral territory.
DAILY CHART
Click chart to enlarge. Chart courtesy of StockCharts.com.
Today the picture may be becoming slightly clearer. So that members may make their own judgements, both bullish and bearish indications are listed below:
Bullish:
– Price remains above the 200 day moving average.
– RSI is again neutral; there is room for price to rise.
– Stochastics is again neutral; there is room for price to rise.
Bearish:
– Closure of the last gap means it is an exhaustion gap, indicating a trend change to down or sideways.
– A Bearish Engulfing candlestick pattern at the last high.
– ADX.
– On Balance Volume.
– MACD.
– Stochastics fast indicator has crossed below the slow indicator.
– A bearish signal today from the AD line (below).
– A bearish signal today from inverted VIX (below).
On balance, it is my judgement today that there is more support for a short-term bearish case than bullish. This does not mean new lows below the December 2018 low may be expected; that is still expected to remain intact. The risk of a short to mid-term pullback here looks heightened.
BREADTH – AD LINE
WEEKLY CHART
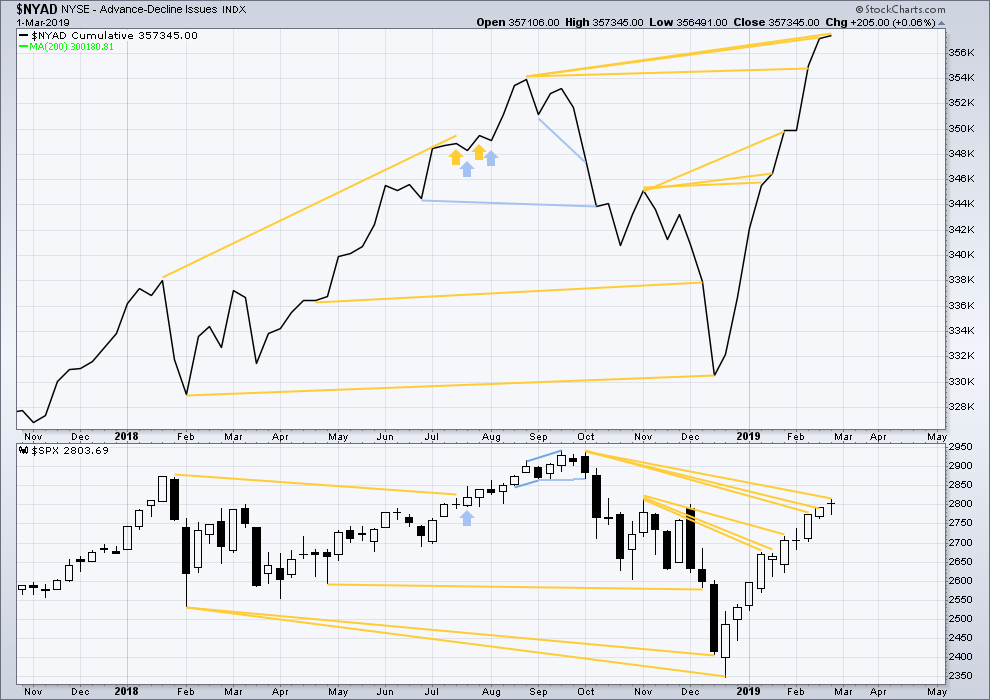
Click chart to enlarge. Chart courtesy of StockCharts.com. So that colour blind members are included, bearish signals
will be noted with blue and bullish signals with yellow.
Every single bear market from the Great Depression and onwards has been preceded by a minimum of 4-6 months divergence between price and the AD line. With the AD line making a new all time high again last week, the end of this bull market and the start of a new bear market must be a minimum of 4 months away, which is mid to end June 2019 at this time.
DAILY CHART
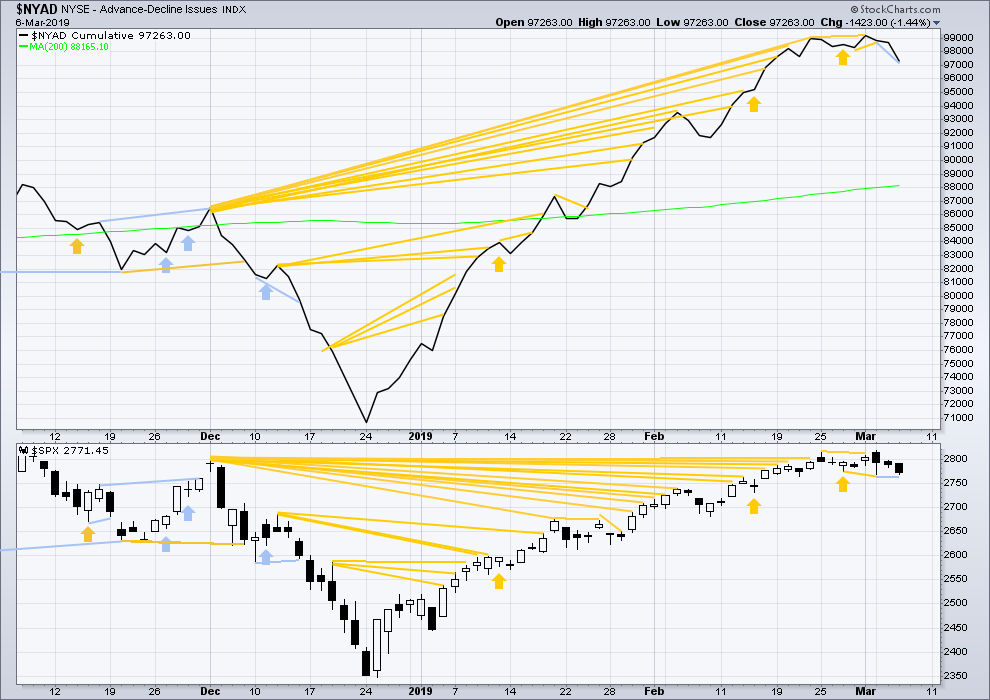
Click chart to enlarge. Chart courtesy of StockCharts.com. So that colour blind members are included, bearish signals
will be noted with blue and bullish signals with yellow.
Breadth should be read as a leading indicator.
Today the AD line has made a new short-term low below the prior low of the 4th of March, but price has failed to do so by a small margin. This divergence is bearish for the short term.
VOLATILITY – INVERTED VIX CHART
WEEKLY CHART
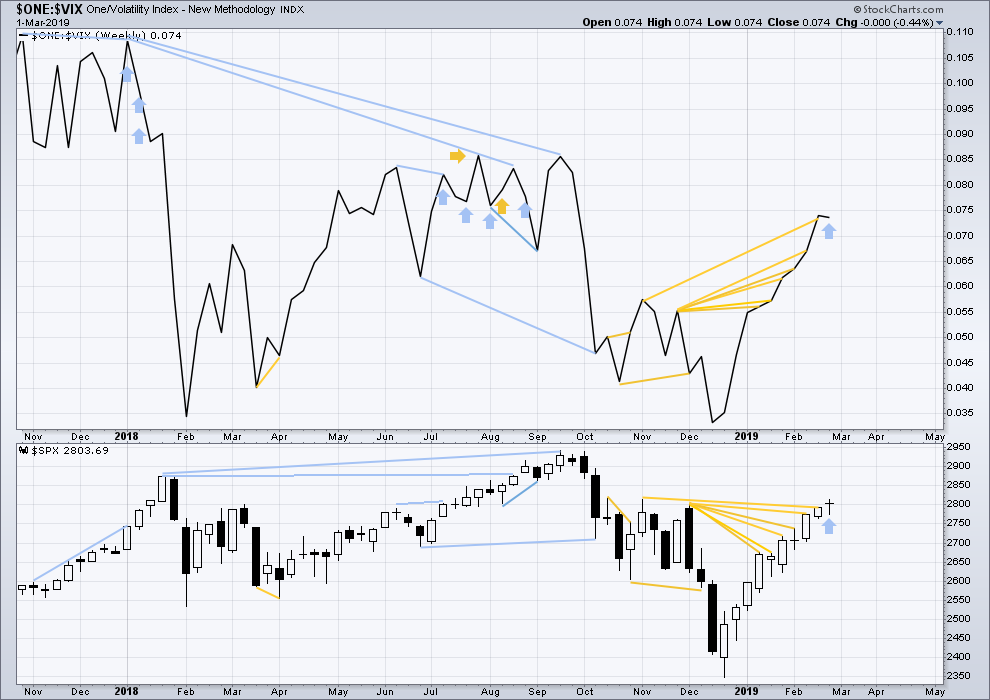
Click chart to enlarge. Chart courtesy of StockCharts.com. So that colour blind members are included, bearish signals
will be noted with blue and bullish signals with yellow.
Upwards movement for last week came with a normal corresponding decline in VIX. There is no new divergence.
DAILY CHART
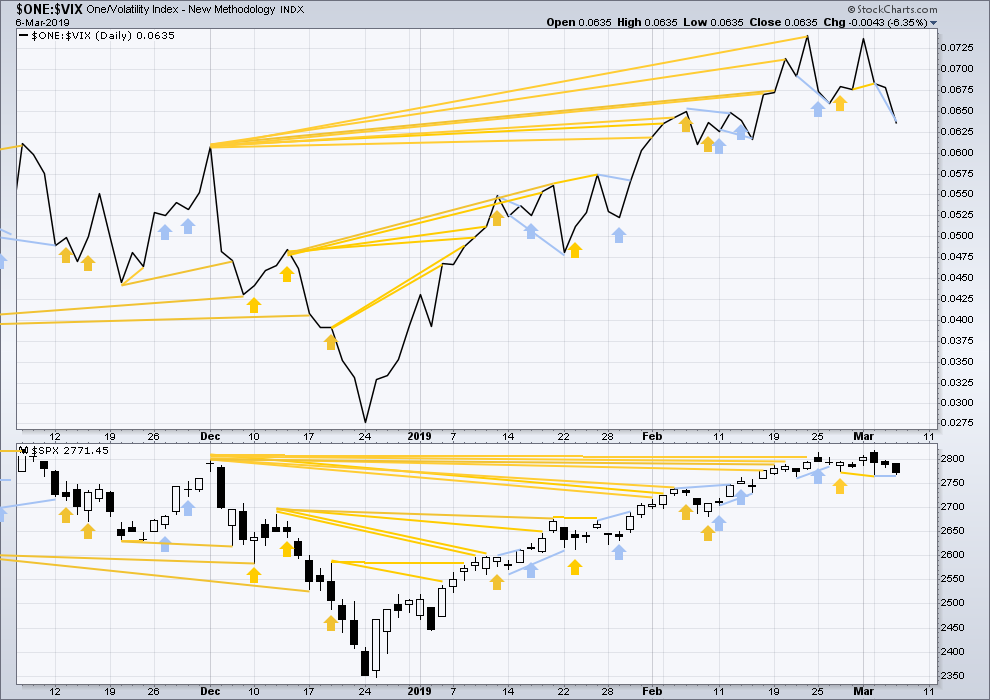
Click chart to enlarge. Chart courtesy of StockCharts.com. So that colour blind members are included, bearish signals
will be noted with blue and bullish signals with yellow.
Today inverted VIX has made a reasonable new low below the prior low of the 4th of March, but price has failed to do so by a small margin. This divergence is bearish for the short term.
Today both mid and small caps saw a strong fall in price, both closed about lows for the session. These two markets look more immediately bearish.
DOW THEORY
Dow Theory confirms a bear market. This does not necessarily mean a bear market at Grand Super Cycle degree though; Dow Theory makes no comment on Elliott wave counts. On the 25th of August 2015 Dow Theory also confirmed a bear market. The Elliott wave count sees that as part of cycle wave II. After Dow Theory confirmation of a bear market in August 2015, price went on to make new all time highs and the bull market continued.
DJIA: 23,344.52 – a close on the 19th of December at 23,284.97 confirms a bear market.
DJT: 9,806.79 – price has closed below this point on the 13th of December.
S&P500: 2,532.69 – a close on the 19th of December at 2,506.96 provides support to a bear market conclusion.
Nasdaq: 6,630.67 – a close on the 19th of December at 6,618.86 provides support to a bear market conclusion.
With all the indices moving now higher, Dow Theory would confirm a bull market if the following highs are made:
DJIA: 26,951.81
DJT: 11,623.58
S&P500: 2,940.91
Nasdaq: 8,133.30.
Published @ 08:57 p.m. EST.
—
Careful risk management protects your trading account(s).
Follow my two Golden Rules:
1. Always trade with stops.
2. Risk only 1-5% of equity on any one trade.
Hourly chart updated:
I can see a five down complete. This may be intermediate wave (A), or the degree of labelling may need to be moved down one and it may only be minor wave 1.
In the early stages of a new wave the most difficult thing can be figuring out what degree to label the first portion.
If this is correctly labelled as a five down, no matter what the degree of labelling, then a following bounce / correction may not move beyond its start.
Closed my short spy position core
And vxxb long position in this last push down
Wrestled that thing for weeks with hedges ect
Now out at a good profit plus the $ from the hedges
Will wait for clarity
Don’t want to face the potential friday clubbing of vol and spy call buying
Will close the last remnants of nflx upside calls tomorrow
The last round of short 280 spy calls for closed
today
Hedged my gm core short with an upside call spread butterfly for next week
Did we have fun Verne ?
: )
Yipee!
Sometimes I have so many positions I loose track of what I bought.
Nestled away in my substantial list were a few IWM 150 March 22 puts I snagged for 0.90 a few weeks back. It was only 20 contracts so I totally overlooked em.
Anyway, got out at tasty 2.00 this morning. Kinda like finding that 20.00 bill in an old shirt! 🙂
Oh, destroying that 200 day sma now. Just in case there was any doubt. Nice!
thank you Kevin for all the numbers today……
thank you Verne for showing me the magic of puts…
looks like the first impulse (motive wave!) down may be complete here. or possibly price completes the 5 wave move down by going to 2732 first. Over 2761 and it’s definitely over. Looks like the 200 day is just going to get scribbled on quite a bit here for awhile. No respect!
I closed my many puts here (RUT and SPX; I’m holding my bear call spreads in the same). Will look to reload somewhere near the top of a B wave back up!
🙂
just realized yesterday was the 10th anniversary of the bull market …
Not to dissuade anyone but I noticed that A and C would have equaled each other at today’s low if you look at the March 4th high as some degree 2 ABC down and would also have retraced 50% of the wave 1. Just an observation
the eternal elliott wave challenge: when is it an ABC vs. when is it a 1-2-3.
SPX > 2768 and the 4 comes back into the 1, so that would terminate that particular bearish model for sure. I’m a bit suspicious that isn’t going to happen here though.
It’s no way near the 50% retrace yet!
SPX daily, trend down, price scribbling on 200 sma and overlapped fibos around 2750.
Hello, primary 2 down.
2732 area is the next stop down.
Finally the break of 2767. Another piece of evidence supporting the bearish case. For full disclosure, I went short this morning premarket.
Now, lets see if SPX can slice right through the 200 day ma.
There goes the 200 day ma. Lets see if SPX can keep going and stay below it. It sure looks like a 3rd wave down to me as per Lara’s main hourly chart. The alternate hourly is soundly invalidated.
coming up on 200 MA
This is /ES daily.
I’ve highlighted the retracement periods through the bull run. The pattern is for the first low made after a few days to hold through any continued consolidation period before the bull run continues. That pattern is being tested if not is already broken here (polarity inversion, lower swing lows ; you just don’t see any such through the entire bull run…until now). As is the lower channel boundary. As are the overlapped fibo retracement levels (2764-67) that held the first move down.
Hence, I see this current price level as key, and any downward movement from here fires off multiple simultaneous bear mode triggers.
And I just noticed: in every other retracement period, and up trend held throughout. Not this time: this is now day 2 of trend having moved already to neutral, indicating more weakness relative to the others. A down down now is likely to roll trend state over the down (a neutral state indicates -DI has crossed above +DI, but ADX is not yet trending up from bar to bar).
zip, zap!
Well deserved 1st place for “Mister Published.”
It’s great to have your input on this forum Kevin 🙂