
Sideways movement continues within the range that price has been in now for six sessions. The breakout is still expected to be in the same direction.
Summary: Price remains range bound. To indicate the next movement there needs to be a breakout. Downwards movement within this range continues to be weak and this favours the view that the breakout may be upwards.
A close above 2,813.49 would indicate the upwards trend remains intact. The target would then be at 2,856.
A breach of the black channel on the daily chart would indicate a deeper pullback has arrived for primary wave 2. The target would be about 2,768.53 or a little below.
New updates to this analysis are in bold.
The biggest picture, Grand Super Cycle analysis, is here.
Last published monthly charts are here. Video is here.
ELLIOTT WAVE COUNT
WEEKLY CHART
Click chart to enlarge.
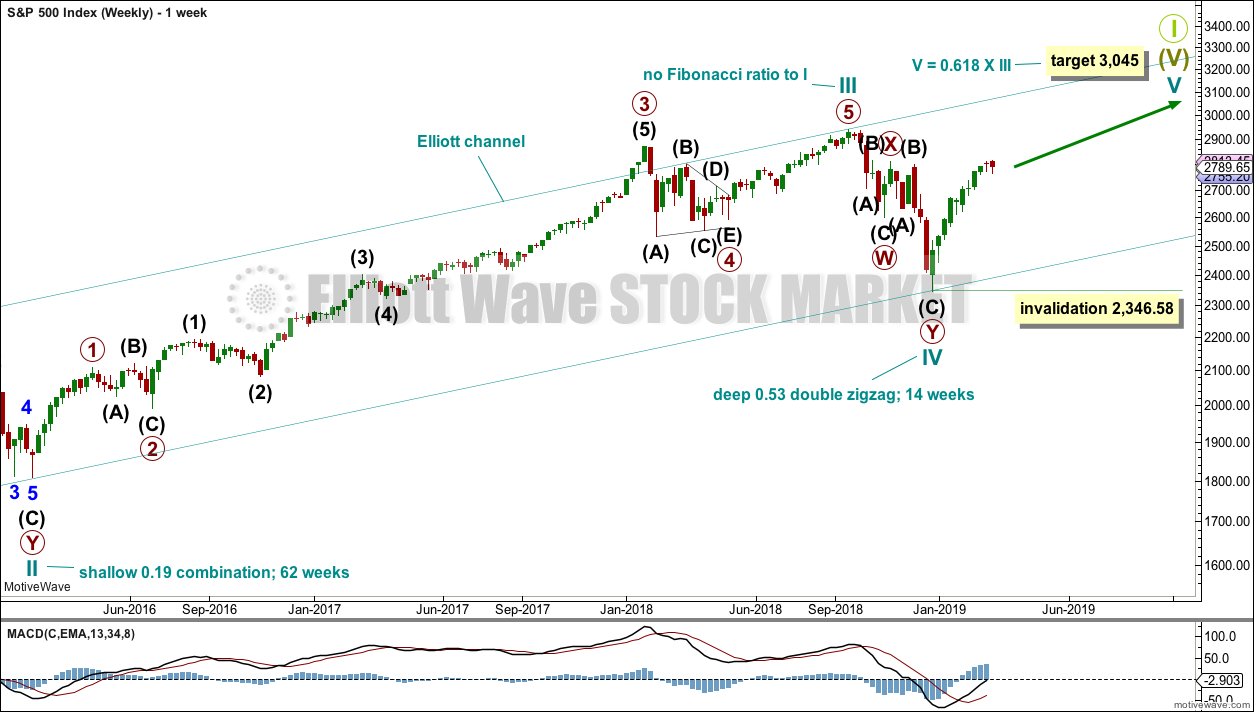
This weekly chart shows all of cycle waves III, IV and V so far.
Cycle wave II fits as a time consuming double combination: flat – X – zigzag. Combinations tend to be more time consuming corrective structures than zigzags. Cycle wave IV has completed as a multiple zigzag that should be expected to be more brief than cycle wave II.
Cycle wave IV may have ended at the lower edge of the Elliott channel.
Within cycle wave V, no second wave correction may move beyond the start of its first wave below 2,346.58.
Although both cycle waves II and IV are labelled W-X-Y, they are different corrective structures. There are two broad groups of Elliott wave corrective structures: the zigzag family, which are sharp corrections, and all the rest, which are sideways corrections. Multiple zigzags belong to the zigzag family and combinations belong to the sideways family. There is perfect alternation between the possible double zigzag of cycle wave IV and the combination of cycle wave II.
Although there is gross disproportion between the duration of cycle waves II and IV, the size of cycle wave IV in terms of price makes these two corrections look like they should be labelled at the same degree. Proportion is a function of either or both of price and time.
Draw the Elliott channel about Super Cycle wave (V) with the first trend line from the end of cycle wave I (at 2,079.46 on the week beginning 30th November 2014) to the high of cycle wave III, then place a parallel copy on the low of cycle wave II. Cycle wave V may find resistance about the upper edge.
It is possible that cycle wave V may end in October 2019. If it does not end there, or if the AD line makes new all time highs during or after June 2019, then the expectation for cycle wave V to end would be pushed out to March 2020 as the next possibility. Thereafter, the next possibility may be October 2020. March and October are considered as likely months for a bull market to end as in the past they have been popular. That does not mean though that this bull market may not end during any other month.
DAILY CHART
Click chart to enlarge.
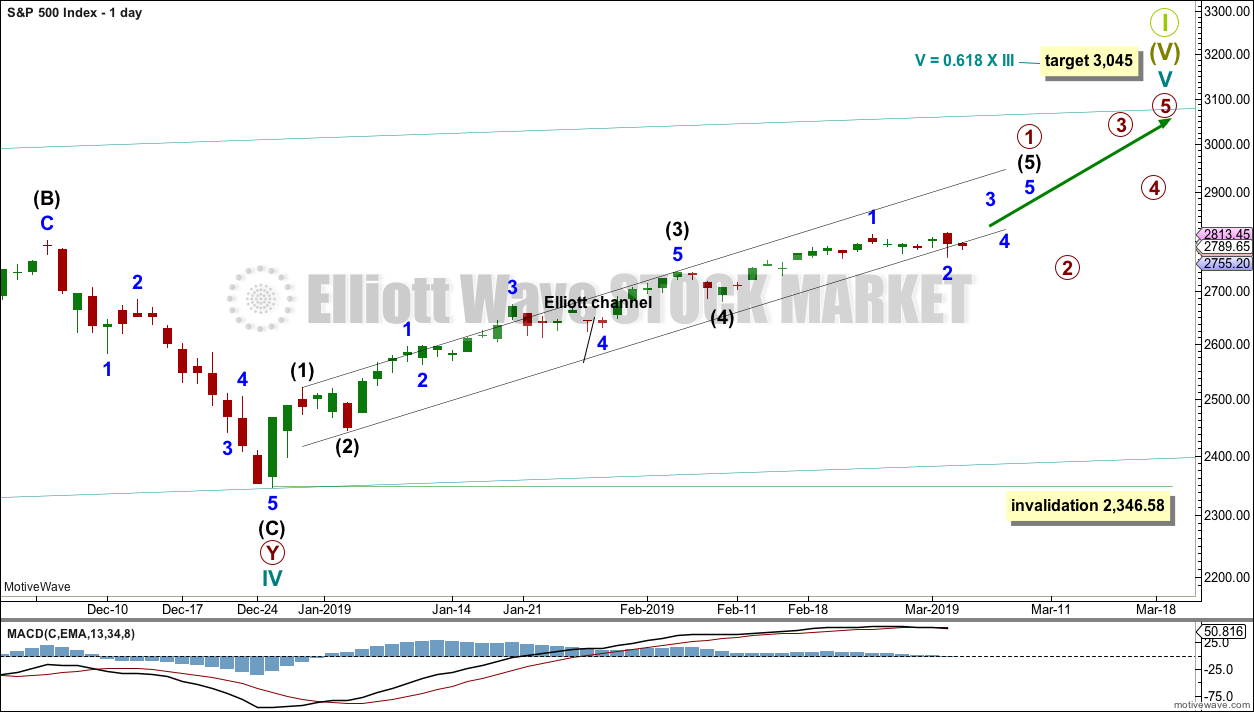
The daily chart will focus on the structure of cycle wave V.
Within Super Cycle wave (V), cycle wave III may not be the shortest actionary wave. Because cycle wave III is shorter than cycle wave I, this limits cycle wave V to no longer than equality in length with cycle wave III at 3,477.39. A target is calculated for cycle wave V to end prior to this point.
Cycle wave V must subdivide as a five wave motive structure, either an impulse or an ending diagonal. An impulse is much more common and that will be how it is labelled. A diagonal would be considered if overlapping suggests it.
Primary wave 1 is labelled as incomplete. Recent downwards days lack strength, and price remains mostly within the black Elliott channel.
An Elliott channel is drawn about the impulse of primary wave 1. When a full daily candlestick prints below the lower edge of the channel and not touching the lower edge, that may be taken as indication of a trend change.
Primary wave 2 may not move beyond the start of primary wave 1 below 2,346.58.
MAIN HOURLY CHART
Click chart to enlarge.
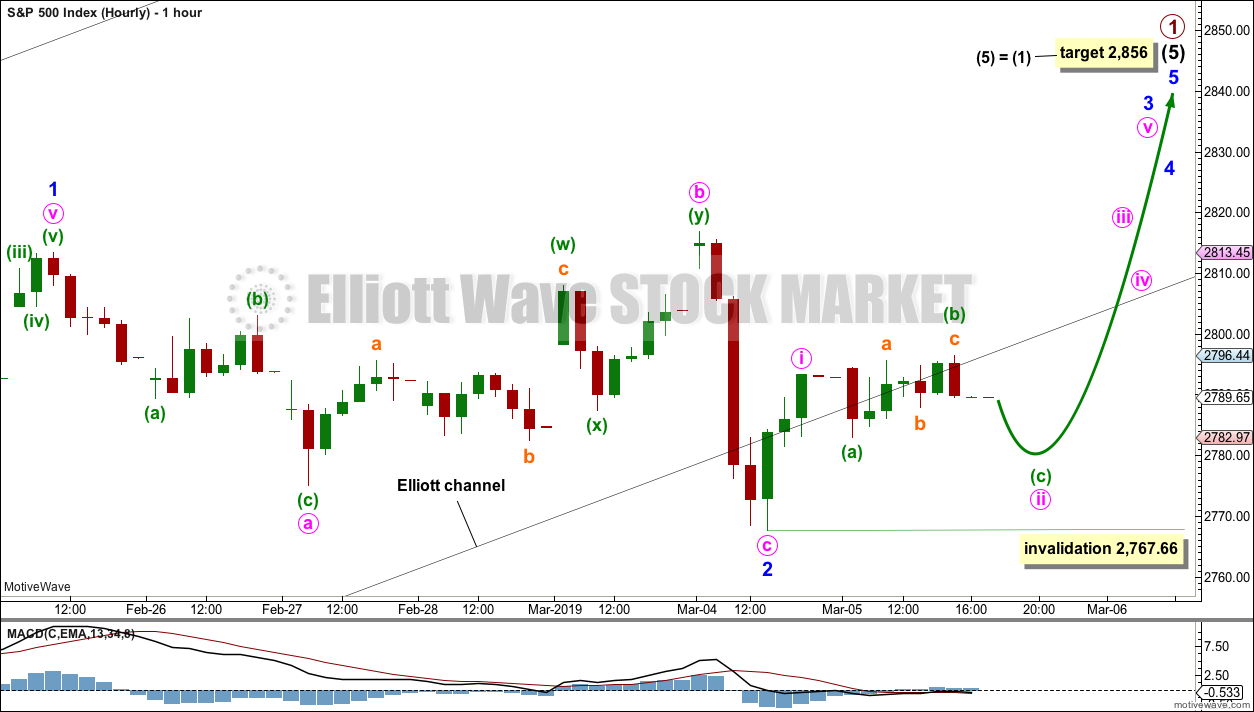
This hourly wave count expects intermediate wave (5) to be extended.
Within intermediate wave (5), minor wave 1 may have been over at the last high. The subdivisions for both hourly charts are seen in the same way, with the sole exception the degree of labelling. This hourly chart moves the degree of labelling down one degree.
Minor wave 2 may be a complete expanded flat correction, ending with an overshoot of the black Elliott channel but not a proper breach.
Minor wave 3 should now exhibit some increase in upwards momentum. If should have the power to break above resistance at 2,815.
Within minor wave 3, minute wave ii may not move beyond the start of minute wave i below 2,767.66.
ALTERNATE HOURLY CHART
Click chart to enlarge.
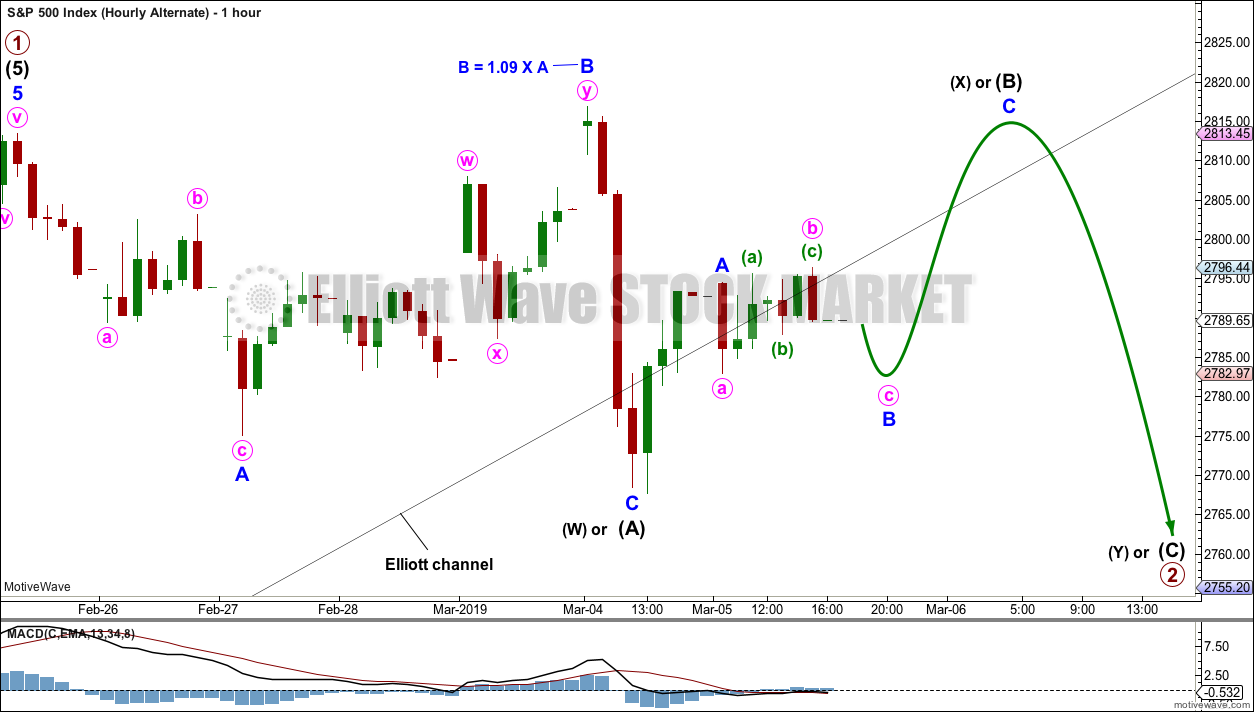
It is possible that primary wave 1 may be over and primary wave 2 may have just begun.
Primary wave 2 may be subdividing as a flat or combination.
If primary wave 2 is subdividing as a flat correction, then within it intermediate wave (A) may be a complete three wave structure, itself subdividing as an expanded flat. Intermediate wave (B) may now make a new price extreme above the start of intermediate wave (A) at 2,813.49. Intermediate wave (B) of a flat correction would need to retrace a minimum 0.9 length of intermediate wave (A) at 2,812.04.
Intermediate wave (B) may be subdividing as a zigzag.
If primary wave 2 is subdividing as a double combination, then the first structure in a double may be complete as an expanded flat labelled intermediate wave (W). The double may then be joined by a three in the opposite direction labelled intermediate wave (X). There is no minimum requirement nor maximum limit for intermediate wave (X). Intermediate wave (X) may be subdividing as a zigzag.
The second structure in a double combination would most likely be a zigzag and would be labelled intermediate wave (Y). It should end about the same level as intermediate wave (W) at 2,768.53.
For both of a flat correction or double combination primary wave 2 would be expected to be very shallow.
A clear breach of the black Elliott channel is still required for any confidence in this wave count. The last two flat candlesticks of this session do not provide a convincing breach.
TECHNICAL ANALYSIS
WEEKLY CHART

Click chart to enlarge. Chart courtesy of et=”_blank”>StockCharts.com.
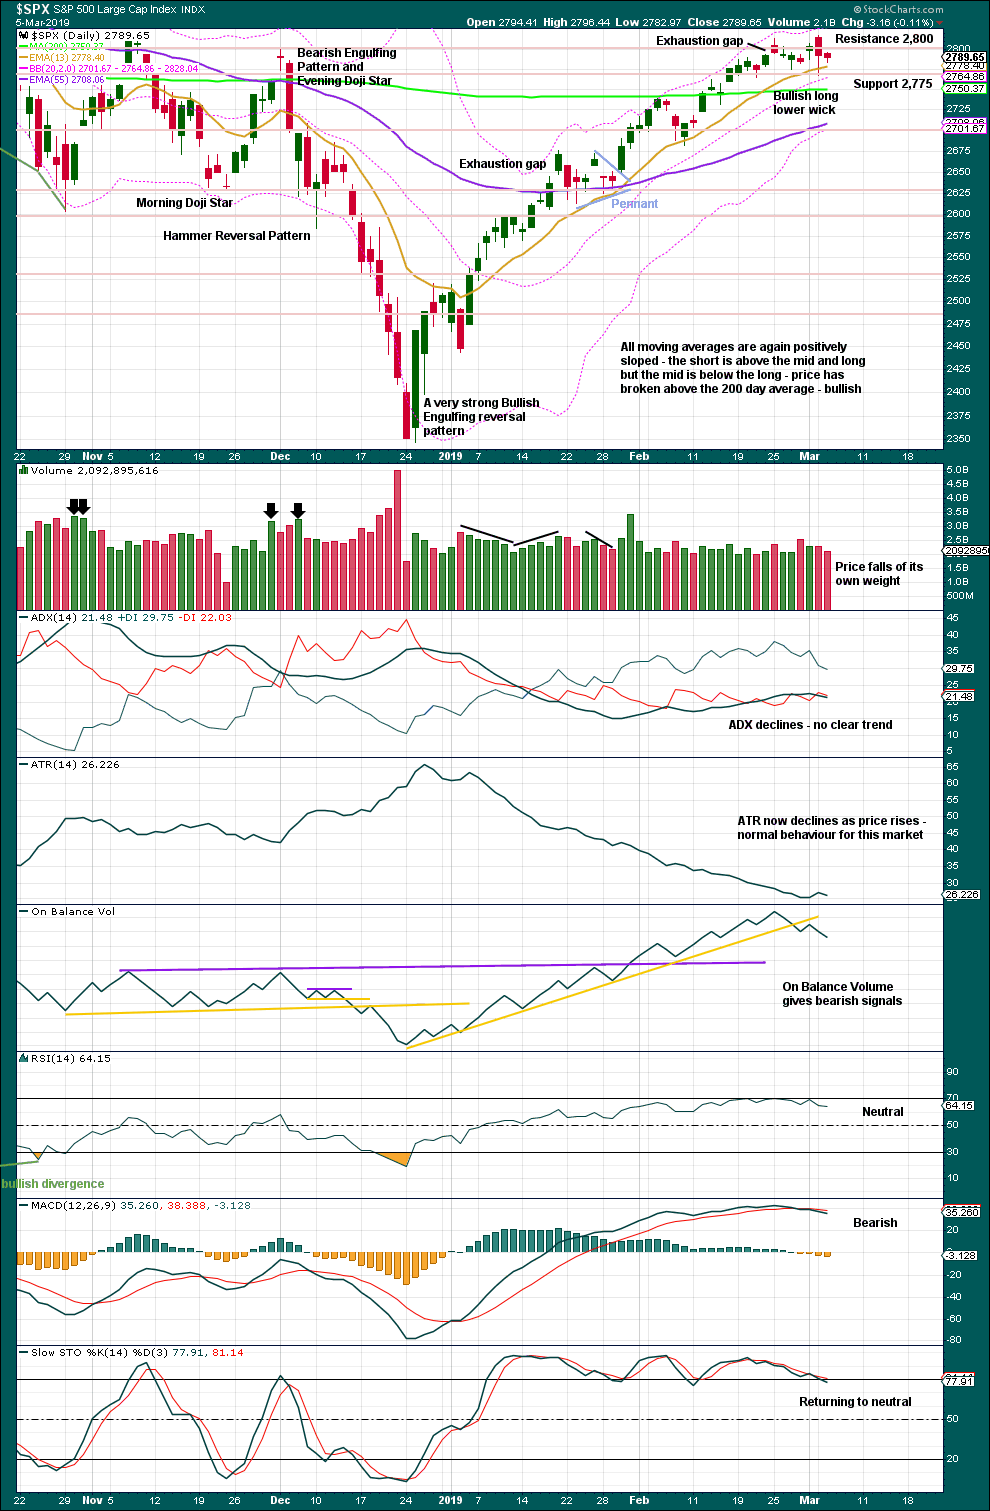
Volume and On Balance Volume are very bullish. But the doji candlestick last week again signals a warning. A doji on its own is not a reversal signal, but it is enough to put the trend from up into more neutral territory.
DAILY CHART
Click chart to enlarge. Chart courtesy of StockCharts.com.
Over a fairly long period of time this ageing bull market has been characterised by upwards movement on light and declining volume and low ATR. For the short to mid term, little concern may be had if price now rises again on declining volume. Current market conditions have allowed for this during a sustained rise in price.
It is also normal for this market to have lower ATR during bullish phases, and strongly increasing ATR during bearish phases. Currently, declining ATR is normal and not of a concern.
Considering the larger picture from the Elliott wave count, some weakness approaching the end of Grand Super Cycle wave I is to be expected.
From Kirkpatrick and Dhalquist, “Technical Analysis” page 152:
“A 90% downside day occurs when on a particular day, the percentage of downside volume exceeds the total of upside and downside volume by 90% and the percentage of downside points exceeds the total of gained points and lost points by 90%. A 90% upside day occurs when both the upside volume and points gained are 90% of their respective totals”…
and “A major reversal is singled when an NPDD is followed by a 90% upside day or two 80% upside days back-to-back”.
The current situation saw two 80% downside days on December 20th and 21st, then a near 90% downside day with 88.97% downside on December 24th. This very heavy selling pressure on three sessions together may be sufficient to exhibit the pressure observed in a 90% downside day.
This has now been followed by two 90% upside days: on December 26th and again on 4th January.
The current situation looks very much like a major low has been found.
For the short term, On Balance Volume remains bearish, but downwards movement within the last two sessions is weak. This still looks more likely to be a shallow consolidation within the ongoing upwards trend.
BREADTH – AD LINE
WEEKLY CHART
Click chart to enlarge. Chart courtesy of StockCharts.com. So that colour blind members are included, bearish signals
will be noted with blue and bullish signals with yellow.
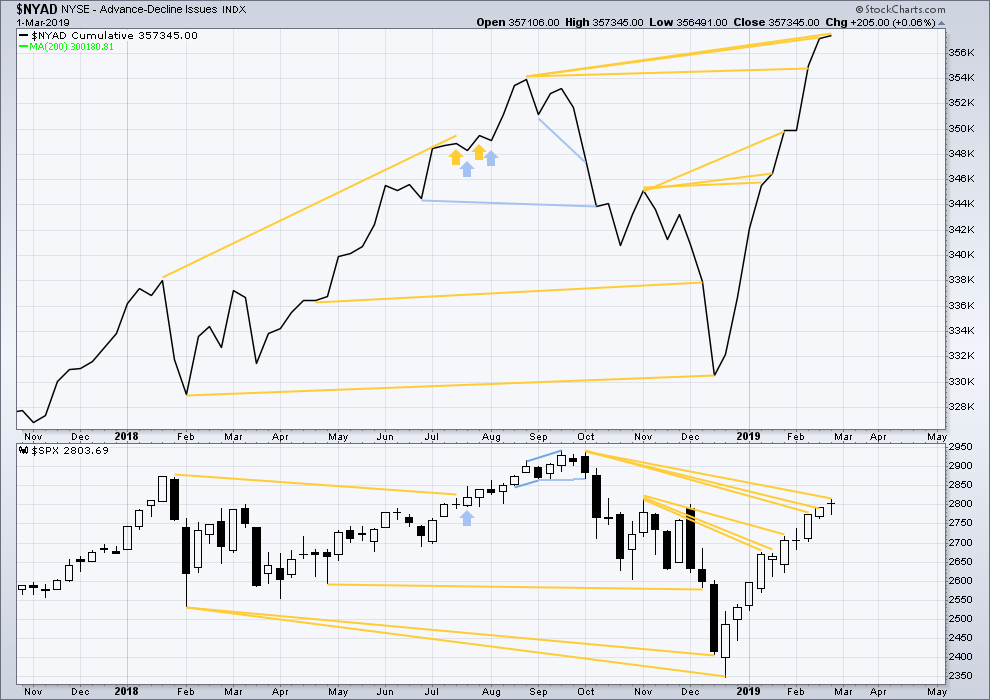
Every single bear market from the Great Depression and onwards has been preceded by a minimum of 4-6 months divergence between price and the AD line. With the AD line making a new all time high again last week, the end of this bull market and the start of a new bear market must be a minimum of 4 months away, which is mid to end June 2019 at this time.
DAILY CHART
Click chart to enlarge. Chart courtesy of StockCharts.com. So that colour blind members are included, bearish signals
will be noted with blue and bullish signals with yellow.
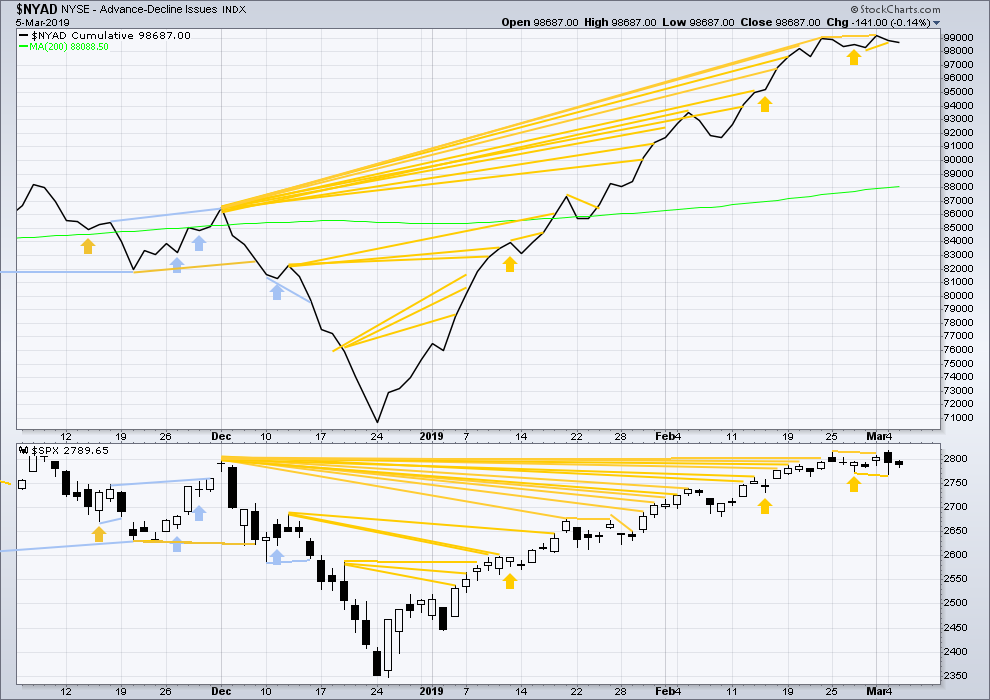
Breadth should be read as a leading indicator.
There is now a cluster of bullish signals from the AD line. This supports the Elliott wave count.
Today price has moved sideways with the balance of volume downwards. The AD line has shown only a slight decline. There is no new divergence.
VOLATILITY – INVERTED VIX CHART
WEEKLY CHART
Click chart to enlarge. Chart courtesy of StockCharts.com. So that colour blind members are included, bearish signals
will be noted with blue and bullish signals with yellow.
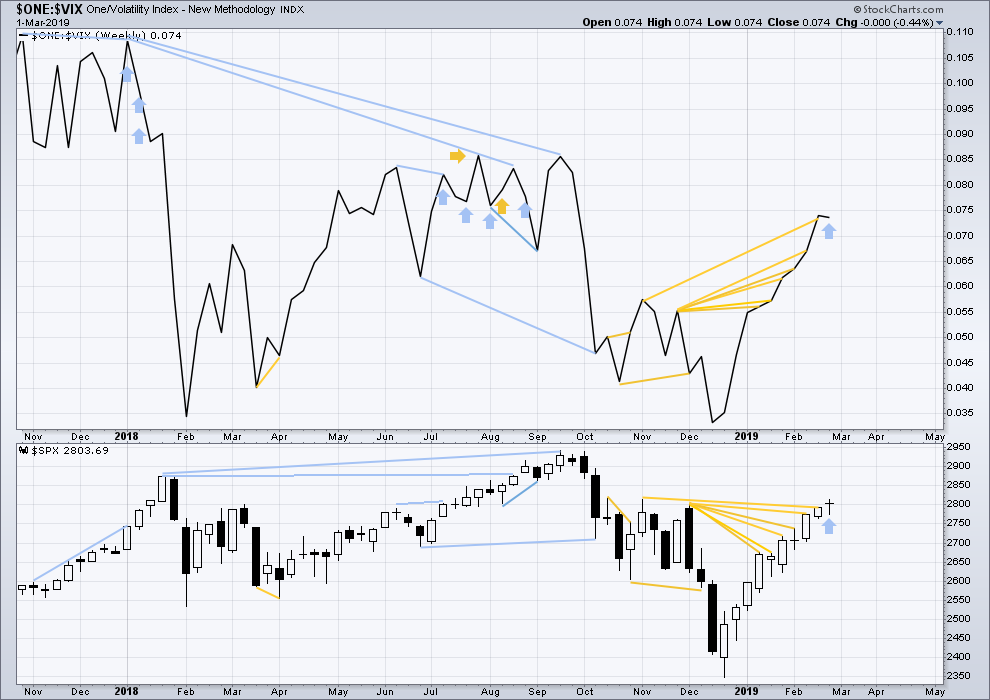
Upwards movement for last week came with a normal corresponding decline in VIX. There is no new divergence.
DAILY CHART
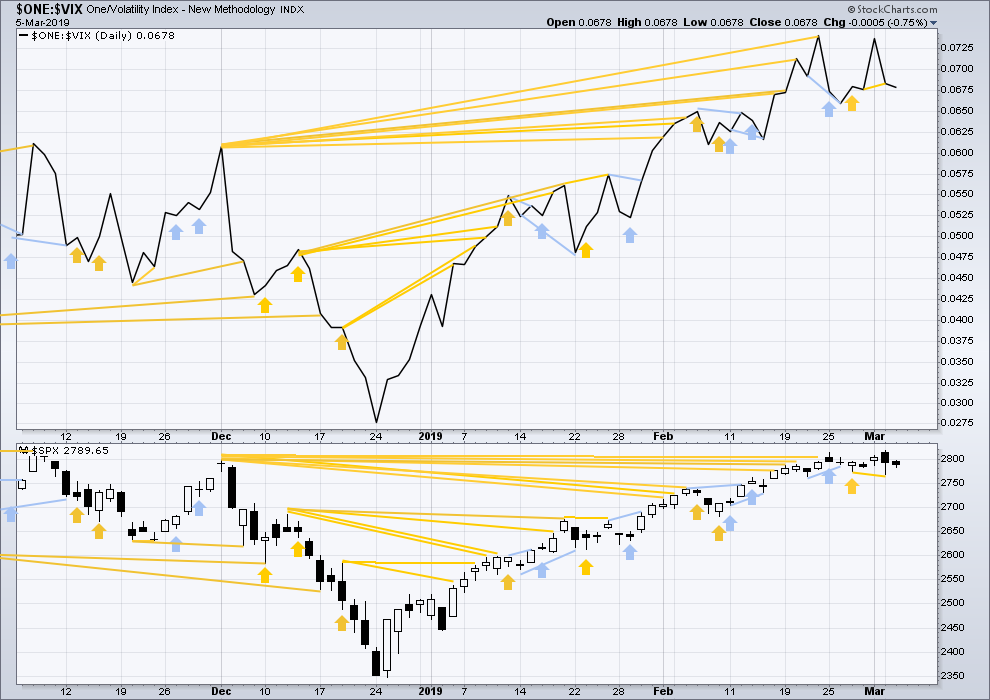
Click chart to enlarge. Chart courtesy of StockCharts.com. So that colour blind members are included, bearish signals
will be noted with blue and bullish signals with yellow.
There is now a cluster of bullish signals from inverted VIX that support the Elliott wave count.
Price has moved sideways today with the balance of volume downwards. Inverted VIX has shown a slight decline. There is no new divergence.
DOW THEORY
Dow Theory confirms a bear market. This does not necessarily mean a bear market at Grand Super Cycle degree though; Dow Theory makes no comment on Elliott wave counts. On the 25th of August 2015 Dow Theory also confirmed a bear market. The Elliott wave count sees that as part of cycle wave II. After Dow Theory confirmation of a bear market in August 2015, price went on to make new all time highs and the bull market continued.
DJIA: 23,344.52 – a close on the 19th of December at 23,284.97 confirms a bear market.
DJT: 9,806.79 – price has closed below this point on the 13th of December.
S&P500: 2,532.69 – a close on the 19th of December at 2,506.96 provides support to a bear market conclusion.
Nasdaq: 6,630.67 – a close on the 19th of December at 6,618.86 provides support to a bear market conclusion.
With all the indices moving now higher, Dow Theory would confirm a bull market if the following highs are made:
DJIA: 26,951.81
DJT: 11,623.58
S&P500: 2,940.91
Nasdaq: 8,133.30.
Published @ 06:37 p.m. EST.
—
Careful risk management protects your trading account(s).
Follow my two Golden Rules:
1. Always trade with stops.
2. Risk only 1-5% of equity on any one trade.
Tomorrow is the ES rollover day. I agree with Verne when he says, “Looks like a neatly laid bear trap for the early eager beavers.” I have a bear trap scenario that makes sense to me. It unfolds like this …
ES price continues down to 2760. This level will accomplish 2 things. It will bring out the bears (because there is a lower low and a formation that will be seen as a top). The second thing is that price level will be 100 handles from the Primary 1 target of 2860, which is still there (both on the chart and in my head). The 100 handles range is a nice round number and these algos have used targeting measurements like this before.
At ES 2760, the chart isn’t all torn up. The bias can still be considered bullish. It would just be a 60 point retracement.
At ES 2860 all the burned up bears will have become bulls, which will be a wonderful time to begin primary 2.
Interesting scenareo, CM. I was aleady watching ES closely this evening, looking for a short ride up.
Might let it drop a bit more.
🙂
This morning
Spot vix has taken all contango out with vix futures
And may move into slight backwardation
All times during the past several months when this happened
The market bounced or continued to rise
Something to watch..
Also every Friday the last months have been one big gap and go pounding …
Tomorrow should be an interesting day
I’ll be putting hedges back on in vxxb and spy for my longs and shorts accordingly today
Just in case it is another bear trap and they have the clubs ready for Friday 🙂
Sold upside calls in nflx and fb for tomorrow
My latest round of 280 spy call sales
(This time for Friday )
Another 3 time winner (mon,wed, and now Friday)
I’ll be covering today….
It seems more like distribution and killing calls… rather than letting bears get some real food
got those ‘Gap Down invalidates Main and traps longs’ vibes.
This morning, I’m not sure what this market is up to. It could be just completing another small consolidation, or it could be forming a rounded top.
Both options look about equally as likely.
We need to see a breakout to know what is going to happen next.
Main wave count updated:
Minute ii has not moved beyond the start of minute i, so this remains valid.
It’s also possible to relabel this to see minor 2 continuing further as a double, but I do not like that idea due to poor proportion.
Alternate scenario updated:
If primary 2 is forming a rounded top, it may be a double combination (or a double flat, but I’ve seen very few of those).
To join the two structures in the double I would expect intermediate (X) to be deeper, they usually are very deep in double combinations. The last small swing high labelled minute b is not deep enough, and at that high I’m having difficulty seeing a zigzag complete there.
OUTSTANDING KEVIN!
Ditto that Kevin. Good for you and proud to be a friend.
Hey hey hey!!! My article on my trend indicator has been selected and is scheduled for publication in Technical Analysis of Stocks and Commodities magazine in May!! Thanks to all who provided input, and a SPECIAL thanks to Lara, whose input was extremely valuable.
Congrats Kevin … I enjoy your insights and commentary on this site . I am interested in reading the published work , please make sure we can all read , or can view it .
Congrats my man!
Getting published is awesome.
It immortalizes your contribution! 🙂
Well done Kevin!
I will say I’m not at all surprised, it is very good. I really like what you’ve created.
When it’s published please put a link here for all members so we can all benefit from it.
Thats a quality achievement brother …
I know in the short time I have been here how much I appreciate your work and insight
Continued success in all you put your mind to
WAY TO GO! I look forward to learning about your trend indicator. Congratulations on your success!
Another trigger I’m watching for: NDX breaking under the several week long rising trend line show here on the hourly chart. That happens (now) at <7096.
Along with this one in SPX: I have a lower channel line running through multiple overlapped key fibo’s, all which are right around the “neckline” of the potential head/shoulders top. The price area is highlighted on this hourly, 2762-68. Breaking below that would be huge for the bear case, IMO.
Just about tagged this area…and turned. For now!
For a dose of fundamental data (current), search for “global manufacturing falls to a 32 month low”. It comes up top of the list for me (a theotrade article).
BA is grossly over bought. And just starting to possibly break down. I bought puts two days ago. They are just now starting to go positive. If you are bearish, this isn’t a bad place for a bet, IMO. A lot of folks are going to want to get profits out if the overall market starts to tumble.
30% of DJIA gains this year came from that beast…not good…
I switched my view and am looking for a new marginal high in all three indices I’m long via April calls here. Setting my stops on QQQ and SPY at march 4th lows.
I guess you are talking SPX, NDX and DJIA, because RUT is below it’s March 4 low and dropping pretty fast.
Well originally I thought RUT was leading the wave count now I believe it is actually lagging the SPX count but if the SPX and NDX break those March 4th lows yes I will exit IWM as well
VIX hasn’t taken out the highs from 2 days ago with this move down, so that can be a sign for your bullish outlook…
I’m far from the bullish camp LOL actually I may be further to the right of Verne’s bearish camp. I’ just not seeing this move as impulsive which leads me to believe its a bear trap. The stopped out risk is only a .5% or so from where we and as you said the VIX has come no where near confirming the move down. I’ve learned the hard way trying to short the tops of this move that while early doesn’t mean wrong it often has the same result on my account. LOL
I do believe you are correct Sir!
Looks like a neatly laid bear trap for the early eager beavers.
The “C” or third down should take no prisoners as it should be commensurate with a bankster unwind. I think they are “playing” us.
While I am definitely bearish mid to intermediate term, I do have my suspicions about what we are currently seeing….
The SPX is forming a clear rounded top on the daily chart. Of course, this can morph into something else. But I like to look for patterns as they develop. Vern has made the case below for the upward sloping wedge which has broken down and made the classic return to the underside of the wedge before starting to plunge. This is part of the rounded top.
Additional support for the SPX “rolling over” includes: daily MACD had a bearish cross over, daily on-balance volume had a bearish trend line break, significant price resistance at 2800 to 2825, weekly MACD histogram potentially peaked last week, Fear -Greed Index in the greed zone, AAII bullish weekly sentiment at 41.63 % the highest level since September 2018, AAII bearish sentiment at 20% the lowest since September 2018. (I can only access the AAII figures back to October 11, 2018.)
Add it all up, it is certainly time at least for significant caution. Timing to go short is another matter and I leave that up to all of you. Another dozen points lower in the SPX to form a lower low at 2767 will lend significant support to the bearish case.
The huge bearish indicator would/will be a break of the 200 day sma, which today sits just over 2750.
SPX hourly, showing the “rounding top”. In fact, it’s looking like a head and shoulders with a double top “head”. Everything about this screams “topping action” to me. But that said, it COULD be consolidation before another leg up. A break down through 2762 would be extremely bearish, and yet more if the 200 day at 2750 fell.
I agree Rodney. This certainly could be happening.
I really don’t like to flip flop, but that’s what rounded tops tend to push one to do.
I’m going to sit back and try to identify as clearly as I can support and resistance and use those lines to determine a breakout. A breakout may give confidence in what is happening here.
I like your listing here of bearish indications. I think in my classic TA section today I’ll have two lists: bullish and bearish. And leave it up to members to make their own judgement….
RUT has now broken bearish symmetry, with a larger retrace than any other since the bull run started in late December.
Anyone notice how pharma is particularly hammered today? AMGN and PFE…ouch. IBB has turned hard down off a tag of the 78.6% retrace level of the Oct-Dec down move. Meanwhile, a dog like LYB takes off upward….say WHAT? Geez…one of those days.
RUT daily. Trend now neutral at this TF, first time since week of 1/8.
The proverbial canary has toppled over and is gasping for breath…
Also RUT has turned down off the 200 day sma, with only one reversal bar barely closing slightly above it (2/25).
I have went home uncomfortably long lol
Lara, can yesterday’s high be seen as the end of P1? Before reading yesterday’s analysis, that’s what I thought it was…
If so, why is the preferred start of P2 seen as it having an expanded flat B wave with a relatively weak C wave of the P2 ending around 2700? And not a deeper P2 with P1 ending at yesterday’s high?
Thanks in advance 🙂
A most excellent question Ari.
I’ve been wondering that too.
I’m going to take a clean hourly chart and see if it can fit. My problem has been that so far I have trouble seeing the last upwards wave as a five, it looks like a three.
Lets see what I can come up with, because that would be a better alternate, wouldn’t it.
Two test and turns off the 13 ema on the daily. This test is #3.
The Ciovacco Capital weekly update is interesting, and in it they’ve been stressing the significance of staying above the daily 200 day sma, with each additional day of doing so increasing the odds of bullish action over the next 3-12 months. Contra-wise, a break down here and move under it (about 2750 and rising now) would be Rather Bearish. Of course this is intuitively obvious but they back it with historical data, lots and lots of historical analogous cases of a V bottom and move back up without a retrace up and through the 200 day sma. They are point out this is only the 3rd such instance of that happening with a corresponding breadth thrust, and in both other cases, what following was substantial bullish action and no break down back through the 200 day. They state they are incrementally increasing their long allocation as the bullish case continues to strengthen.
Ciovacco is obviously a very capable guy but I think he is going to be stopped out.
The larger picture shows a very clear bearish rising wedge that is one of the steepest I have ever seen. We have bearish divergences (momentum, RSI, MACD etc) that are sharper than those we saw at the highs last Fall so I think this market is going to fall and fall very hard. The ongoing relentless stock buy-backs and other capital infusion into the market makes it tough to tell when the turn will come but I think it is only a matter of time…
“A breach of the black channel on the daily chart would indicate a deeper pullback has arrived for primary wave 2. The target would be about 2,768.53 or a little below.”
Target seems a tad high for a P2 down… 🙂
38% of the 1 up at 2639, and 62% at 2528. Massive “room” for a 2 down to rumble! That said…I dunno. The 23% overlaps a higher swings 78% at 2708-2710.
I have a lot of overlapped fibo levels. Four levels in a row: 2763, 2750, 2732, 2708 (approximate mid points). That to me adds significantly to the evidence that we have a significant swing high in place on the daily. We’ve got “fractal fit” right here.
Yeah, I do agree.
I’ve chosen that target because combinations should be sideways moves.
It could get lower as an expanded flat, but before I can calculate that prospect intermediate (B) needs to make a new high to be 1.05 X intermediate (A) or longer.
Boom !
Not so fast Elmer!