
Upwards movement has overall continued as the week expected, but the weekly candlestick has closed as a doji and price ended the week with mostly sideways movement.
Summary: The bottom line at the end of the week is price is range bound. To indicate the next movement there needs to be a breakout.
A new high above 2,813.49 would indicate the upwards trend remains intact. The target would then be at 2,856.
A breach of the black channel on the daily chart would indicate a deeper pullback has arrived for primary wave 2. Targets would be 2,635 and 2,525.
New updates to this analysis are in bold.
The biggest picture, Grand Super Cycle analysis, is here.
Last published monthly charts are here. Video is here.
ELLIOTT WAVE COUNT
WEEKLY CHART
Click chart to enlarge.
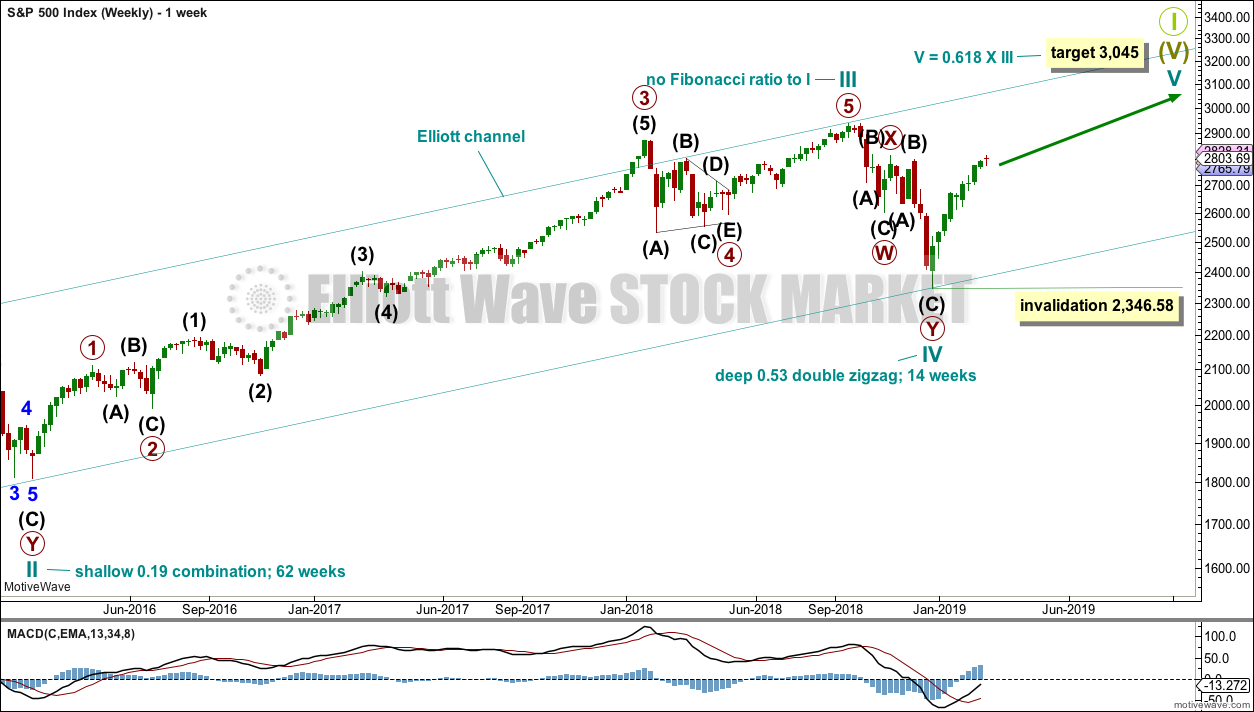
This weekly chart shows all of cycle waves III, IV and V so far.
Cycle wave II fits as a time consuming double combination: flat – X – zigzag. Combinations tend to be more time consuming corrective structures than zigzags. Cycle wave IV has completed as a multiple zigzag that should be expected to be more brief than cycle wave II.
Cycle wave IV may have ended at the lower edge of the Elliott channel.
Within cycle wave V, no second wave correction may move beyond the start of its first wave below 2,346.58.
Although both cycle waves II and IV are labelled W-X-Y, they are different corrective structures. There are two broad groups of Elliott wave corrective structures: the zigzag family, which are sharp corrections, and all the rest, which are sideways corrections. Multiple zigzags belong to the zigzag family and combinations belong to the sideways family. There is perfect alternation between the possible double zigzag of cycle wave IV and the combination of cycle wave II.
Although there is gross disproportion between the duration of cycle waves II and IV, the size of cycle wave IV in terms of price makes these two corrections look like they should be labelled at the same degree. Proportion is a function of either or both of price and time.
Draw the Elliott channel about Super Cycle wave (V) with the first trend line from the end of cycle wave I (at 2,079.46 on the week beginning 30th November 2014) to the high of cycle wave III, then place a parallel copy on the low of cycle wave II. Cycle wave V may find resistance about the upper edge.
It is possible that cycle wave V may end in October 2019. If it does not end there, or if the AD line makes new all time highs during or after June 2019, then the expectation for cycle wave V to end would be pushed out to March 2020 as the next possibility. Thereafter, the next possibility may be October 2020. March and October are considered as likely months for a bull market to end as in the past they have been popular. That does not mean though that this bull market may not end during any other month.
DAILY CHART
Click chart to enlarge.
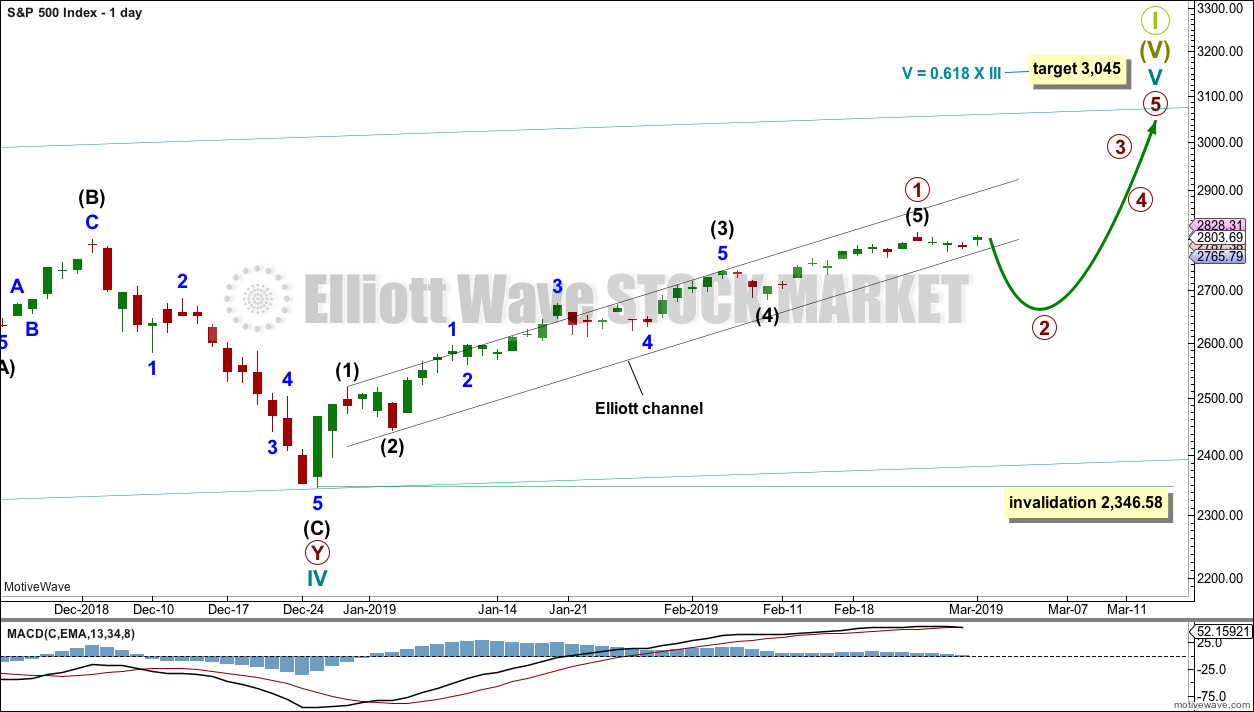
The daily chart will focus on the structure of cycle wave V.
Within Super Cycle wave (V), cycle wave III may not be the shortest actionary wave. Because cycle wave III is shorter than cycle wave I, this limits cycle wave V to no longer than equality in length with cycle wave III at 3,477.39. A target is calculated for cycle wave V to end prior to this point.
Cycle wave V must subdivide as a five wave motive structure, either an impulse or an ending diagonal. An impulse is much more common and that will be how it is labelled. A diagonal would be considered if overlapping suggests it.
Primary wave 1 is again labelled as possibly complete, but this labelling is tentative. A breach of the black channel is required for confidence that primary wave 1 is over and primary wave 2 has begun.
An Elliott channel is drawn about the impulse of primary wave 1. When a full daily candlestick prints below the lower edge of the channel and not touching the lower edge, that may be taken as confirmation of a trend change.
If price makes a new high next week by any amount at any time frame above 2,813.49, then primary wave 1 would be relabelled as incomplete and the target would be at 2,856.
Primary wave 2 may not move beyond the start of primary wave 1 below 2,346.58.
MAIN HOURLY CHART
Click chart to enlarge.
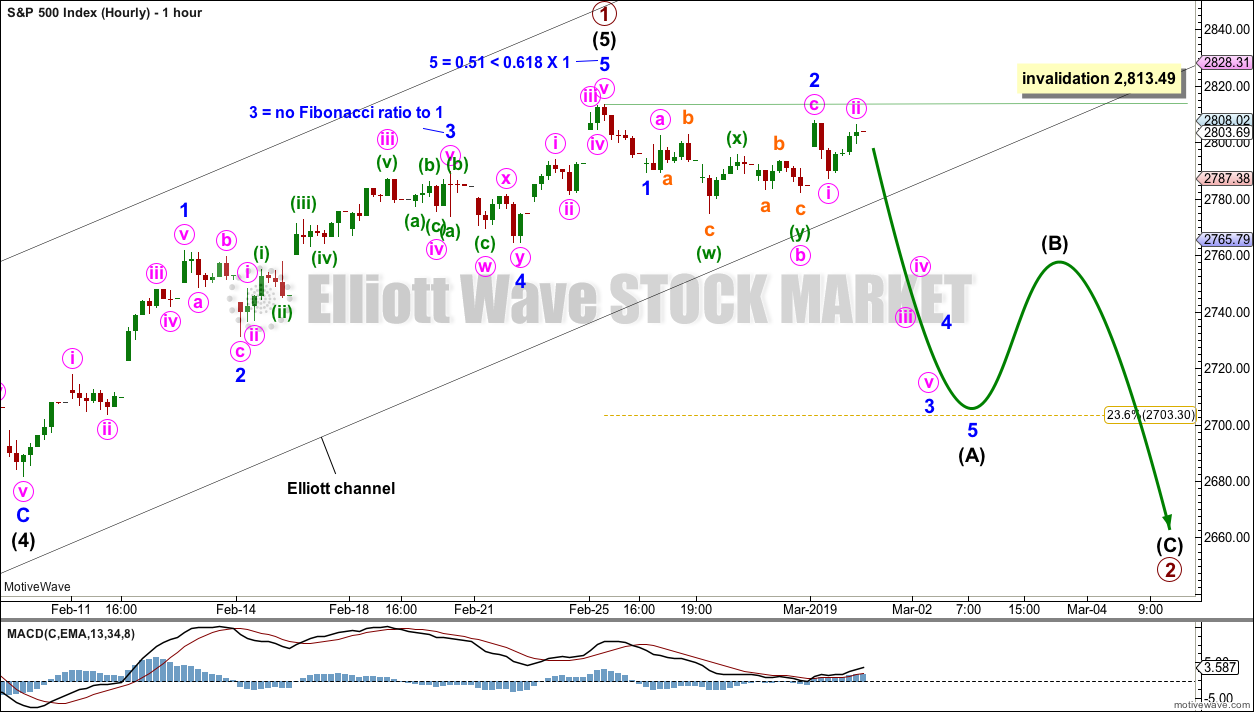
It is possible that primary wave 1 may be over and primary wave 2 may have just begun at the last high.
Primary wave 2 would most likely subdivide as a zigzag. It must begin with a five down at the hourly chart level, and within this minor wave 2 may not move beyond the start of minor wave 1 above 2,813.49.
The most likely targets for primary wave 2 would be the 0.382 Fibonacci ratio at 2,635.13 or the 0.618 Fibonacci ratio at 2,624.94. Primary wave 2 may last a few weeks.
A clear breach of the black Elliott channel is required for any confidence in this wave count.
ALTERNATE HOURLY CHART
Click chart to enlarge.
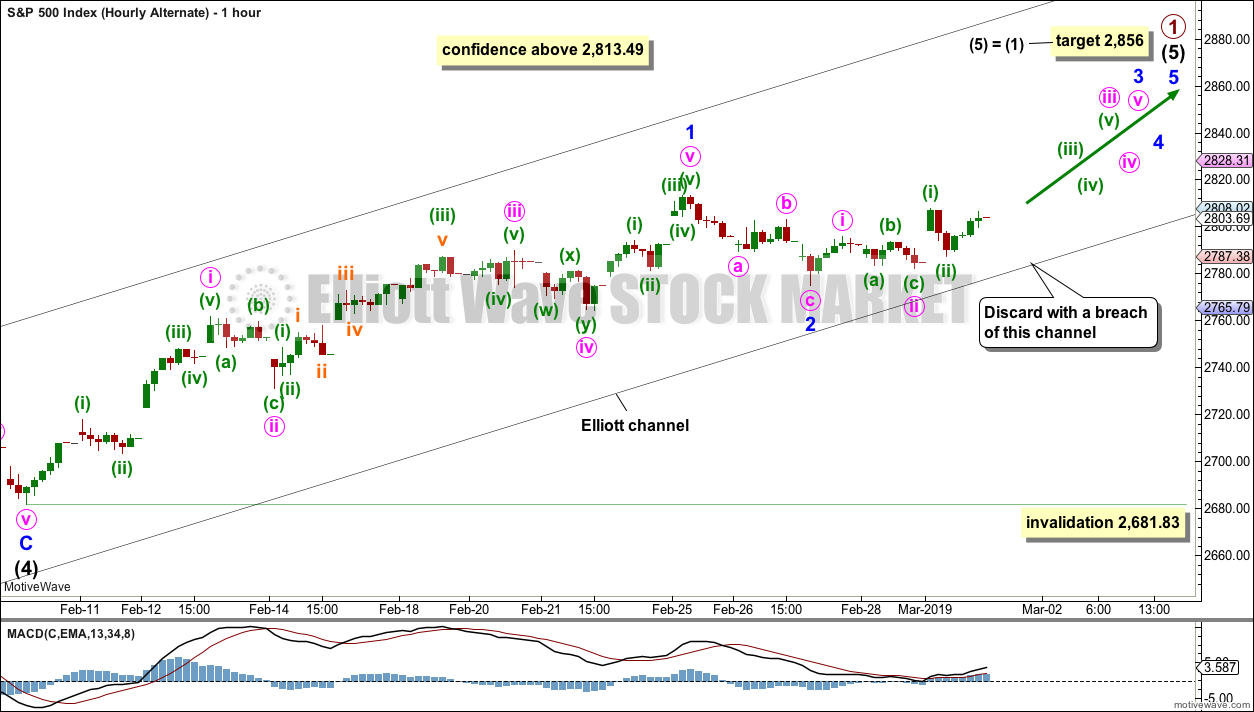
This alternate hourly chart moves the degree of labelling within intermediate wave (5) down one degree.
This alternate hourly wave count expects intermediate wave (5) to be extended.
Within intermediate wave (5), minor wave 1 may have been over at the last high. The subdivisions for both hourly charts are seen in the same way, with the sole exception the degree of labelling. This hourly chart moves the degree of labelling down one degree.
Minor wave 2 may not move beyond the start of minor wave 1 below 2,681.83. However, if the black channel is breached by downwards movement (not sideways), that would be taken as an indication that this wave count would be wrong and the main wave count may be correct. This wave count would be discarded prior to full invalidation.
Minor wave 3 should now exhibit some increase in upwards momentum. If should have the power to break above resistance at 2,815.
TECHNICAL ANALYSIS
WEEKLY CHART

Click chart to enlarge. Chart courtesy of et=”_blank”>StockCharts.com.
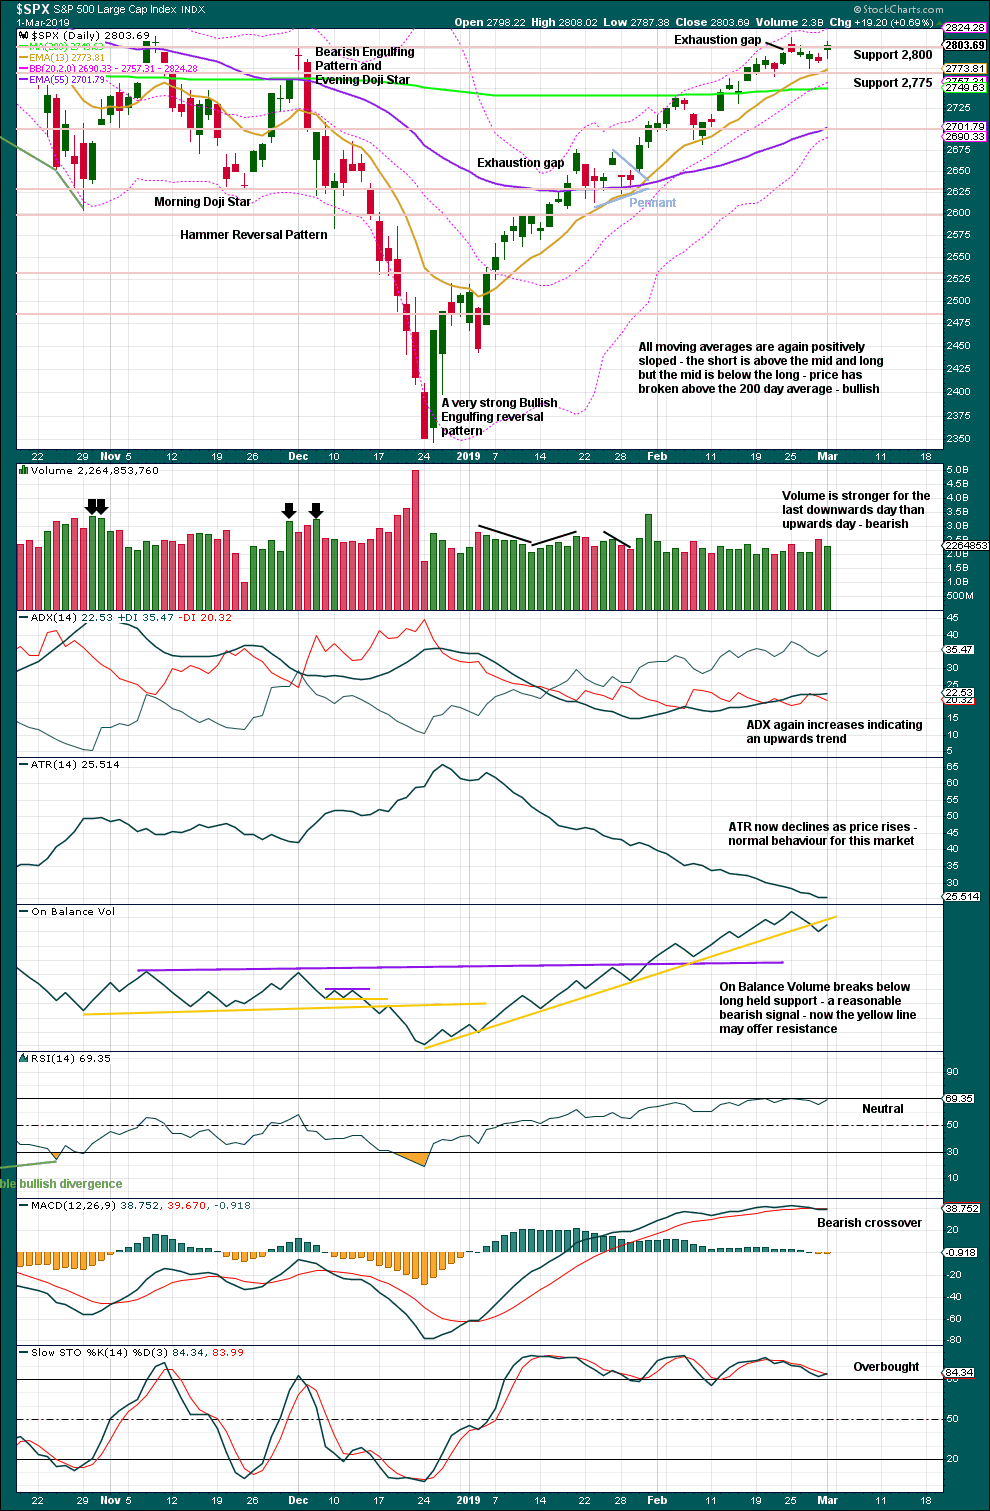
Volume and On Balance Volume are very bullish. But the doji candlestick this week again signals a warning. A doji on its own is not a reversal signal, but it is enough to put the trend from up into more neutral territory.
DAILY CHART
Click chart to enlarge. Chart courtesy of StockCharts.com.
Over a fairly long period of time this ageing bull market has been characterised by upwards movement on light and declining volume and low ATR. For the short to mid term, little concern may be had if price now rises again on declining volume. Current market conditions have allowed for this during a sustained rise in price.
It is also normal for this market to have lower ATR during bullish phases, and strongly increasing ATR during bearish phases. Currently, declining ATR is normal and not of a concern.
Considering the larger picture from the Elliott wave count, some weakness approaching the end of Grand Super Cycle wave I is to be expected.
From Kirkpatrick and Dhalquist, “Technical Analysis” page 152:
“A 90% downside day occurs when on a particular day, the percentage of downside volume exceeds the total of upside and downside volume by 90% and the percentage of downside points exceeds the total of gained points and lost points by 90%. A 90% upside day occurs when both the upside volume and points gained are 90% of their respective totals”…
and “A major reversal is singled when an NPDD is followed by a 90% upside day or two 80% upside days back-to-back”.
The current situation saw two 80% downside days on December 20th and 21st, then a near 90% downside day with 88.97% downside on December 24th. This very heavy selling pressure on three sessions together may be sufficient to exhibit the pressure observed in a 90% downside day.
This has now been followed by two 90% upside days: on December 26th and again on 4th January.
The current situation looks very much like a major low has been found.
This chart is overall very bullish. Only the moving averages are not yet full bore bullish.
The last gap is now closed, so it is renamed an exhaustion gap. This is bearish and may be the first warning of a deeper pullback. But equally as likely, at this stage, it may only indicate another relatively brief pullback or sideways consolidation.
Yesterday’s bearish signal from On Balance Volume in conjunction with price halting at very strong resistance support the idea that primary wave 1 may be over and primary wave 2 may have begun.
Another new high would signal the bull run is not over.
BREADTH – AD LINE
WEEKLY CHART
Click chart to enlarge. Chart courtesy of StockCharts.com. So that colour blind members are included, bearish signals
will be noted with blue and bullish signals with yellow.
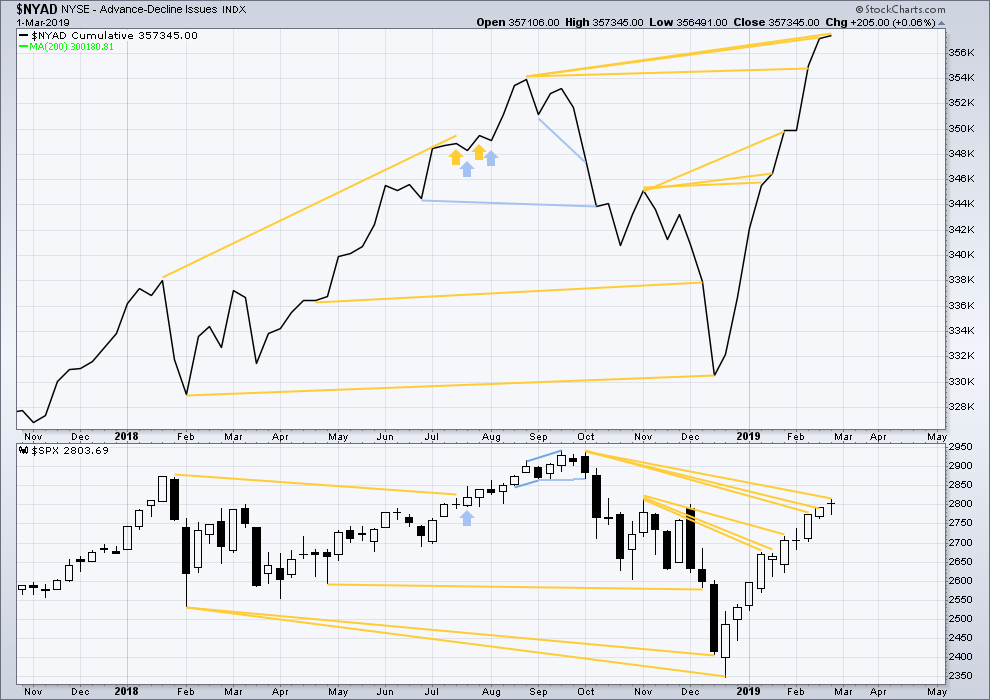
Every single bear market from the Great Depression and onwards has been preceded by a minimum of 4-6 months divergence between price and the AD line. With the AD line making a new all time high again this week, the end of this bull market and the start of a new bear market must be a minimum of 4 months away, which is mid to end June 2019 at this time.
DAILY CHART

Click chart to enlarge. Chart courtesy of StockCharts.com. So that colour blind members are included, bearish signals
will be noted with blue and bullish signals with yellow.
Breadth should be read as a leading indicator.
There is now a cluster of bullish signals from the AD line. This supports the Elliott wave count.
The AD line has made a slight new high above the prior high 4/5 sessions ago, but price has not. This divergence is bullish for the short term, but it is weak.
VOLATILITY – INVERTED VIX CHART
WEEKLY CHART
Click chart to enlarge. Chart courtesy of StockCharts.com. So that colour blind members are included, bearish signals
will be noted with blue and bullish signals with yellow.
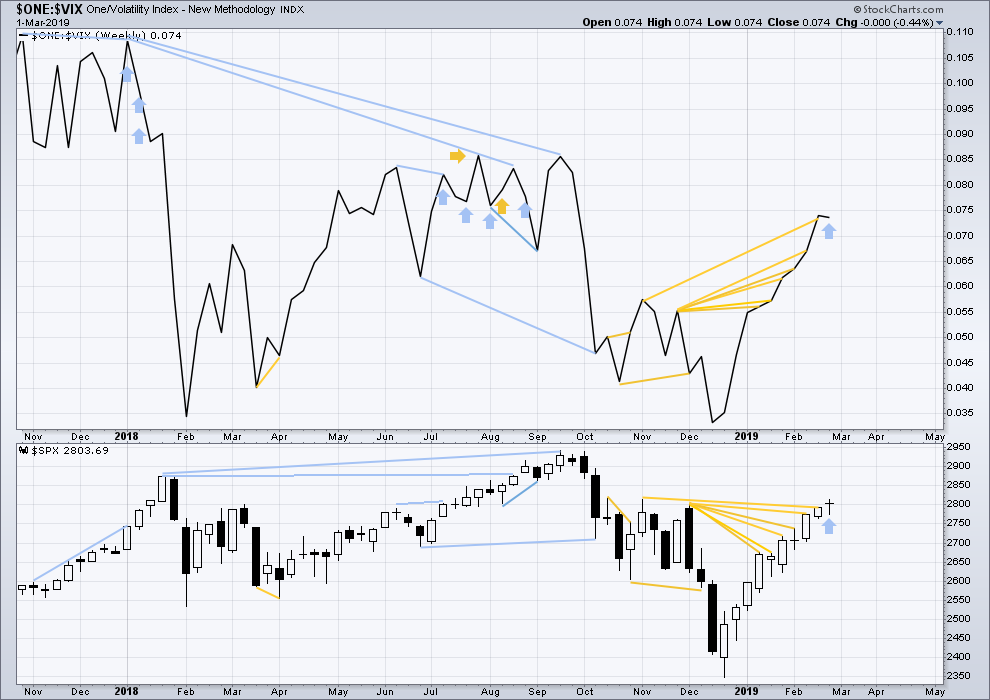
Upwards movement for this week came with a normal corresponding decline in VIX. There is no new divergence. *Edit: this sentence has been updated.
DAILY CHART
Click chart to enlarge. Chart courtesy of StockCharts.com. So that colour blind members are included, bearish signals
will be noted with blue and bullish signals with yellow.
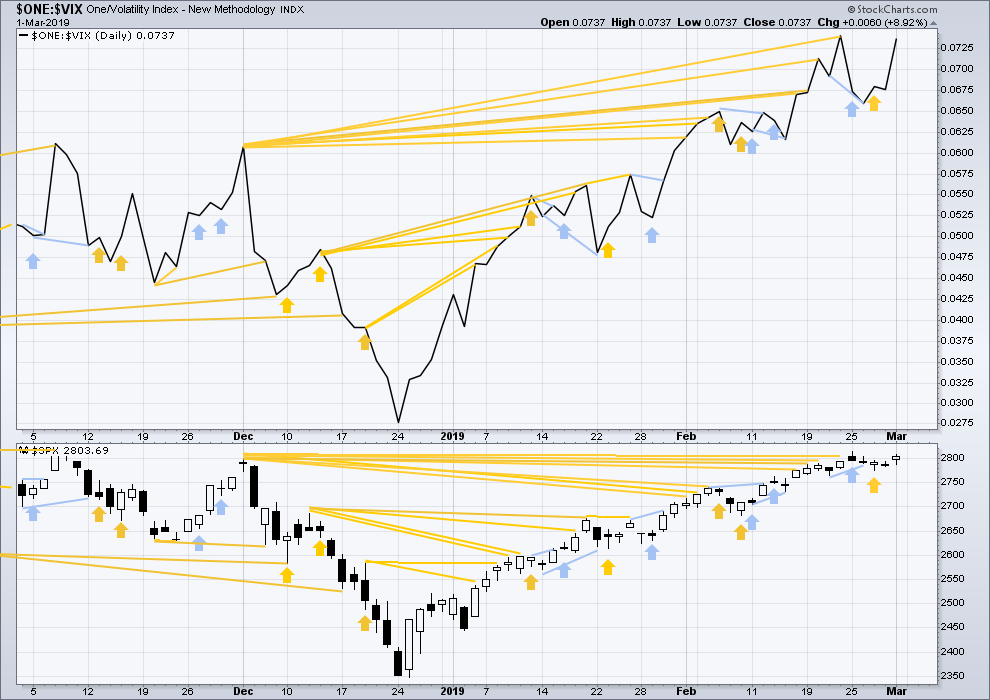
There is now a cluster of bullish signals from inverted VIX that support the Elliott wave count.
For Friday price moved higher, and inverted VIX moved higher. Upwards movement has come with a normal corresponding decline in VIX. There is no divergence.
DOW THEORY
Dow Theory confirms a bear market. This does not necessarily mean a bear market at Grand Super Cycle degree though; Dow Theory makes no comment on Elliott wave counts. On the 25th of August 2015 Dow Theory also confirmed a bear market. The Elliott wave count sees that as part of cycle wave II. After Dow Theory confirmation of a bear market in August 2015, price went on to make new all time highs and the bull market continued.
DJIA: 23,344.52 – a close on the 19th of December at 23,284.97 confirms a bear market.
DJT: 9,806.79 – price has closed below this point on the 13th of December.
S&P500: 2,532.69 – a close on the 19th of December at 2,506.96 provides support to a bear market conclusion.
Nasdaq: 6,630.67 – a close on the 19th of December at 6,618.86 provides support to a bear market conclusion.
With all the indices moving now higher, Dow Theory would confirm a bull market if the following highs are made:
DJIA: 26,951.81
DJT: 11,623.58
S&P500: 2,940.91
Nasdaq: 8,133.30.
Published @ 10:47 p.m. EST.
—
Careful risk management protects your trading account(s).
Follow my two Golden Rules:
1. Always trade with stops.
2. Risk only 1-5% of equity on any one trade.
Trying to work through what the chart is telling me. Like everyone else here, I’m not a bull or a bear, I’m a trader. No agenda.
On this chart, the green box is a bullish signal. After that signal, I don’t see a reversal signal or a bearish signal. What I see is that point B is a new high. This reinforces the bull signal. Also, point C is higher than point A. This means that the bull signal is still in effect, it’s still valid. Point C is a deep retracement.
When we compare today’s range with the range of the bullish 3-candle signal, we see that today we have a higher high and a higher low.
Ask me again next Monday and I’ll have an even better projection. HA!
The price action seems nominal in the context of the 2.5 month bull run so far. Very similar to other pullbacks along the way, and not as deep as the deepest of them. If the 61.8% and the lower channel line go (about 2763) then the outlook changes.
Sold puts in gld for the 121 strike for Friday for .35
Also did a 122-122.50 call spread for .12
1/3 as many calls to put sales
Naked puts???!!!!!
Braveheart!! 🙂
Yeah brother …lol
I wanted to go long this week
And thought I’d sell the puts instead
Give me a little cushion and do the smaller ratio near money call spread to capitalize on a move up
Hourly chart updated:
With the whipsaw to a slight new high and then strongly down today, it is possible that primary wave 2 may be underway as a flat or combination. A target is calculated for this downwards movement to end, minor wave C would = 1.618 X minor wave A.
It’s possible that we just finished C wave of a expanded flat to finish minor 2 of I5… and now in 3 of 5..
And can see new highs, be careful…
thank you HT, I was also seeing this as a possible expanding flat minor 2 down.
RUT at the hourly/daily level is showing a zig-zag down, which has not yet exceeded the largest pullback of the entire bull run from late December. I.e, bullish symmetry is not yet broken (that would be <1560).
Yes Kevin and also the move up to today’s high looks very corrective… so possible… never easy huh??
Also
1) YM and RTY seems like zig zag as u mentioned.
2) they didn’t take it below 64.55 previous low
3) the whole move from today’s low..
Watching carefully
I would watch 15 on the vix
A hold of that should define the direction
It is often very helpful to pay close attention to the profile of the FIRST wave down… 🙂
You seeing 2750-2720 after this bounce Verne ?
If vix holds 15.. that’s what I’m thinking for next wave down
At the very least.
I am profoundly interested in what happens at around 2700.00, where I expect the tale of this extended bull market to be finally told…. 🙂
Absolutely massive volume in Vxxb today
As well as tvix
Seems more than the normal smash down
But these weekly spy options on mon wed and Friday make timing tough
May be holding things up today
Looked like an ED to moi…
Taking a few index longs here looking for a retrace back up
Price is still in the primary channel, and daily tf trend is still up. /ES is only down 0.81%.
So far.
if 2775 dosent hold…… then lots of gaps to fill below
I think we may be coming up on end of Wave 1 down looking for a bounce and then time to double down and reload
This is turning out to be a big “gap and crap.” Looks like P2 has arrived ladies and gentlemen. Tradeshark mentioned IWM as an indicator, and I wanted to mention Dow Jones Transports also. It had a bearish engulfing candle on the weekly chart last week. Not to mention the hanging man candle on all others indices on the weekly charts.
RUS and DJT have been great canaries/leading indicators so far…
We sliced through 2800 like it wasn’t even there!
this is the Verne count
and a channel breach in effect
🙂
Leveraged unwind…ladies and gents…. 🙂
Selling 280 and up calls in spy short term weeklies when underlying is over 280
Mon wed friday
Continues to be gold
As does upside call sales on nflx when underlying is over over 360
Distribution in both in full effect
I believe the last wave up to today can be counted as an ending diagonal if you count the last high last week as the end of wave 3. Either way I believe ,as I said last week, IWM is telling me everything I need to know.
🙂
Gapped right up into a wall….. wonder why they didn’t gap OVER it?
Got deep into that wall, I do believe I can see through a chink now! (I always wanted to play Wall in Midsummer Night’s Dream!). The main is toast (as is anyway). The alternate hourly is awfully bullish.
Another hellah reversal this morning. Last several have been followed quite quickly by ramps right back up. This time…???
Recent, very bullish signal with retracement into the real body of the uncertainty candle
right again.
Yeah man
Good work
or…is it? Lol!!! This market loves to maximize uncertainty!
Lara, in your VIX analysis it’s mentioned that VIX moved higher with higher prices. But VIX did move lower, by 8% actually. It didn’t take out the last inverted VIX high, but price hasn’t either. For the day though both price and inverted VIX both moved higher
You’re absolutely right Ari. I don’t know what happened there, a brain fade? Sorry, can’t explain why I did that.
It’s fixed now. There’s no divergence.
1sht! 🙂
You sly little weasel. I’ll get you next time. But for this week, the early bird gets the worm.
🙂
“Sly”…(sans the Family…) 🙂