
A little downwards movement sees price remain within the channel on the daily chart.
Summary: The bigger picture still expects that a low may now be in place. The final target is at 3,045 with a limit at 3,477.39.
Along the way up to the final target, two large corrections for primary waves 2 and 4 are expected. It is possible that primary wave 2 has begun yesterday, but no confidence may be had in this view until the black channel on the daily chart is breached.
Assume the trend remains the same, upwards, while price remains within the black channel.
New updates to this analysis are in bold.
The biggest picture, Grand Super Cycle analysis, is here.
Last published monthly charts are here. Video is here.
ELLIOTT WAVE COUNT
WEEKLY CHART
Click chart to enlarge.
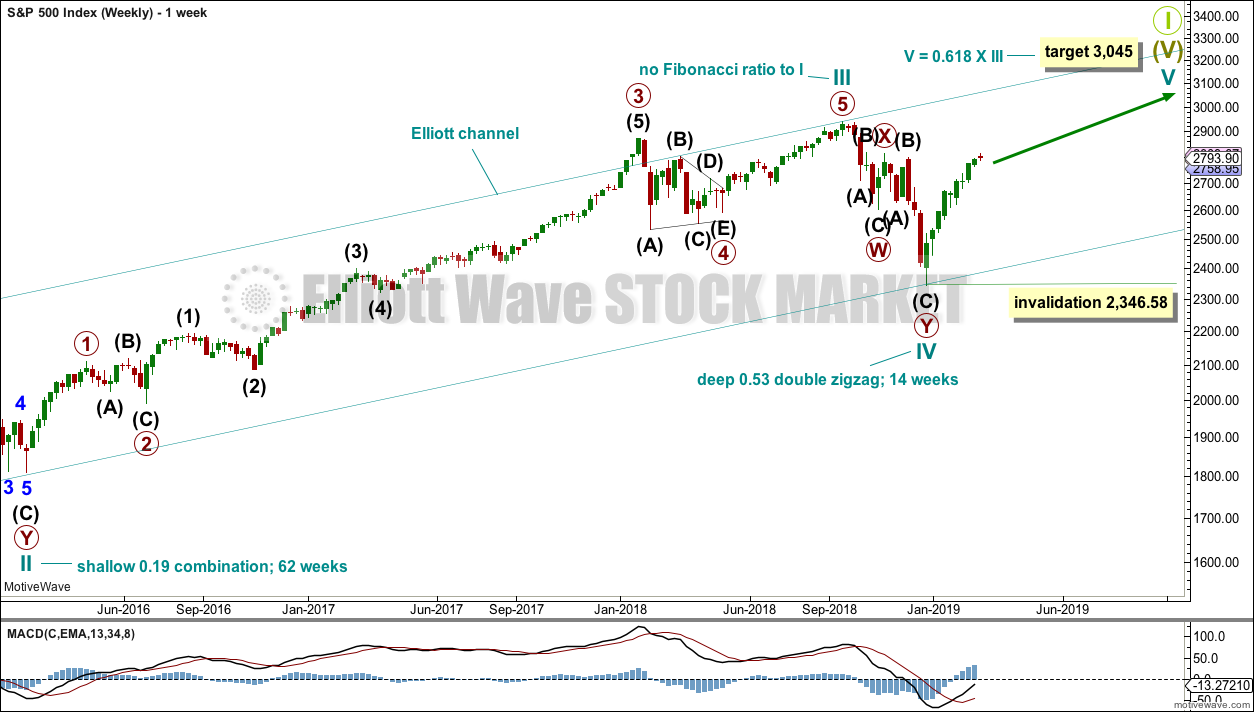
This weekly chart shows all of cycle waves III, IV and V so far.
Cycle wave II fits as a time consuming double combination: flat – X – zigzag. Combinations tend to be more time consuming corrective structures than zigzags. Cycle wave IV has completed as a multiple zigzag that should be expected to be more brief than cycle wave II.
Cycle wave IV may have ended at the lower edge of the Elliott channel.
Within cycle wave V, no second wave correction may move beyond the start of its first wave below 2,346.58.
Although both cycle waves II and IV are labelled W-X-Y, they are different corrective structures. There are two broad groups of Elliott wave corrective structures: the zigzag family, which are sharp corrections, and all the rest, which are sideways corrections. Multiple zigzags belong to the zigzag family and combinations belong to the sideways family. There is perfect alternation between the possible double zigzag of cycle wave IV and the combination of cycle wave II.
Although there is gross disproportion between the duration of cycle waves II and IV, the size of cycle wave IV in terms of price makes these two corrections look like they should be labelled at the same degree. Proportion is a function of either or both of price and time.
Draw the Elliott channel about Super Cycle wave (V) with the first trend line from the end of cycle wave I (at 2,079.46 on the week beginning 30th November 2014) to the high of cycle wave III, then place a parallel copy on the low of cycle wave II. Cycle wave V may find resistance about the upper edge.
It is possible that cycle wave V may end in October 2019. If it does not end there, or if the AD line makes new all time highs during or after June 2019, then the expectation for cycle wave V to end would be pushed out to March 2020 as the next possibility. Thereafter, the next possibility may be October 2020.
DAILY CHART
Click chart to enlarge.
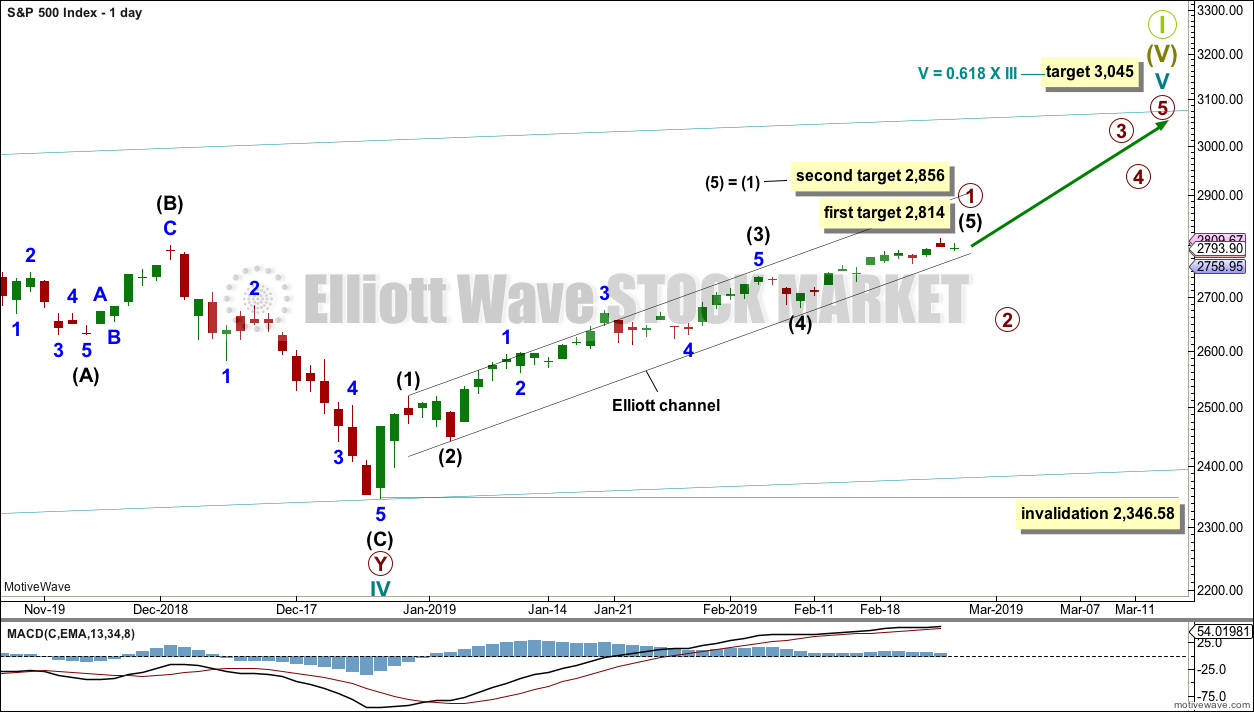
The daily chart will focus on the structure of cycle wave V.
Within Super Cycle wave (V), cycle wave III may not be the shortest actionary wave. Because cycle wave III is shorter than cycle wave I, this limits cycle wave V to no longer than equality in length with cycle wave III at 3,477.39. A target is calculated for cycle wave V to end prior to this point.
Cycle wave V must subdivide as a five wave motive structure, either an impulse or an ending diagonal. An impulse is much more common and that will be how it is labelled. A diagonal would be considered if overlapping suggests it.
Primary wave 1 is labelled as incomplete.
An Elliott channel is drawn about the impulse of primary wave 1. This channel will now be used to indicate when primary wave 1 is complete and primary wave 2 has begun. When a full daily candlestick prints below the lower edge of the channel and not touching the lower edge, that may be taken as confirmation of a trend change. Assume the trend remains the same, upwards, while price remains within the channel.
Primary wave 2 may not move beyond the start of primary wave 1 below 2,346.58.
FIRST HOURLY CHART
Click chart to enlarge.
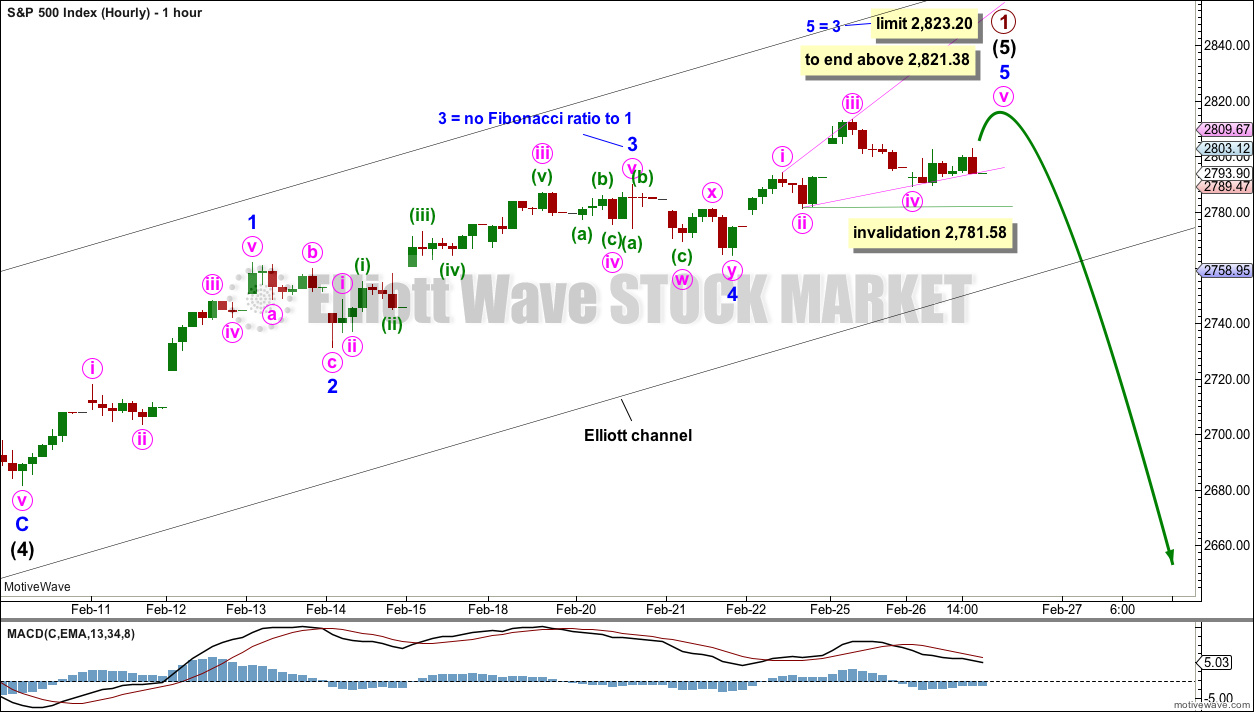
This main hourly wave count expects intermediate wave (5) to not be extended and to end within a strong zone of resistance about 2,800 to 2,815.
Within intermediate wave (5), minor waves 1 through to 4 may be complete. Minor wave 3 for this wave count is shorter in length than minor wave 1. Because a core Elliott wave rule states third waves may not be the shortest actionary waves, this limits minor wave 5 to no longer the equality in length with minor wave 3 at 2,823.20. A target for minor wave 5 to end is calculated which is below this limit.
Minor wave 5 may be unfolding as an ending expanding diagonal. Within an expanding diagonal, minute wave v must be longer than equality in length with minute wave iii. Minute wave v must end above 2,821.38.
Ending diagonals are not rare structures, but they are usually contracting. However, while not common, ending expanding diagonals are also not particularly rare.
Within the diagonal, minute wave iv may not move beyond the start of minute wave ii below 2,781.58.
A breach of the black Elliott channel, which is copied over here from the daily chart, would be required for confidence in a trend change at primary degree.
SECOND HOURLY CHART
Click chart to enlarge.
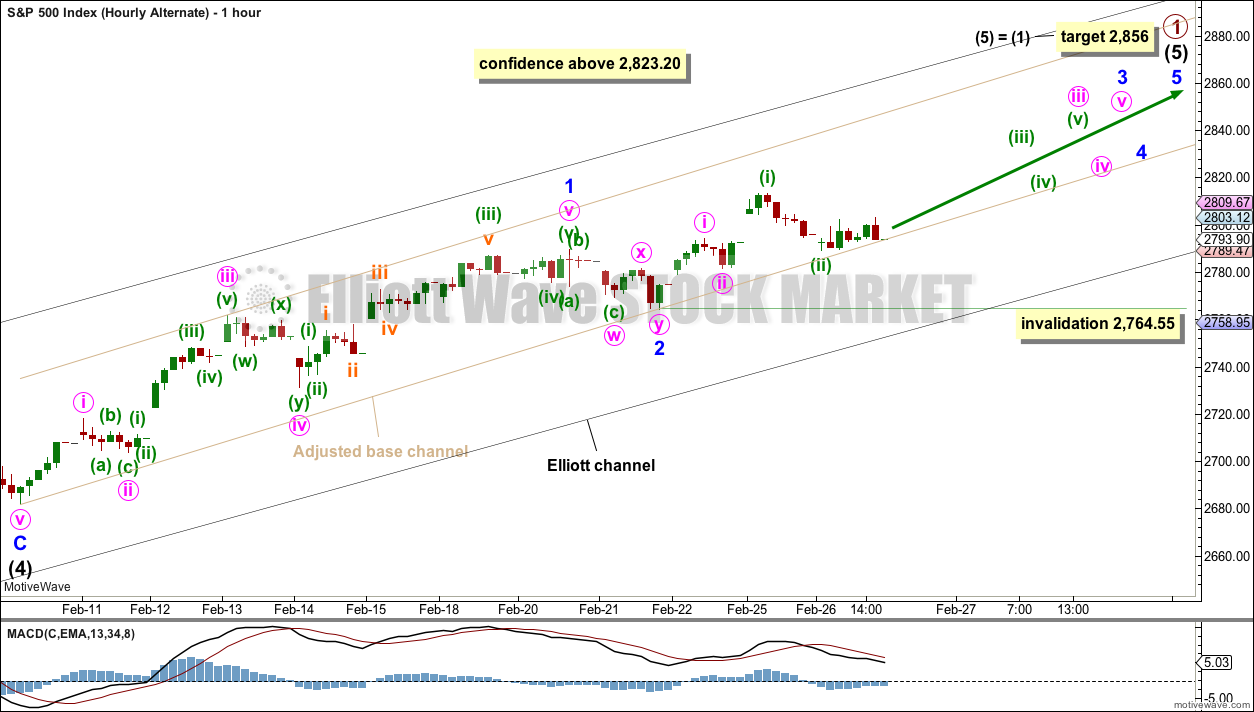
Within intermediate wave (5), minor waves 1 and 2 may be complete. This alternate wave count expects intermediate wave (5) may be extending. This would be required for the target at 2,856 to be met.
Within minor wave 3, there may now be two overlapping first and second waves complete. This wave count now expects to see an increase in upwards momentum tomorrow. Within minor wave 3, no second wave correction may move beyond the start of its first wave below 2,764.55. Only a breach of the invalidation point would fully invalidate this second wave count.
This wave count would expect pullbacks within intermediate wave (5) to now find support about the lower edge of the base channel drawn here. If this trend line is breached by downwards movement, that would be an indication this wave count may be wrong. At the end of this session, the lower edge of this channel has shown where downwards movement found support.
THIRD HOURLY CHART
Click chart to enlarge.
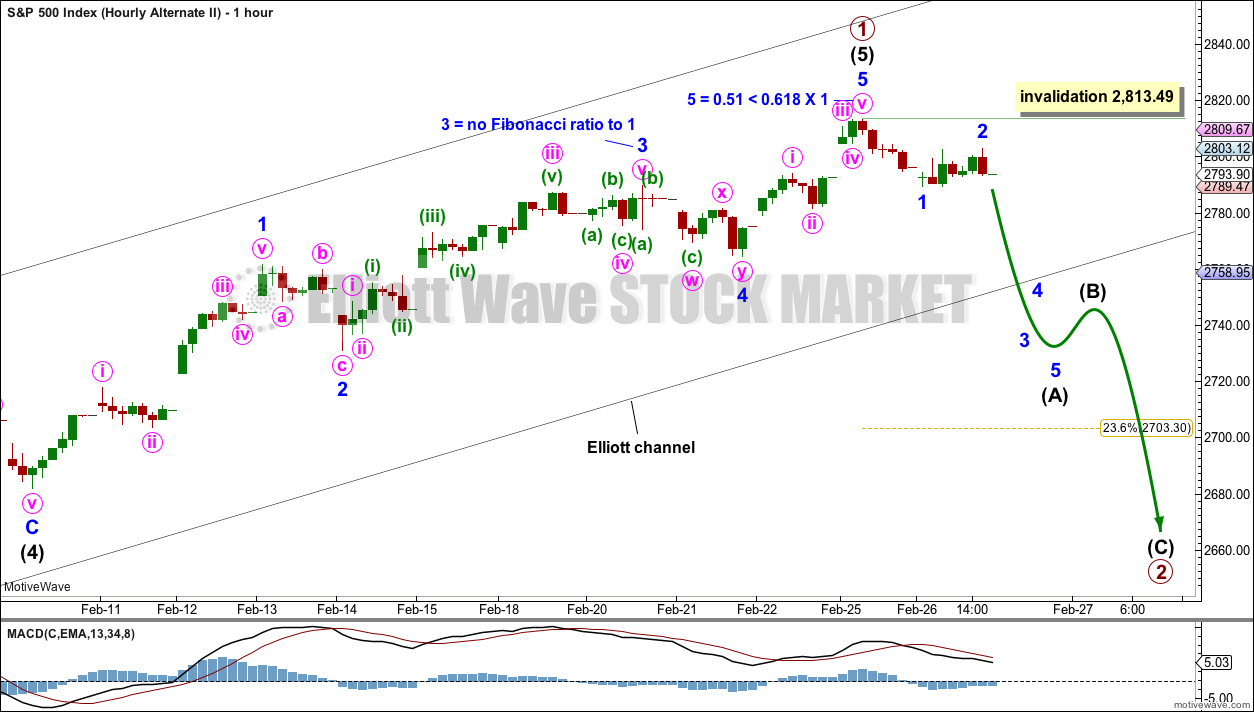
It is also possible that primary wave 1 may be over and primary wave 2 may have just begun at the last high.
Within intermediate wave (5), minor wave 5 looks like a three wave structure at the hourly chart level, but it will subdivide as a five wave impulse on the five minute chart.
Primary wave 2 would most likely subdivide as a zigzag. It must begin with a five down at the hourly chart level, and within this minor wave 2 may not move beyond the start of minor wave 1 above 2,813.49.
The most likely targets for primary wave 2 would be the 0.382 Fibonacci ratio at 2,635.13 or the 0.618 Fibonacci ratio at 2,624.94. Primary wave 2 may last a few weeks.
A clear breach of the black Elliott channel is absolutely required for any confidence in this wave count. A new low below 2,764.55 thereafter would add further confidence.
TECHNICAL ANALYSIS
WEEKLY CHART
Click chart to enlarge. Chart courtesy of et=”_blank”>StockCharts.com.
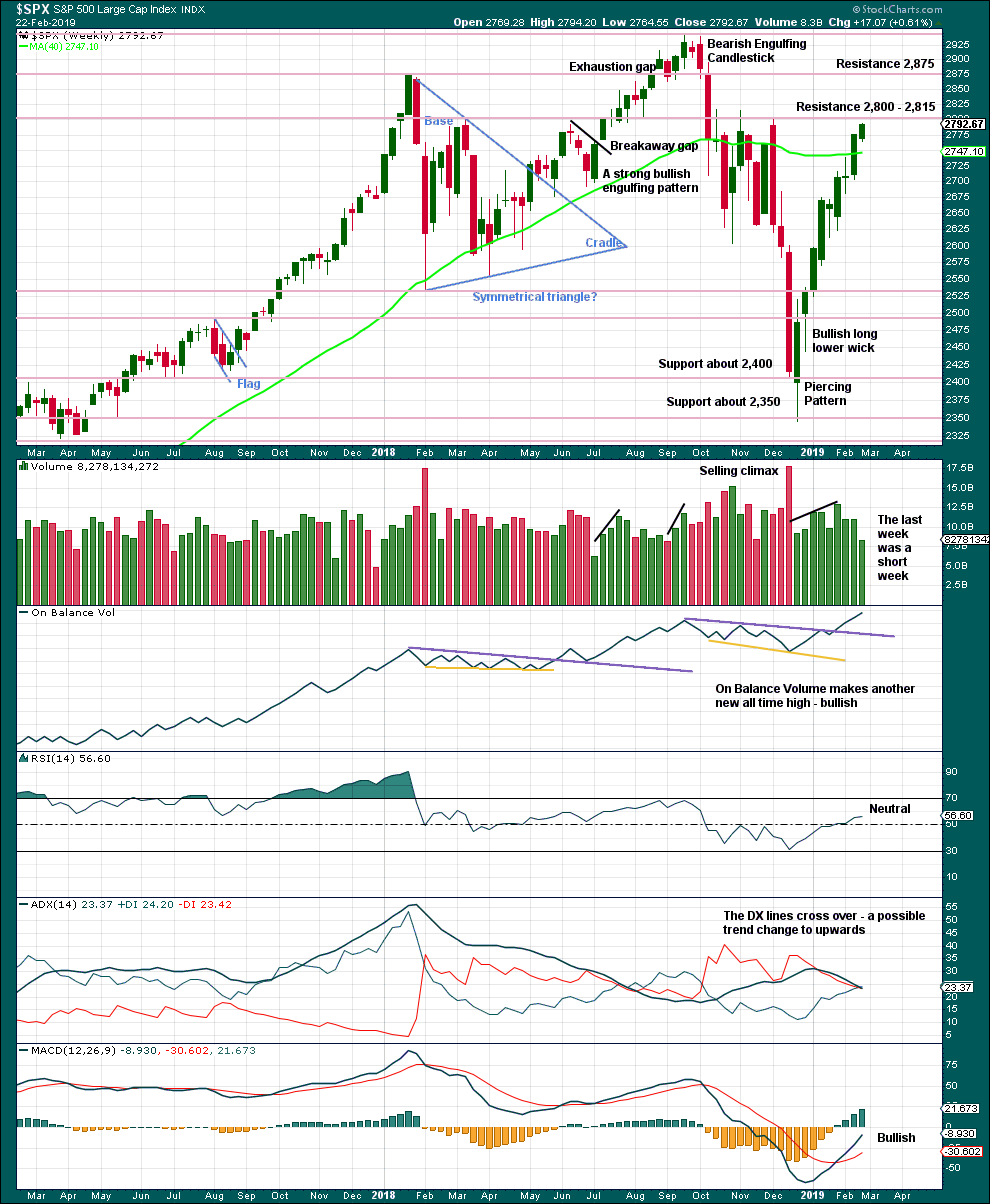
Because this week consisted of only four trading days, the decline in volume may not be necessarily bearish. It is necessary this week to look inside the week at daily volume bars to judge the volume profile.
Overall, this chart is bullish and supports the Elliott wave count.
DAILY CHART
Click chart to enlarge. Chart courtesy of StockCharts.com.
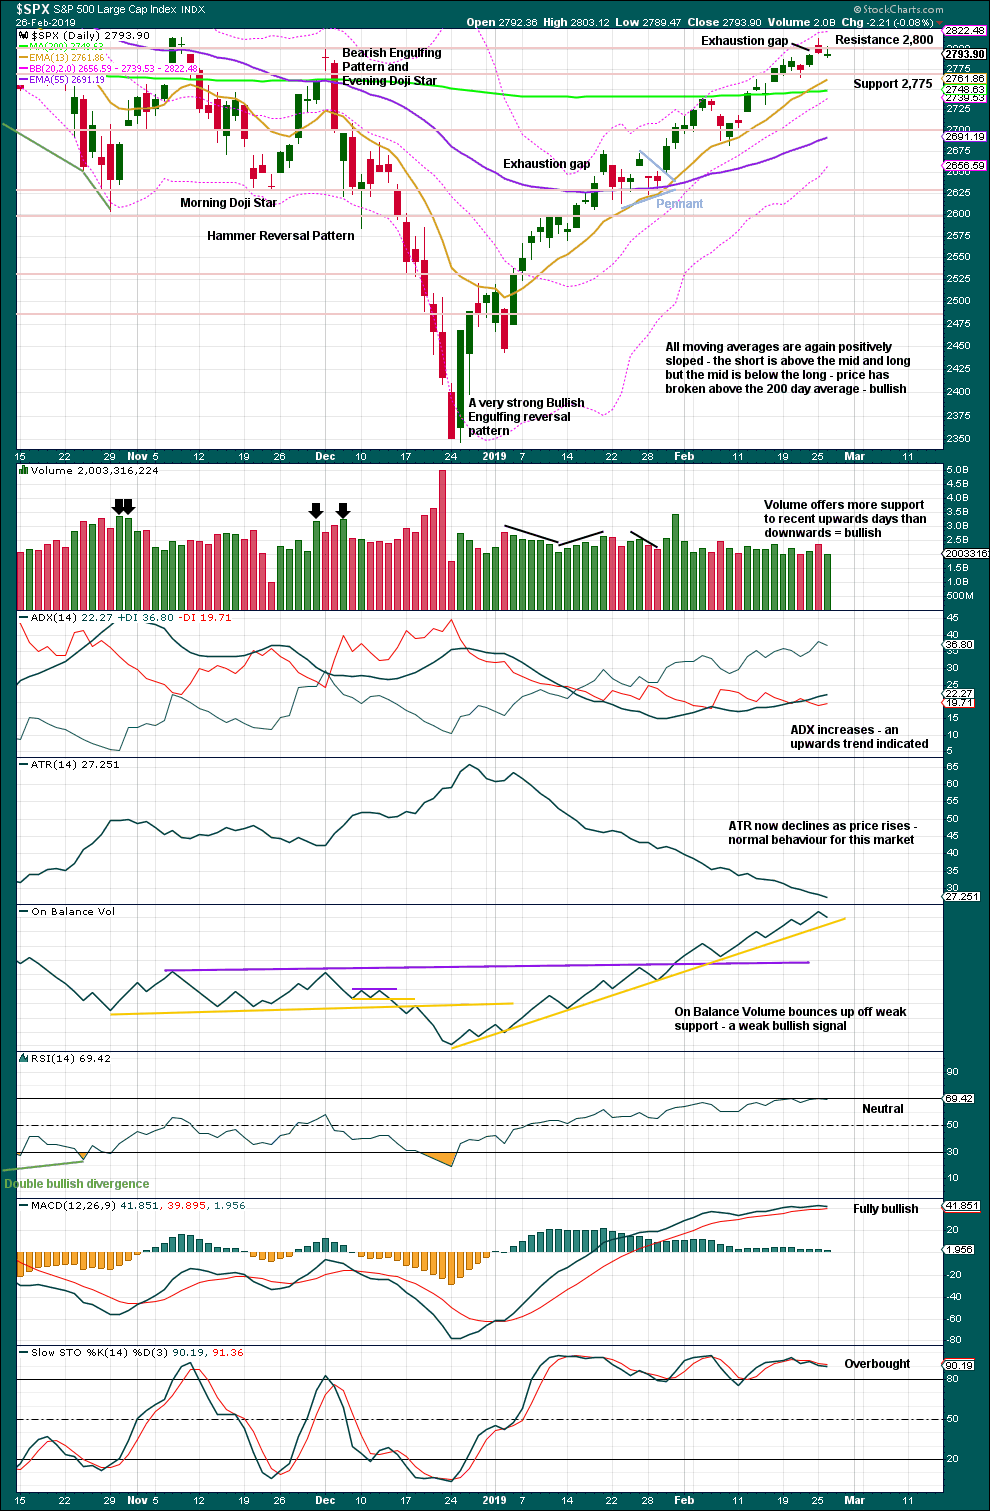
Over a fairly long period of time this ageing bull market has been characterised by upwards movement on light and declining volume and low ATR. For the short to mid term, little concern may be had if price now rises again on declining volume. Current market conditions have allowed for this during a sustained rise in price.
It is also normal for this market to have lower ATR during bullish phases, and strongly increasing ATR during bearish phases. Currently, declining ATR is normal and not of a concern.
Considering the larger picture from the Elliott wave count, some weakness approaching the end of Grand Super Cycle wave I is to be expected.
From Kirkpatrick and Dhalquist, “Technical Analysis” page 152:
“A 90% downside day occurs when on a particular day, the percentage of downside volume exceeds the total of upside and downside volume by 90% and the percentage of downside points exceeds the total of gained points and lost points by 90%. A 90% upside day occurs when both the upside volume and points gained are 90% of their respective totals”…
and “A major reversal is singled when an NPDD is followed by a 90% upside day or two 80% upside days back-to-back”.
The current situation saw two 80% downside days on December 20th and 21st, then a near 90% downside day with 88.97% downside on December 24th. This very heavy selling pressure on three sessions together may be sufficient to exhibit the pressure observed in a 90% downside day.
This has now been followed by two 90% upside days: on December 26th and again on 4th January.
The current situation looks very much like a major low has been found.
This chart is overall very bullish. Only the moving averages are not yet full bore bullish.
Price is now within a very strong zone of resistance, which sits about 2,800 to 2,815. Today the balance of volume was downwards and price moved lower with a lower low and lower high. Volume did not push price lower today, downwards movement was weak, and the market fell of its own weight.
The last gap is now closed, so it is renamed an exhaustion gap. This is bearish and may be the first warning of a deeper pullback. But equally as likely, at this stage, it may only indicate another relatively brief pullback or sideways consolidation.
BREADTH – AD LINE
WEEKLY CHART
Click chart to enlarge. Chart courtesy of StockCharts.com. So that colour blind members are included, bearish signals
will be noted with blue and bullish signals with yellow.
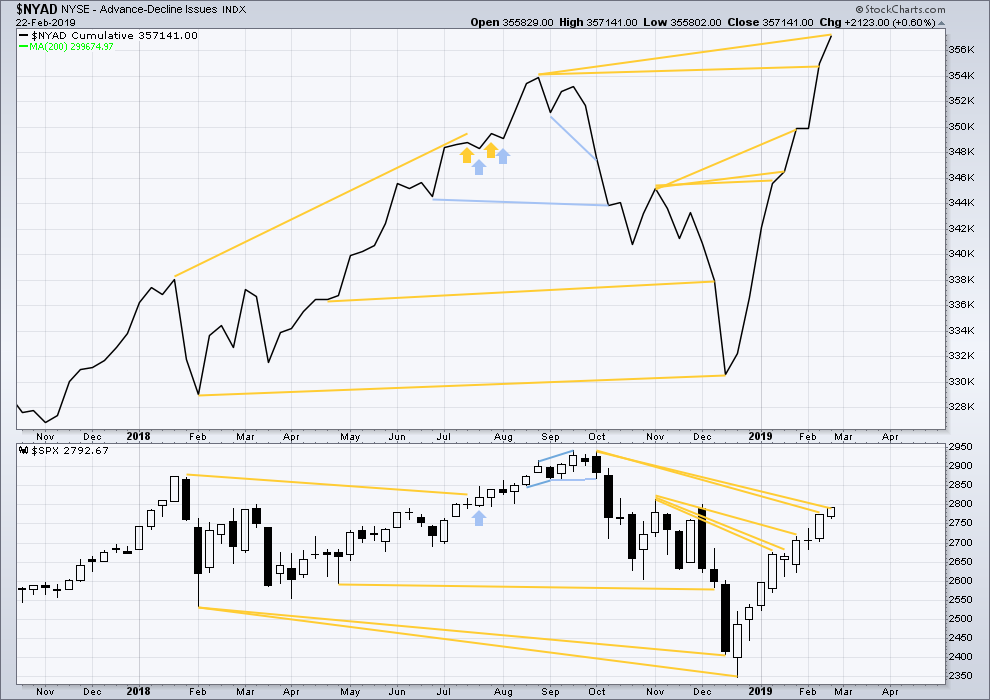
Every single bear market from the Great Depression and onwards has been preceded by a minimum of 4-6 months divergence between price and the AD line. With the AD line making a new all time high again last week, the end of this bull market and the start of a new bear market must be a minimum of 4 months away, which is mid to end June 2019 at this time.
DAILY CHART
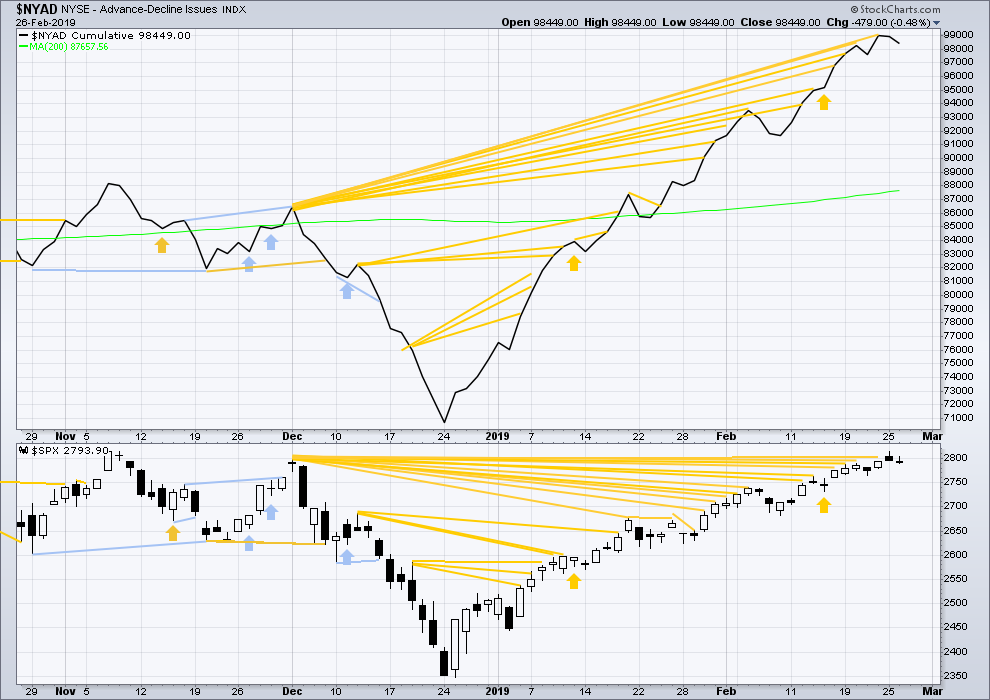
Click chart to enlarge. Chart courtesy of StockCharts.com. So that colour blind members are included, bearish signals
will be noted with blue and bullish signals with yellow.
Breadth should be read as a leading indicator.
There is now a cluster of bullish signals from the AD line. This supports the Elliott wave count.
Downwards movement today comes with a normal corresponding decline in market breadth. There is no new short-term divergence.
VOLATILITY – INVERTED VIX CHART
WEEKLY CHART
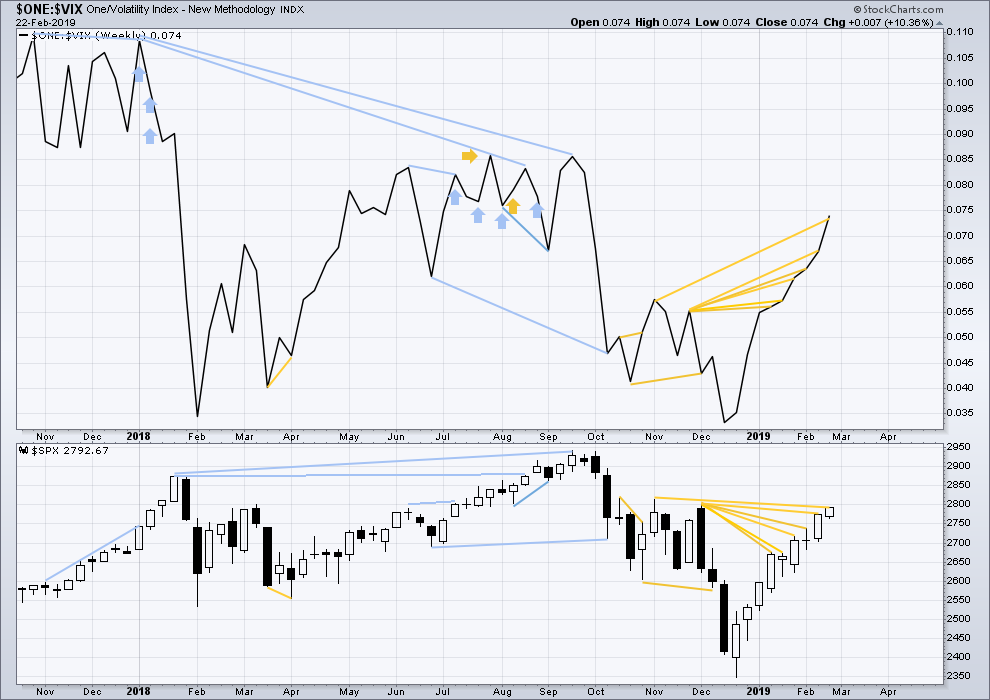
Click chart to enlarge. Chart courtesy of StockCharts.com. So that colour blind members are included, bearish signals
will be noted with blue and bullish signals with yellow.
Inverted VIX has made a new high above the prior swing high of the week beginning 5th of November 2018, but price has not. This divergence is bullish for the mid term.
DAILY CHART
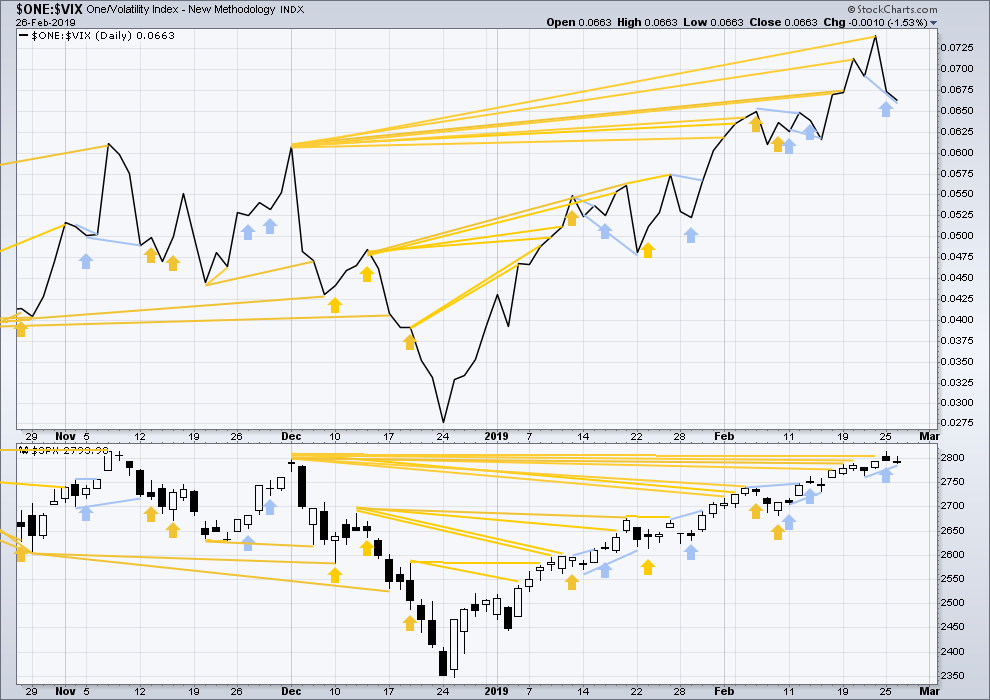
Click chart to enlarge. Chart courtesy of StockCharts.com. So that colour blind members are included, bearish signals
will be noted with blue and bullish signals with yellow.
There is now a cluster of bullish signals from inverted VIX that support the Elliott wave count.
Today inverted VIX has made a new short-term swing low below the prior low of the 21st of February, but price has not. This divergence is bearish divergence for the short term.
DOW THEORY
Dow Theory confirms a bear market. This does not necessarily mean a bear market at Grand Super Cycle degree though; Dow Theory makes no comment on Elliott wave counts. On the 25th of August 2015 Dow Theory also confirmed a bear market. The Elliott wave count sees that as part of cycle wave II. After Dow Theory confirmation of a bear market in August 2015, price went on to make new all time highs and the bull market continued.
DJIA: 23,344.52 – a close on the 19th of December at 23,284.97 confirms a bear market.
DJT: 9,806.79 – price has closed below this point on the 13th of December.
S&P500: 2,532.69 – a close on the 19th of December at 2,506.96 provides support to a bear market conclusion.
Nasdaq: 6,630.67 – a close on the 19th of December at 6,618.86 provides support to a bear market conclusion.
With all the indices moving now higher, Dow Theory would confirm a bull market if the following highs are made:
DJIA: 26,951.81
DJT: 11,623.58
S&P500: 2,940.91
Nasdaq: 8,133.30.
Published @ 06:28 p.m. EST.
—
Careful risk management protects your trading account(s).
Follow my two Golden Rules:
1. Always trade with stops.
2. Risk only 1-5% of equity on any one trade.
Downwards movement this session is unconvincing. It lacks selling pressure. So far this looks like another small pullback within an ongoing upwards trend.
I’m shifting from neutral to the bullish side of the fence now that I have end of session data.
Bullish. Target still ES 2860
The first hourly chart is invalidated.
This is the second hourly chart updated:
At this time I would rather now be neutral. The risk of primary wave 1 ending and primary wave 2 beginning at the last high is heightened. IMO it is time to be patient and await clearer information before taking a position either way.
At this time this wave count does not now have a good look in EW terms. Minute ii is too large compared to minor 2 one degree higher.
Third chart updated:
This count looks very good in EW terms. It also fits classic TA in that there is very strong resistance about 2,800 – 2,815 and so to see P1 ending there and P2 beginning would make sense.
But price remains within the black channel. We should assume the trend remains the same until proven otherwise. A breach of that channel would be proven otherwise.
For now I am going to be neutral while price remains within the channel.
I now want to see a close above resistance at 2,815 for confidence that the upwards trend remains in place, or a breach of the black channel for confidence it is over.
My hourly view. Strong fibo resistance right at the 2800 level. A turn back down underneath seems likely; a break up and through would be huge for the bull case.
Now is not a bad time to take a look at the daily action around the end of Jan/start of Feb of 2018. A mad rush up…a small consolidation drop…a day or two of sideways action…then GOOD NIGHT IRENE!!!! Not sayin’ it’s gonna repeat…just something to consider. Or the period of early Oct 2019…
Is this the start of Wave 2?
We went below the 2781
Any thoughts on that
Thank You
I don’t know.
This could be have an impulse C down. However, the action coming back up does NOT look impulsive at this point to me, giving credence to this all be early stages of a larger correction in process.
Earlier I thought it might be the start of P2, but now I can’t tell. SPX and Nasdaq failed to close the gab from yesterday, which is bearish. But we’ve had a good bounce from the lows. If today closes above 2790, it would end up being a pretty bullish day I think.
And VIX isn’t running away to the upside either. It’s wait and see time…
I agree with Kevin and Ari. We have three waves down from the high on Monday. It cannot be a 1-2-3 with the current wave up a 4 because it would have penetrated the low of 1 thus invalidating that count. So it is either an A-B-C completed or a 1-2, 1-2 just starting out Primary 2 down. We must wait and see as Ari suggests.
Scored on PANW.
I wonder if the market starts seriously tanking as Cohen starts talking….
Pullback was LONG overdue.
Big question is what degree.
A swift move of VIX back above 20 will spill the beans….
VIX bull flag.
Will the bulls “capture” it this time? 😉
Morning brother
Taking back 15 was pretty big IMO
I think it will be tested again….
If it holds …I think that will be a big signal 2 is underway
At a minimum I feel any more explosive moves up on OX should be faded
Takes a while to turn a ship around ..lol
Added some more gm shorts over 40.20 yesterday
Scalp trades
Looking to cover at 39.70 on those
Keeping my main in the drawer for a longer ride
Top O’ the mornin’!
I agree.
Lowered cost basis on my long vol positions.
SO glad I did.
Learned that nifty manouever from the great Bryan B.
jumpin’ on this one.