A small range downwards day closes as a doji. Targets remain the same. The Elliott wave count remains valid and price remains within a channel.
Summary: The first target is now at 2,767. Thereafter, if the structure of minor wave 5 is incomplete or if price keeps rising, the second target is at 2,856. The upwards trend should be assumed to continue as long as price remains above 2,731.23.
A new low below 2,731.23 would indicate a larger pullback may have begun.
The bigger picture still expects that a low may now be in place. At its end, primary wave 2 may offer a good entry opportunity to join the upwards trend.
The target is at 3,045 with a limit at 3,477.39.
New updates to this analysis are in bold.
The biggest picture, Grand Super Cycle analysis, is here.
The monthly chart was last published here.
ELLIOTT WAVE COUNT
WEEKLY CHART
This weekly chart shows all of cycle waves III, IV and V so far.
Cycle wave II fits as a time consuming double combination: flat – X – zigzag. Combinations tend to be more time consuming corrective structures than zigzags. Cycle wave IV has completed as a multiple zigzag that should be expected to be more brief than cycle wave II.
Cycle wave IV may have ended at the lower edge of the Elliott channel.
Within cycle wave V, no second wave correction may move beyond the start of its first wave below 2,346.58.
Although both cycle waves II and IV are labelled W-X-Y, they are different corrective structures. There are two broad groups of Elliott wave corrective structures: the zigzag family, which are sharp corrections, and all the rest, which are sideways corrections. Multiple zigzags belong to the zigzag family and combinations belong to the sideways family. There is perfect alternation between the possible double zigzag of cycle wave IV and the combination of cycle wave II.
Although there is gross disproportion between the duration of cycle waves II and IV, the size of cycle wave IV in terms of price makes these two corrections look like they should be labelled at the same degree. Proportion is a function of either or both of price and time.
Draw the Elliott channel about Super Cycle wave (V) with the first trend line from the end of cycle wave I (at 2,079.46 on the week beginning 30th November 2014) to the high of cycle wave III, then place a parallel copy on the low of cycle wave II. Cycle wave V may find resistance about the upper edge.
DAILY CHART
The daily chart will focus on the structure of cycle waves IV and V.
Cycle wave IV now looks like a complete double zigzag. This provides perfect alternation with the combination of cycle wave II. Double zigzags are fairly common corrective structures.
Within Super Cycle wave (V), cycle wave III may not be the shortest actionary wave. Because cycle wave III is shorter than cycle wave I, this limits cycle wave V to no longer than equality in length with cycle wave III at 3,477.39. A target is calculated for cycle wave V to end prior to this point.
Cycle wave V must subdivide as a five wave motive structure, either an impulse or an ending diagonal. An impulse is much more common and that will be how it is labelled. A diagonal would be considered if overlapping suggests it.
Primary wave 1 is labelled as incomplete.
Primary wave 2 may not move beyond the start of primary wave 1 below 2,346.58.
HOURLY CHART
If intermediate wave (5) is under way, then within it minor waves 1 through to 3 may be complete.
With this labelling of intermediate wave (5), there is a very close Fibonacci ratio between minor waves 3 and 1. Minor wave 3 shows stronger momentum than minor wave 1.
Minor wave 2 fits as a zigzag. Minor wave 4 fits as a complete double combination: flat – X – zigzag.
A new target is calculated using the most common Fibonacci ratio between minor waves 5 and 1. If the first target is met and either the structure of minor wave 5 is incomplete or price keeps rising, then the second target may be used.
The channel is redrawn using Elliott’s second technique: the first trend line from the ends of minor waves 2 to 4, then a parallel copy on the end of minor wave 3. The trend channel may show where minor wave 5 ends; it may find resistance about the upper edge of the channel, or it may end about mid way within the channel.
Within minor wave 5, minute wave ii may not move beyond the start of minute wave i below 2,731.23.
ALTERNATE DAILY CHART
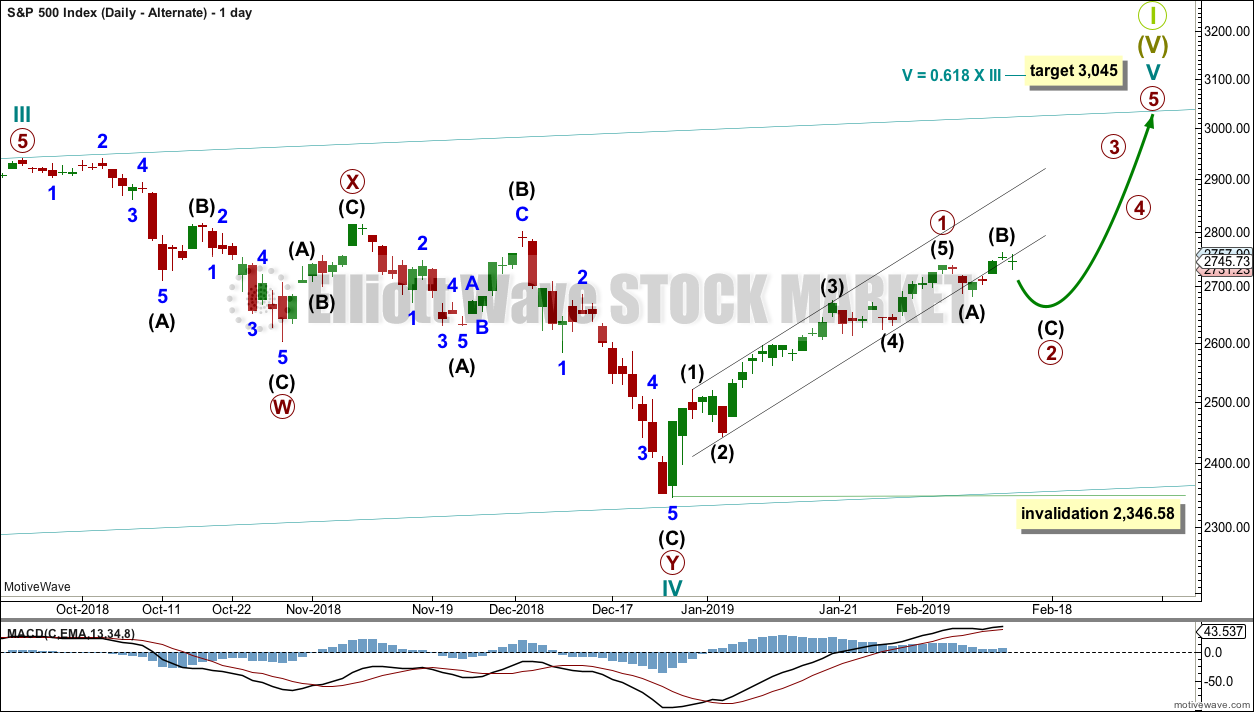
This alternate wave count should only be used if price makes a new low below 2,718.05 in the short term.
It is still possible that primary wave 1 was over at the last high and primary wave 2 may be continuing sideways as an expanded flat correction.
However, the new high on the 12th of February comes with some support from volume. This does not look like intermediate wave (B). Intermediate wave (B) should exhibit weakness.
The target for intermediate wave (C) would be at 2,669 where intermediate wave (C) would reach 1.618 the length of intermediate wave (A).
Primary wave 2 may not move beyond the start of primary wave 1 below 2,346.58.
TECHNICAL ANALYSIS
WEEKLY CHART

Click chart to enlarge. Chart courtesy of et=”_blank”>StockCharts.com.
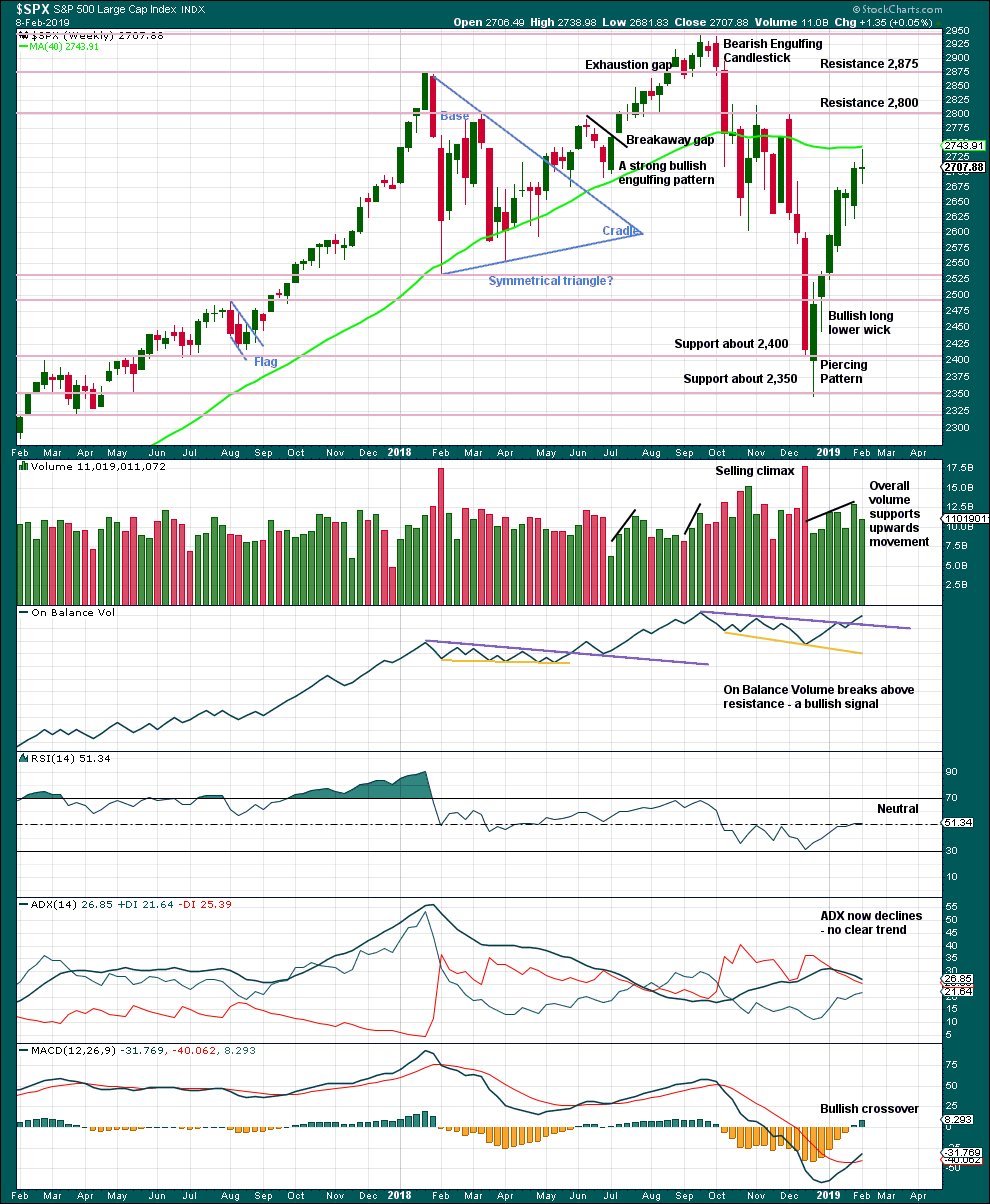
From the all time high to the low at the end of December 2018, price moved lower by 20.2% of market value meeting the definition for a bear market.
It should be noted that the large fall in price from May 2011 to October 2011 also met this definition of a bear market, yet it was only a very large pullback within a bull market, which so far has lasted almost 10 years.
Overall, volume supports upwards movement. There is plenty of room for price to rise further.
Last week the long legged doji candlestick puts the trend for now from up to neutral. Risk of a pullback is heightened.
DAILY CHART

Click chart to enlarge. Chart courtesy of StockCharts.com.
Over a fairly long period of time this ageing bull market has been characterised by upwards movement on light and declining volume and low ATR. For the short to mid term, little concern may be had if price now rises again on declining volume. Current market conditions have allowed for this during a sustained rise in price.
It is also normal for this market to have lower ATR during bullish phases, and strongly increasing ATR during bearish phases. Currently, declining ATR is normal and not of a concern.
Considering the larger picture from the Elliott wave count, some weakness approaching the end of Grand Super Cycle wave I is to be expected.
From Kirkpatrick and Dhalquist, “Technical Analysis” page 152:
“A 90% downside day occurs when on a particular day, the percentage of downside volume exceeds the total of upside and downside volume by 90% and the percentage of downside points exceeds the total of gained points and lost points by 90%. A 90% upside day occurs when both the upside volume and points gained are 90% of their respective totals”…
and “A major reversal is singled when an NPDD is followed by a 90% upside day or two 80% upside days back-to-back”.
The current situation saw two 80% downside days on December 20th and 21st, then a near 90% downside day with 88.97% downside on December 24th. This very heavy selling pressure on three sessions together may be sufficient to exhibit the pressure observed in a 90% downside day.
This has now been followed by two 90% upside days: on December 26th and again on 4th January.
The current situation looks very much like a major low has been found.
Price now has closed above the 200 day moving average, on an upwards day with some support from volume. This looks like a classic upwards breakout from a small pullback within an ongoing upwards trend.
This trend is nearing an end for the short to mid term though. The number of stocks trading above their 10 day moving averages is declining while price is rising. This divergence is bearish and suggests developing weakness. This fits the Elliott wave count, and this is normal behaviour for a fifth wave. It is not particularly useful however in identifying a high in place; it is only a warning of an approaching high.
BREADTH – AD LINE
WEEKLY CHART

Click chart to enlarge. Chart courtesy of StockCharts.com. So that colour blind members are included, bearish signals
will be noted with blue and bullish signals with yellow.
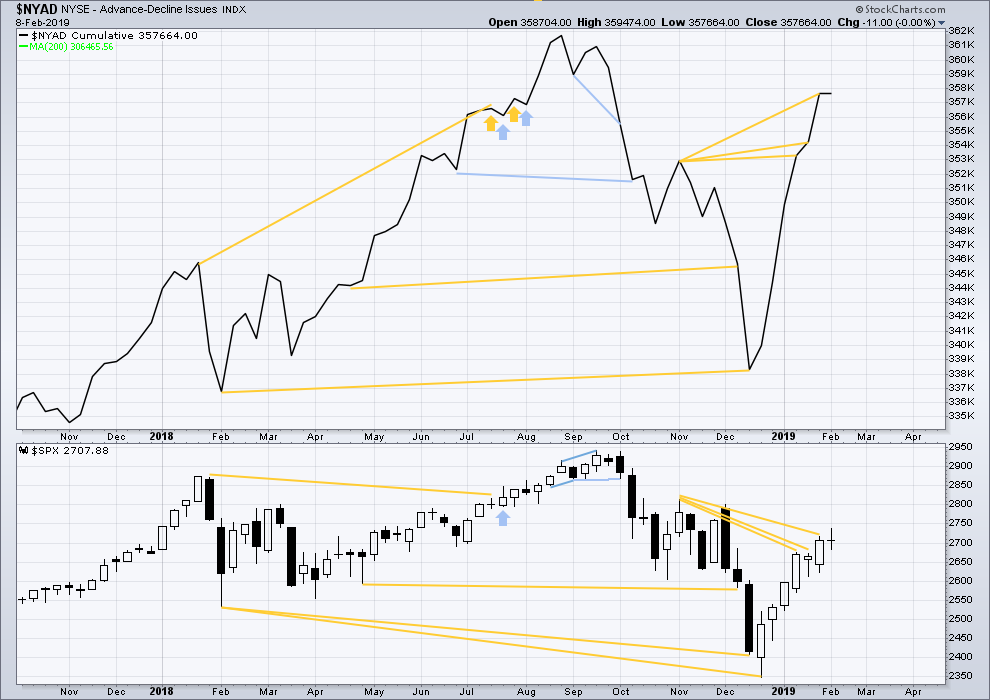
The AD line has made yet another new high above the prior swing high of the week beginning 5th of November 2018, but price has not. This divergence is bullish for the mid term.
Last week price moved mostly sideways and the AD line is flat. This is considered to exhibit no divergence.
DAILY CHART

Click chart to enlarge. Chart courtesy of StockCharts.com. So that colour blind members are included, bearish signals
will be noted with blue and bullish signals with yellow.
Breadth should be read as a leading indicator.
There is now a cluster of bullish signals from the AD line. This supports the Elliott wave count.
Today price moved slightly lower, but the AD line has moved higher. This divergence is bullish for the short term.
VOLATILITY – INVERTED VIX CHART
WEEKLY CHART

Click chart to enlarge. Chart courtesy of StockCharts.com. So that colour blind members are included, bearish signals
will be noted with blue and bullish signals with yellow.
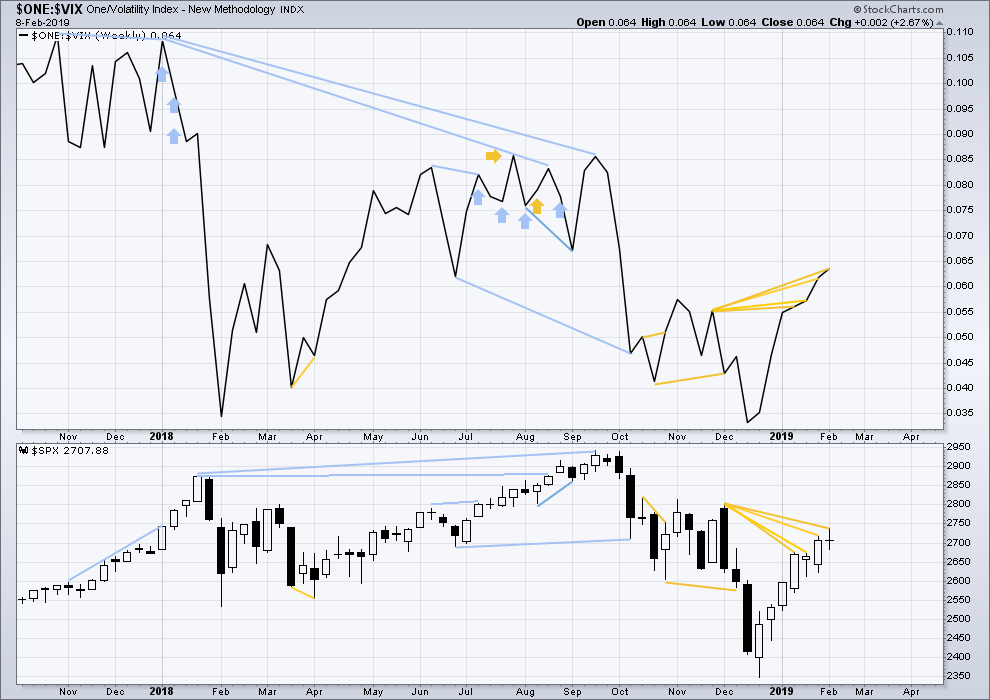
Inverted VIX has made another new high above the prior swing high of the weeks beginning 26th of November and 3rd of December 2018, but price has not. This divergence is bullish for the mid term.
DAILY CHART

Click chart to enlarge. Chart courtesy of StockCharts.com. So that colour blind members are included, bearish signals
will be noted with blue and bullish signals with yellow.
There may now be a small cluster of short-term bearish signals developing from inverted VIX. This may be indicating an end coming to primary wave 1.
Today inverted VIX has made a new low below the low of 11th of February, but price has not. This divergence is bearish for the short term.
DOW THEORY
Dow Theory confirms a bear market. This does not necessarily mean a bear market at Grand Super Cycle degree though; Dow Theory makes no comment on Elliott wave counts. On the 25th of August 2015 Dow Theory also confirmed a bear market. The Elliott wave count sees that as part of cycle wave II. After Dow Theory confirmation of a bear market in August 2015, price went on to make new all time highs and the bull market continued.
DJIA: 23,344.52 – a close on the 19th of December at 23,284.97 confirms a bear market.
DJT: 9,806.79 – price has closed below this point on the 13th of December.
S&P500: 2,532.69 – a close on the 19th of December at 2,506.96 provides support to a bear market conclusion.
Nasdaq: 6,630.67 – a close on the 19th of December at 6,618.86 provides support to a bear market conclusion.
With all the indices moving now higher, Dow Theory would confirm a bull market if the following highs are made:
DJIA: 26,951.81
DJT: 11,623.58
S&P500: 2,940.91
Nasdaq: 8,133.30
Published @ 09:00 p.m. EST.
—
Careful risk management protects your trading account(s).
Follow my two Golden Rules:
1. Always trade with stops.
2. Risk only 1-5% of equity on any one trade.


FB to the long side is setting up. Weekly trend has moved to neutral, there’s been a bounce down from the 50% retrace level, thhat’s to the 38% which is also 38% retrace of the late Jan low to recent high. Hourly trend is still down, but the 5 minute is strong up and is breaking recent swing highs. the 161 level is a logical extremely low risk stop point.
Hourly chart updated:
The first target is removed. That price point was met (and slightly exceeded) and the structure is not complete.
Back to just the second target.
The invalidation point is moved higher. If minute iv continues it may not move into minute i price territory.
RUT’s march upward is relentless yet again today. Way stronger than NDX and SPX. Next up: the pivot high at 1586.
It’s crazy
Running with the bulls
Was able to close out my 355 nflx calls for a couple bucks
Average price was about $4 going into day
That didn’t look possible beginning of day
Rolled the $2 to the 365-375 calls for next week to finish the trade
Took a little loss of .30 on my put spread
I’m going to be short spy at an average price of 276.60 on Monday
And long vxxb at a price of 33.10
What a stampede of bulls
Wow….
Someone definitely wants this market higher
Playing short term time frames is not the way to go anymore
Without question
Almost there. Possible ED fifth wave target of about 2807.95 (maximum)
You can cushion draw-down on your short position with a hedging bull put spread the next session or two!
Not too many bears left…just the way I like it…! 🙂
Hey brother
Today and the last couple weeks with the way they have crushed the vix and vix futures… felt like a conditioning to get everyone off that trade…
Or… the powers that Be want this market higher and will just sell vix as much as they want…
It really feels like the fed is back in the market again.. or the commercial bank proxies doing open market operations again
No mark to market on anything ..
Just unlimited pockets and trade as you please with algos trading fractional pennies and driving price to whatever point they want….
You pointed out several good set ups the last week or so Verne
I was looking at them the same way…
And they were all crushed … watching it has been disheartening …
We don’t have real markets anymore
The directions are chosen for us … when everyone’s cards can be seen by the house…
I still believe in the Golden ratios ..
and it felt like bear capitulation today and last week
I was going to hedage a little…
But it’s a first leg in on these trades
I’ll be selling 279-281 call spreads a couple weeks out in timeframe when and if we hit 2790
I’ll do 1×2 ratio put and call spreads respectively on my new spy shorts and vxxb longs.. again.. a couple weeks out at the same time frames
Buy a 278… sell 2 276 in proportion to my position
So if it hits 276… I’ll have extra leverage on the cover
Will be doing the same with vxxb at the 32.50 and 34 call strikes
They usually cost near nothing and again gives the extra leverage when price equalizes
When and if vxxb approaches 32 next week
Will also be selling large 32-30 put spreads for a couple weeks to go if I can get at least a .75 cent premium
Yes indeed. They are running any and all stops with reckless abandon.
They also believe in the Golden ratio and have programmed their algos to precisely run them…but we already figured that out.
The vol suppression has been absolutely incredible, but if you look closely, you can see a few folk continue to accumulate. They want as few bears as possible positioned for the upcoming turn so we in anticipation went with late March expirations. Rough few weeks for the bears, no doubt! I converted quite a few puts to bull put credit spreads and rolled strikes up to trade the persistent uptrend along with a few long calls. Crazy week, but what goes up…well, you know…! 🙂
Kevin. Still looking to short cron ?
Watching it, not shorting yet/now. The Feb pullback may very well have been a 4 wave, and a 5 to new highs may be in progress now. If you made me trade it today I’d buy it, not short it. But I won’t do that either, lol!
MCD (daily here) has turned back up on the daily, is in an uptrend, and appears likely to head to the upper volatility band (purple). Maybe it’s a D wave of a triangle, I don’t know. I got long yesterday, and may add.
This is hourly /ES (futures) data with overnight session data included. Up to the minute, 10:51pm ET.
This chart suggests the alternate daily to me, or a revised count wherein the high on this chart is the completion of the 5 wave intermediate 5 up. Of course those two are hugely different: the former only calls for a minor 4 to complete here (might be done if the minor 4 is a flat, which appears just about complete on this chart, but I’m guessing zig-zag with more downward motion tonight/tomorrow). The latter says price is now starting the primary 2 back down…
But what this chart line up with for me is the main hourly. And indeed overnight price is getting very close to the invalidation at 2731.
No clarity, but the action tomorrow may tell us a lot about the next week or two.
No clarity yet. ES can often meander aimlessly through the night on vanishingly low volume. But this swing down seems to be a bit more purposeful… if it holds.
And it sure…didn’t!!! Lol! No invalidation since the price was undercut only in the over night session as well. So…the main lives for now.
Thanks Kevin
I noticed the vix futures overnight as well
And the vix has been rumbling the last week….
Not to say it can’t be crushed further… but there are over 4 weeks to go on March futures and there was a lot of pressing going on the past week to extend further downside and the March futures have so far held up
Yesterday was very high volume in VXXB
And they were pushing that thing down hard all day with massive 33 put volume
And it just wouldn’t compress further
Lots of selling at beginning and end of day in Spy as well… the spike back to green was more a levitation along with the early afternoon flat line…but the volume was pushing down end of day …
Remember when the markets were pushing down in December
There was a lot of damage done on weekly option expiration days where puts turned too gold on large one day sells
So picking up cheap puts with a few hours to go that aren’t that far from the money (less than 1%… May be worth a few lottery tickets during this window
1st of all you lovers out there on Valentines day!