
Last analysis expected more downwards movement. The target at 2,354 was met and slightly exceeded.
A new wave count is published for members today. The short and mid-term expectation is mostly the same, but this wave count has a better look at the monthly chart level.
Summary: It does not look like a low is in place yet. Expect price to continue falling.
The short-term target for a multi-day to multi-week interruption to the downwards trend is now 2,318.
The target for this large pullback to end is now at either 2,269 or 2,242.
Overall, this strong downwards movement is still expected to be a large correction within an ongoing bull market, which needs one final all time high next year.
New updates to this analysis are in bold.
The biggest picture, Grand Super Cycle analysis, is here.
The monthly chart will be reviewed again today.
MAIN ELLIOTT WAVE COUNT
MONTHLY CHART
Click chart to enlarge.
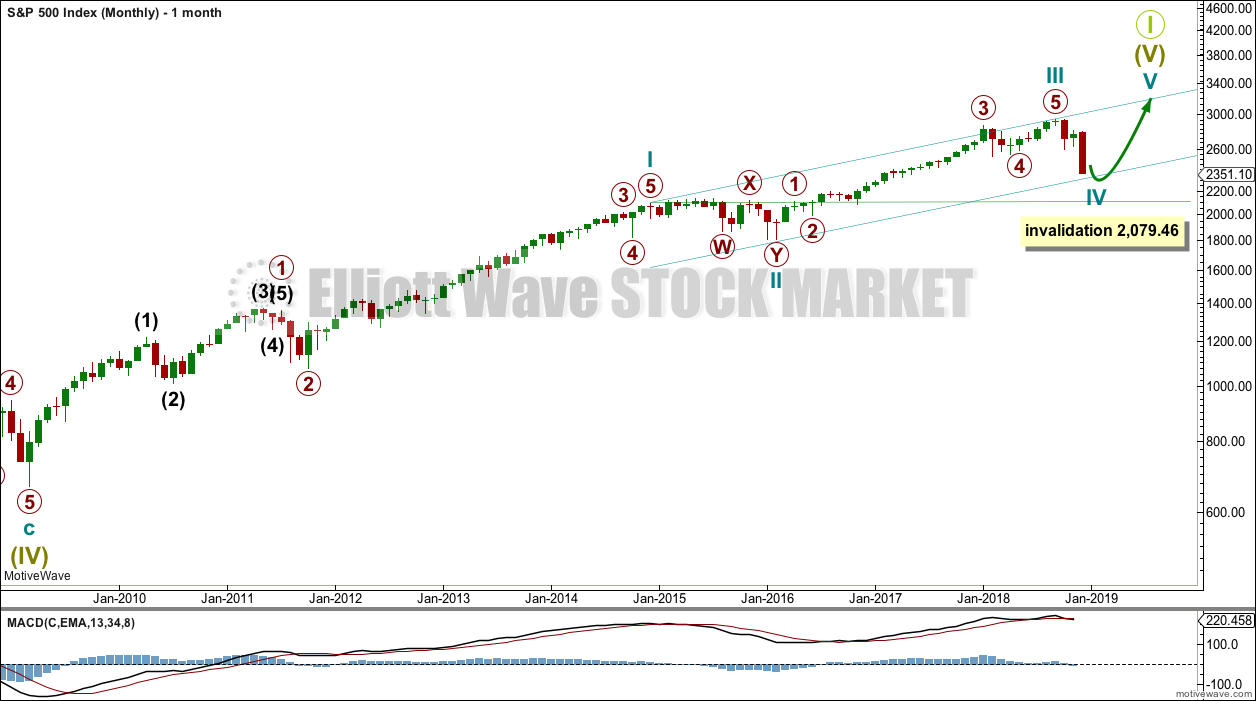
Super Cycle wave (IV) completed a 8.5 year correction. Thereafter, a bull market began for Super Cycle wave (V). The structure of Super Cycle wave (V) is incomplete. It is subdividing as an impulse.
Labelling within Super Cycle wave (V) is now changed. This labelling fits with MACD. Super Cycle wave (V) is still seen as a five wave impulse, and now cycle wave III within it has strongest momentum.
There is still no Fibonacci ratio between cycle waves I and III within Super Cycle wave (V). When cycle wave IV may be complete, then a final target may be calculated at cycle degree. This cannot be done yet. Cycle wave V will be limited to no longer than equality with cycle wave III at 1,130.81 points, so that cycle wave III is not the shortest actionary wave.
A channel is drawn about the impulse of Super Cycle wave (V) using Elliott’s first technique. Cycle wave IV may find support about the lower edge. However, fourth waves are not always contained within a channel drawn using this technique, which is why Elliott developed a second technique. If this channel is breached by downwards movement, then the channel may be redrawn using Elliott’s second technique when cycle wave IV is complete.
There is perfect alternation between a shallow time consuming combination for cycle wave II and now a deeper and most likely more brief zigzag for cycle wave IV. There is excellent proportion so far; cycle wave II was more time consuming, but the speed and depth of cycle wave IV makes these two corrections look like they should be labelled the same degree. This wave count has the right look.
Cycle wave IV may not move into cycle wave I price territory below 2,079.46.
WEEKLY CHART
Click chart to enlarge.
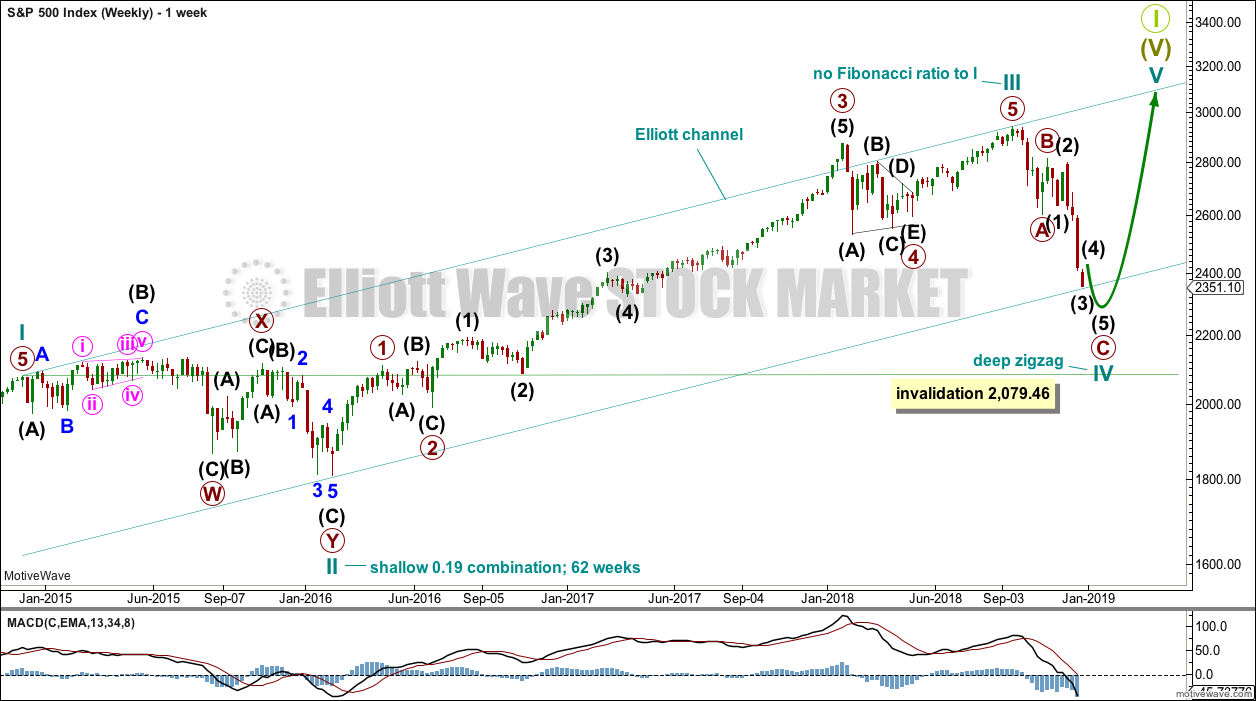
This weekly chart shows all of cycle waves II, III and IV so far.
Cycle wave II fits as a time consuming double combination: flat – X – zigzag. Combinations tend to be more time consuming corrective structures than zigzags. If cycle wave IV completes as a zigzag, then it should be expected to be more brief than cycle wave II.
Cycle wave IV is now almost at the lower edge of the Elliott channel. It looks like it may breach this channel. That would be acceptable because fourth waves are not always contained within Elliott channels.
Cycle wave IV may not move into cycle wave I price territory below 2,079.46.
DAILY CHART
Click chart to enlarge.
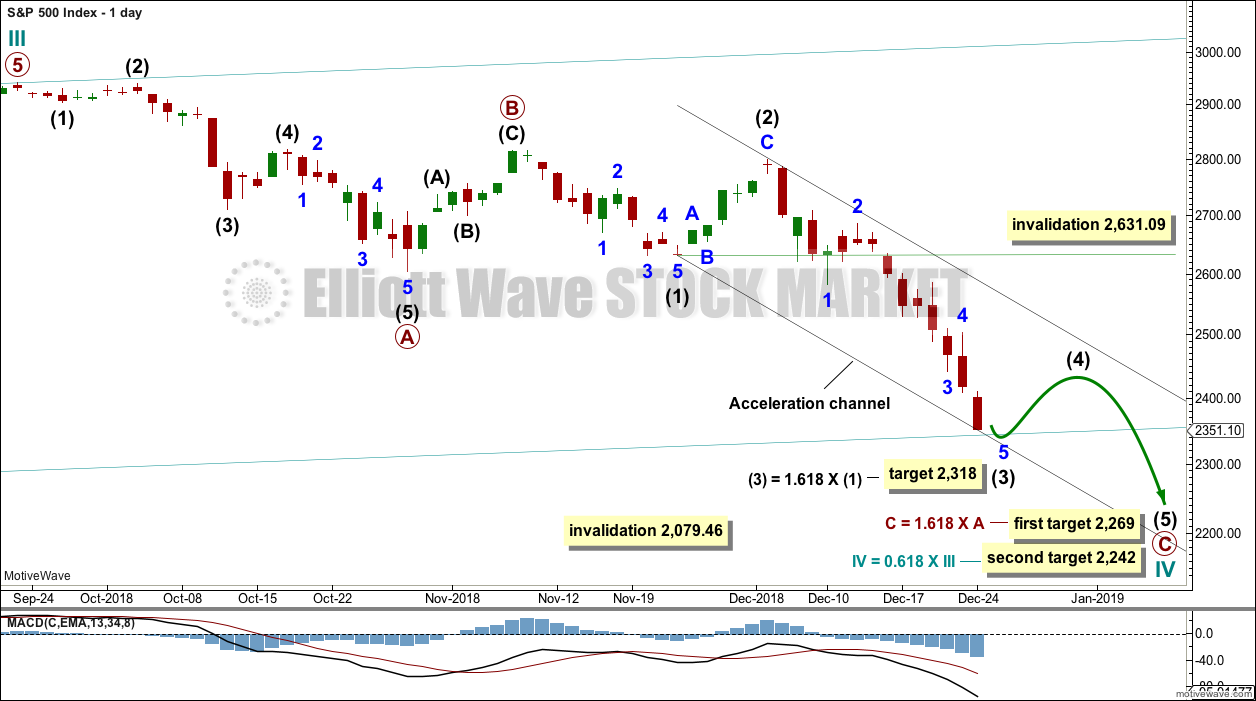
The daily chart will focus on the structure of cycle wave IV.
So far cycle wave IV looks like it may be subdividing as a zigzag. This would provide perfect alternation with the combination of cycle wave II. Zigzags are the most common corrective structures.
Within this zigzag, primary wave C may be completing as a five wave impulse.
A target is calculated for intermediate wave (3) to end using the most common Fibonacci ratio to intermediate wave (1).
Intermediate wave (2) shows up on the weekly and daily charts. It would be likely that intermediate wave (4) may also show on weekly and daily charts for this wave count to have the right look. Intermediate wave (2) was a deep zigzag lasting six sessions. Given the guideline of alternation intermediate wave (4) may be expected to be a flat, triangle or combination; it would be least likely to be a zigzag.
Intermediate wave (4) may not move into intermediate wave (1) price territory above 2,631.09.
Two targets are calculated for cycle wave IV to end. If price gets to the first target and the structure is incomplete, or if price falls through the first target, then the second target may be used.
When intermediate wave (4) may be complete, then the target may be calculated also at intermediate wave degree. The target may change at that stage.
Keep drawing an acceleration channel about primary wave C. Draw the first trend line from the low of intermediate wave (1) to the latest low, then place a parallel copy on the high of intermediate wave (2). Keep redrawing the channel as price keeps falling. When intermediate wave (3) may be complete, then intermediate wave (4) may find resistance about the upper edge of the channel.
HOURLY CHART
Click chart to enlarge.
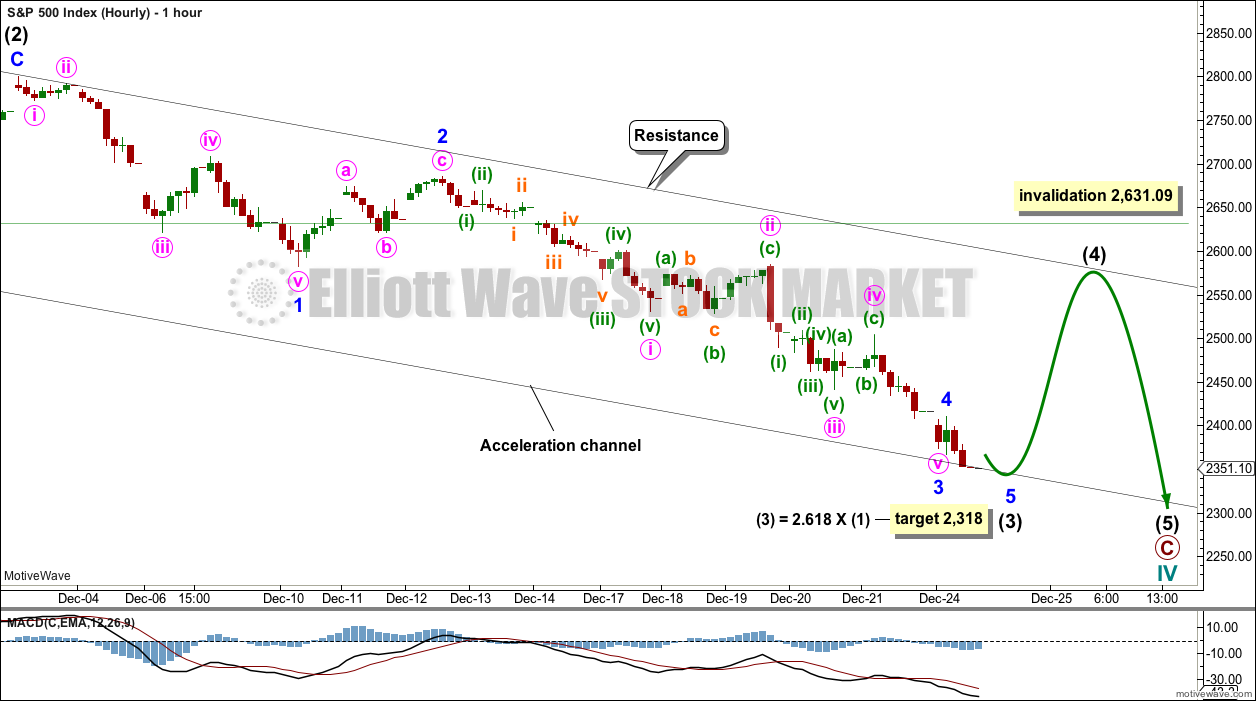
The hourly chart focusses on all of intermediate wave (3). The structure looks incomplete.
When intermediate wave (3) is complete, then intermediate wave (4) may unfold over one to a few weeks. It may be a shallow sideways consolidation.
TECHNICAL ANALYSIS
MONTHLY CHART
Click chart to enlarge. Chart courtesy of et=”_blank”>StockCharts.com.
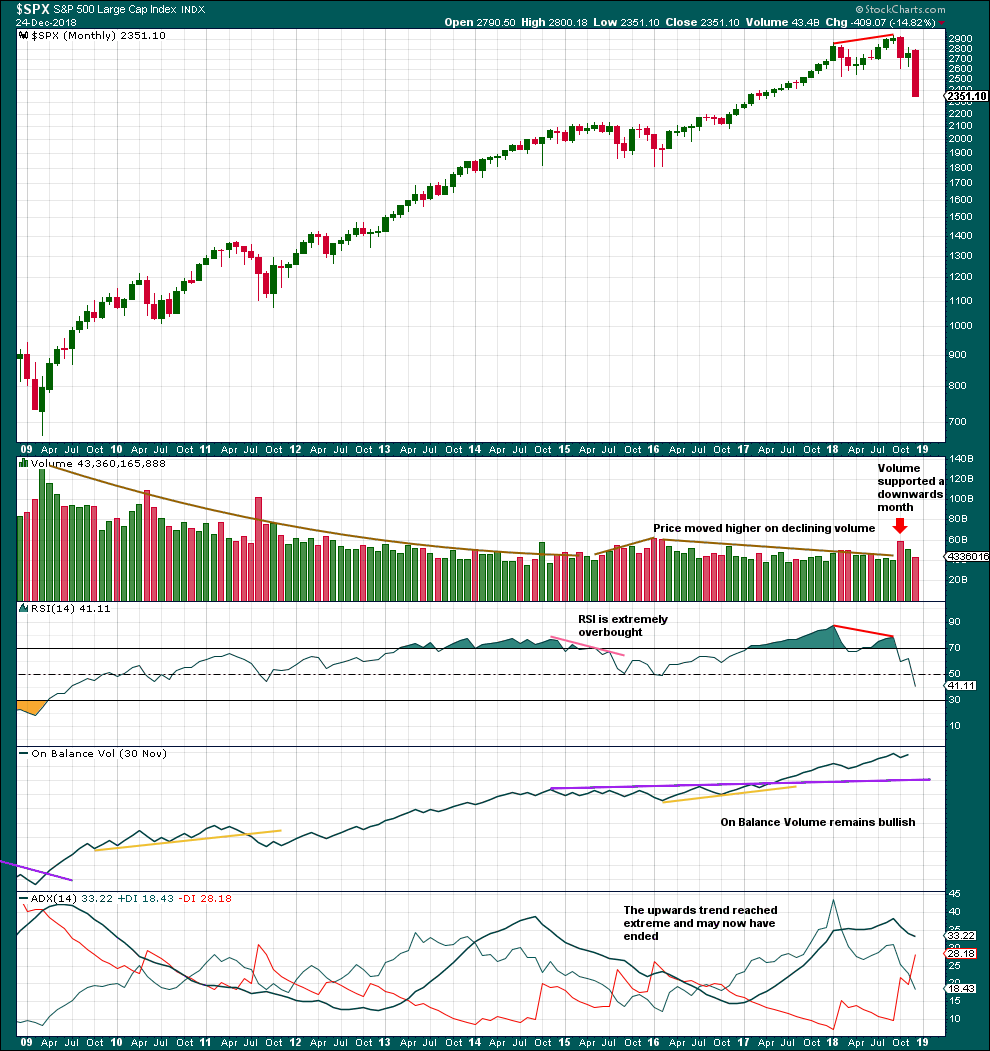
The month of October completed a strong Bearish Engulfing candlestick reversal pattern.
There are two other Bearish Engulfing patterns on this chart: May 2010 and August 2015. Both were followed by more downwards movement that ended between 2 – 5 months later. Both indicated a large correction within the ongoing bull market.
The Bearish Engulfing pattern for October 2018 may indicate another large correction, or it may indicate a change from a long bull market to a fully fledged bear market. It is not possible from candlestick reversal patterns alone to discern which situation may unfold.
WEEKLY CHART
Click chart to enlarge. Chart courtesy of et=”_blank”>StockCharts.com.
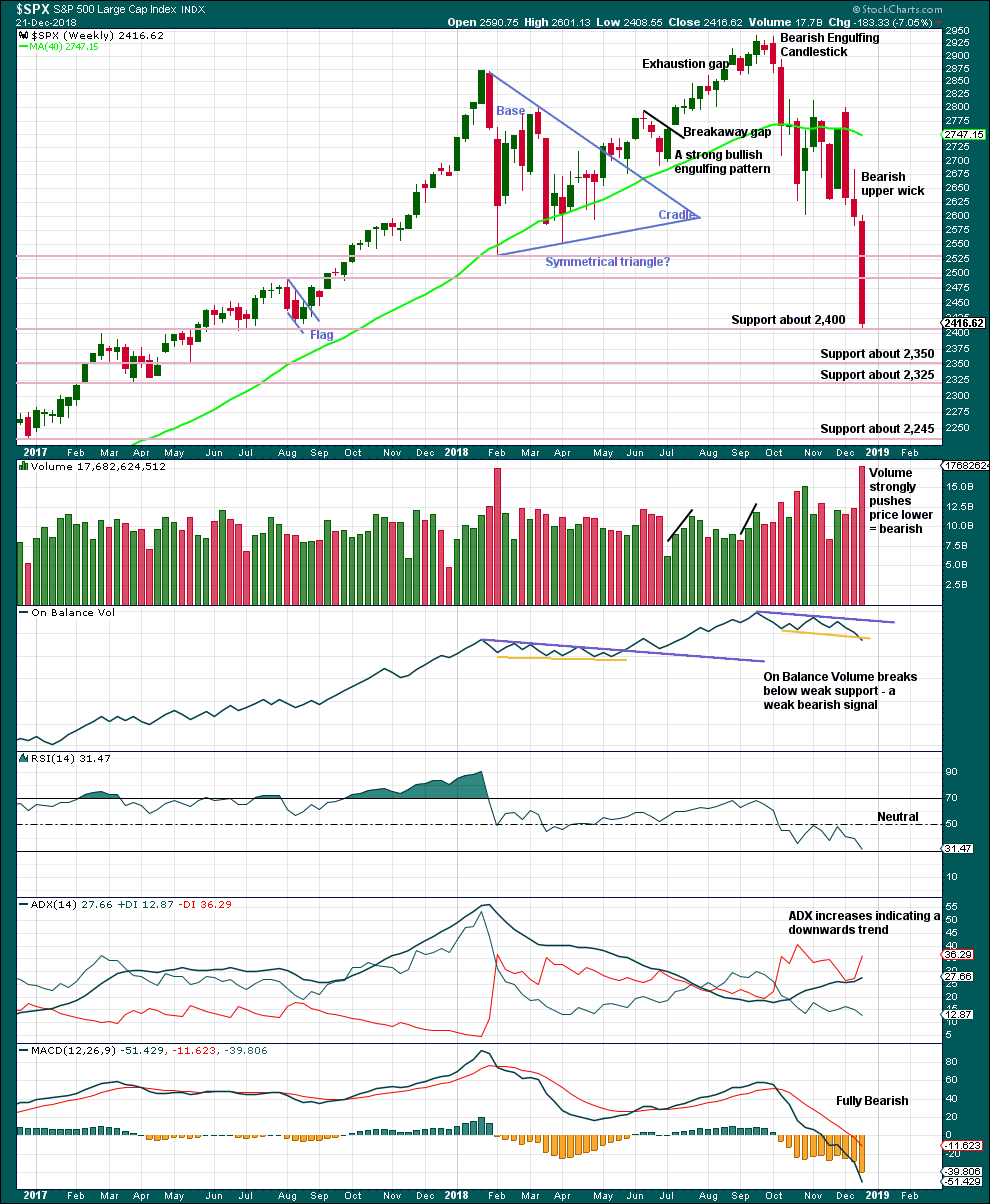
Price has fallen so far 18% from the last all time high.
The last weekly candlestick is very strong indeed. With price closing very close to the low for the week, it looks like more downwards movement may follow this week.
Support lines are identified now on the weekly chart.
This chart is fully bearish.
DAILY CHART
Click chart to enlarge. Chart courtesy of StockCharts.com.
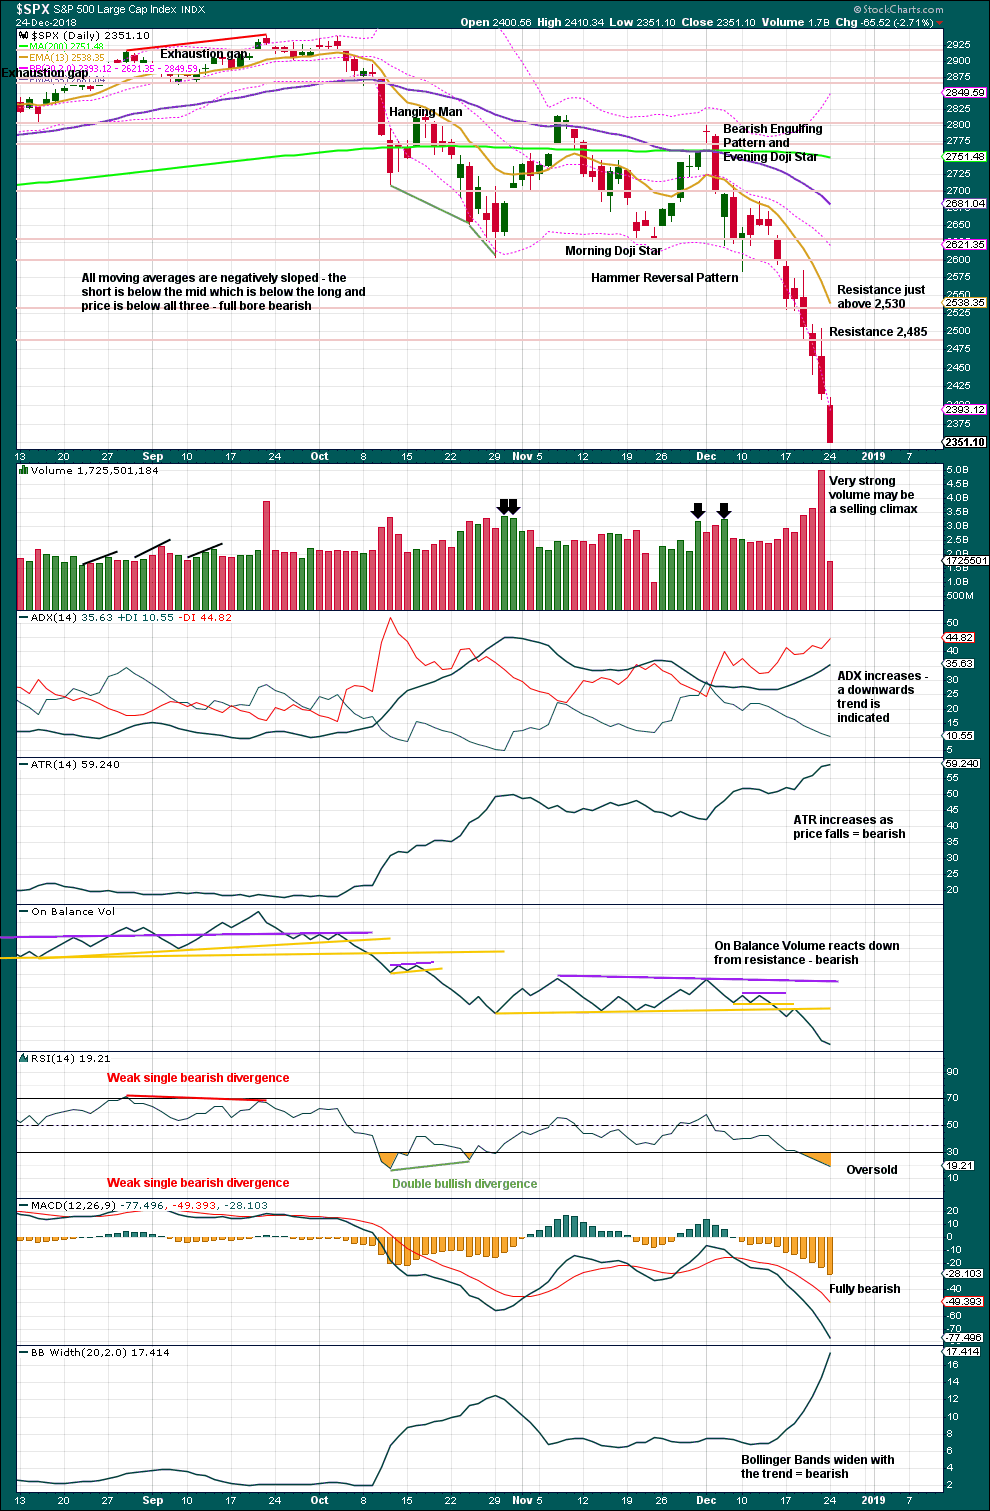
Selling climaxes usually occur close to lows, not at final lows.
Look for a candlestick reversal pattern and / or clear and strong divergence between price and RSI to indicate a potential low. That is still not the case today.
This chart remains fully bearish. With price closing at the low for Monday, expect price to keep falling when markets open after Christmas.
BREADTH – AD LINE
WEEKLY CHART
Click chart to enlarge. Chart courtesy of StockCharts.com. So that colour blind members are included, bearish signals
will be noted with blue and bullish signals with yellow.
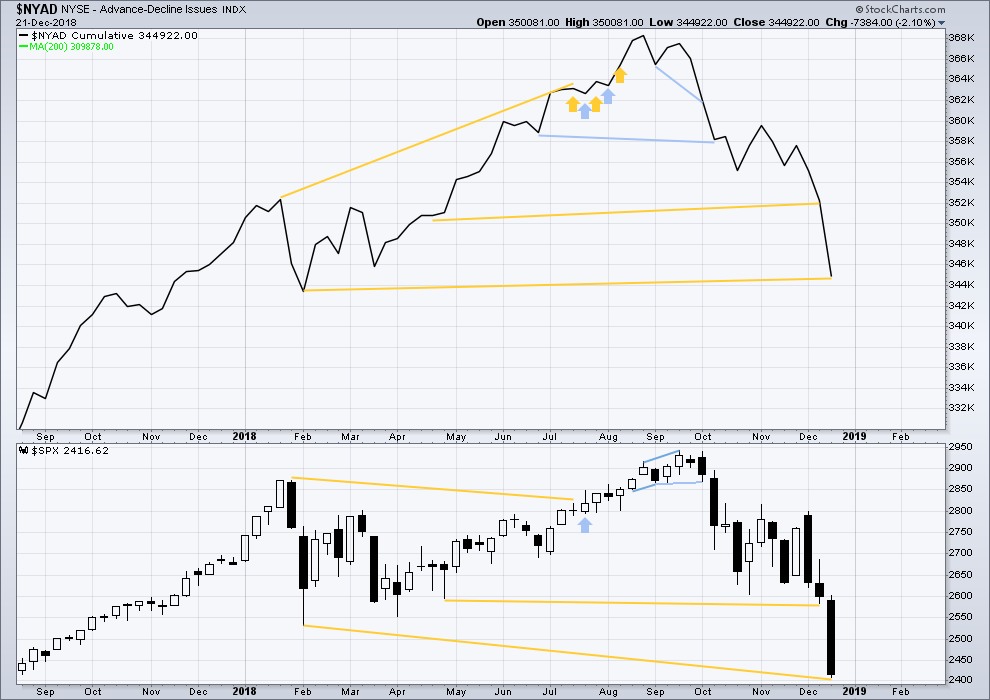
While price is falling fast, the AD line is not making corresponding new lows. There remains mid-term bullish divergence between price and market breadth.
DAILY CHART
Click chart to enlarge. Chart courtesy of StockCharts.com. So that colour blind members are included, bearish signals
will be noted with blue and bullish signals with yellow.
Breadth should be read as a leading indicator.
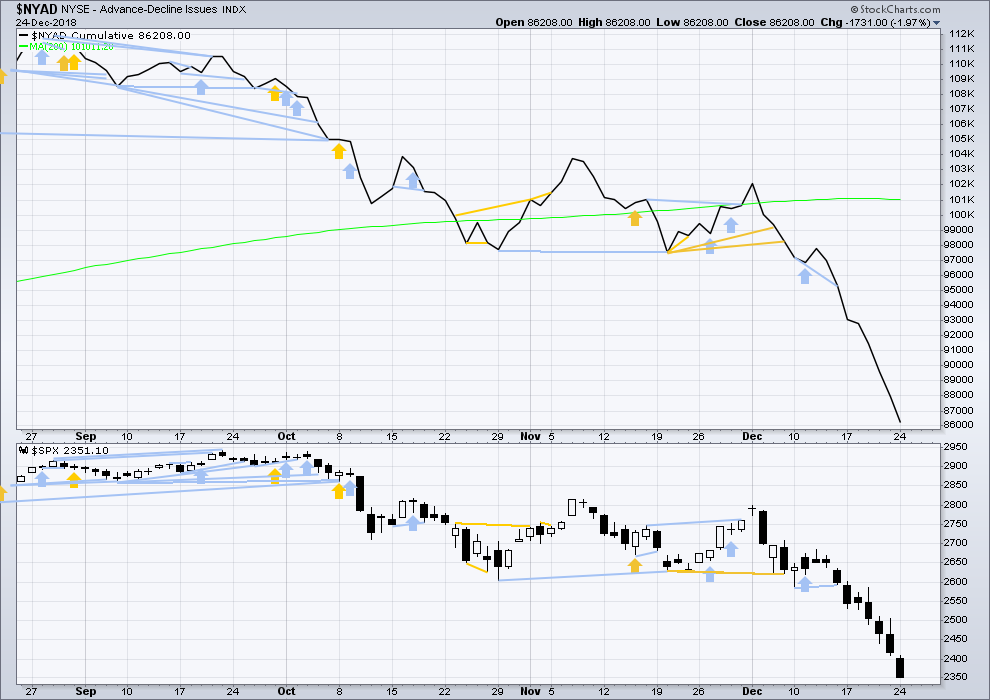
For December 24th both price and the AD line have again made new lows. There is no divergence.
SUPPLEMENTAL – AD LINE RECENT HISTORY
This exercise looks at how the AD line behaves prior to a fully fledged bear market and compares that to how it behaves prior to a large pullback within a bull market.
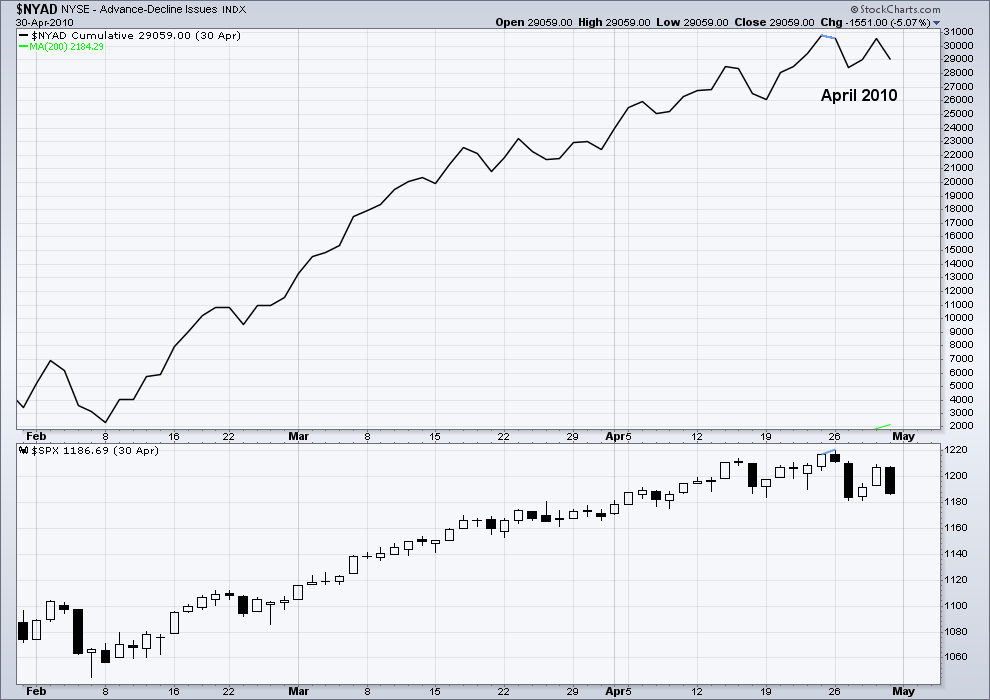
There have been three major pullbacks within the current bull market beginning March 2009:
Click chart to enlarge. Chart courtesy of StockCharts.com. So that colour blind members are included, bearish signals
will be noted with blue and bullish signals with yellow.
The first major pullback from 26th April 2010 to 1st July 2010 saw price fall 17% of market value over 47 sessions.
There was only one day of bearish divergence between price and the AD line at the high on 26th April 2010.
Click chart to enlarge. Chart courtesy of StockCharts.com. So that colour blind members are included, bearish signals
will be noted with blue and bullish signals with yellow.
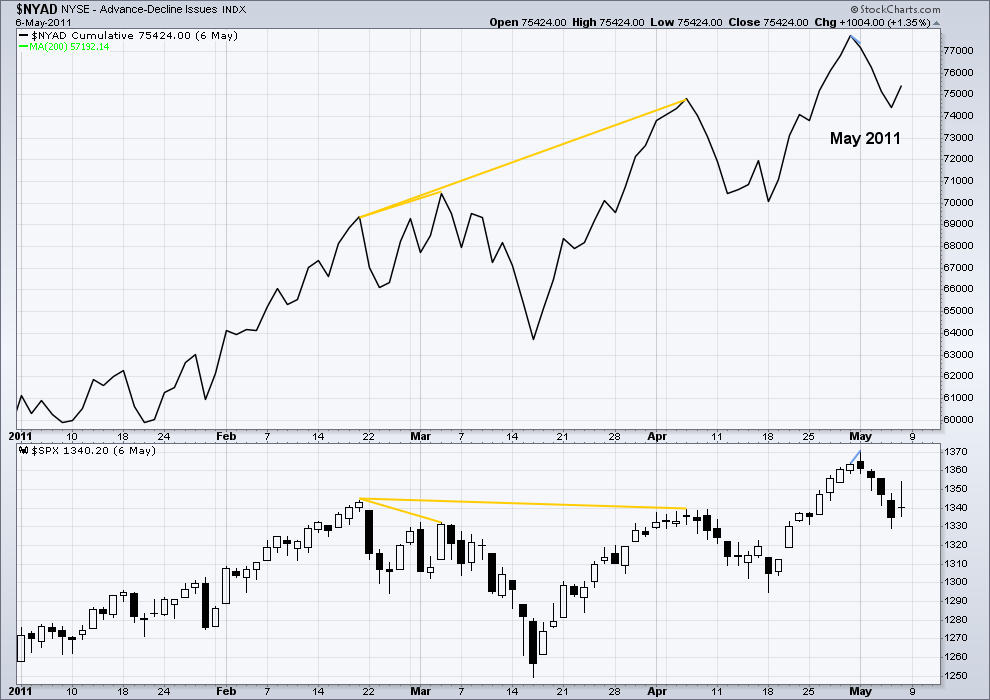
The next major pullback from 2nd May 2011 to 4th October 2011 saw price fall 22% of market value over 108 sessions.
There was only one day of bearish divergence between price and the AD line at the high on 2011.

Click chart to enlarge. Chart courtesy of StockCharts.com. So that colour blind members are included, bearish signals
will be noted with blue and bullish signals with yellow.
The third major pullback from 20th May 2015 to 11th February 2016 saw price fall 15% of market value over 184 sessions.
There was only 16 sessions of bearish divergence between price and the AD line at the high on 20th May 2015.
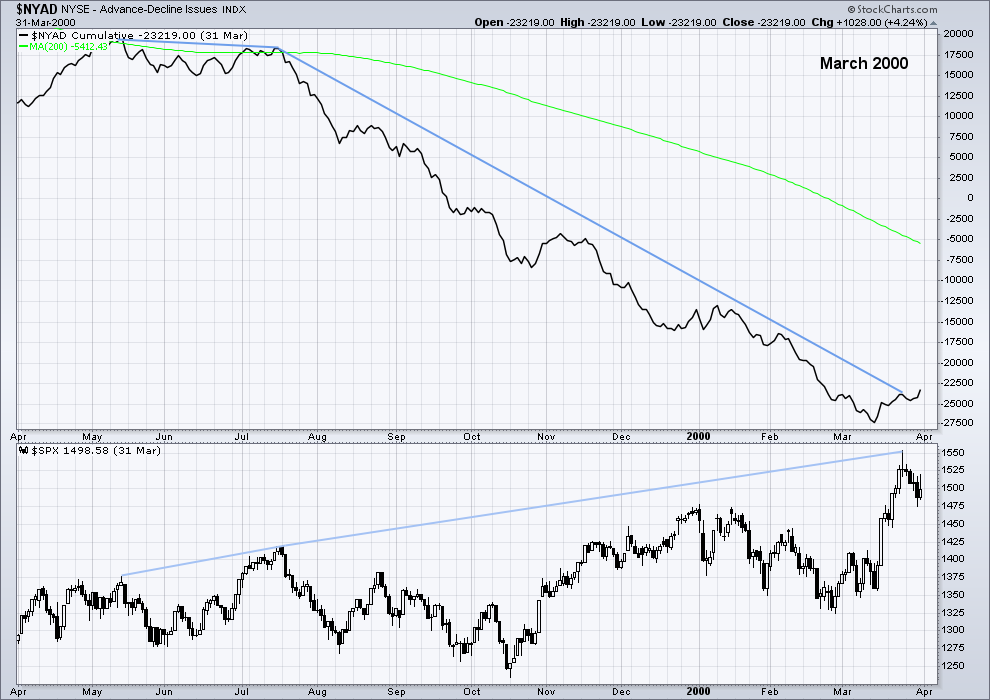
These pullbacks will be compared to the two most recent bear markets beginning March 2000 and October 2007:
Click chart to enlarge. Chart courtesy of StockCharts.com. So that colour blind members are included, bearish signals
will be noted with blue and bullish signals with yellow.
At the end of the bull market on 24th March 2000, there was bearish divergence between price and the AD line dating back to the 13th May 1999. This divergence is just short of one year in duration.
Click chart to enlarge. Chart courtesy of StockCharts.com. So that colour blind members are included, bearish signals
will be noted with blue and bullish signals with yellow.
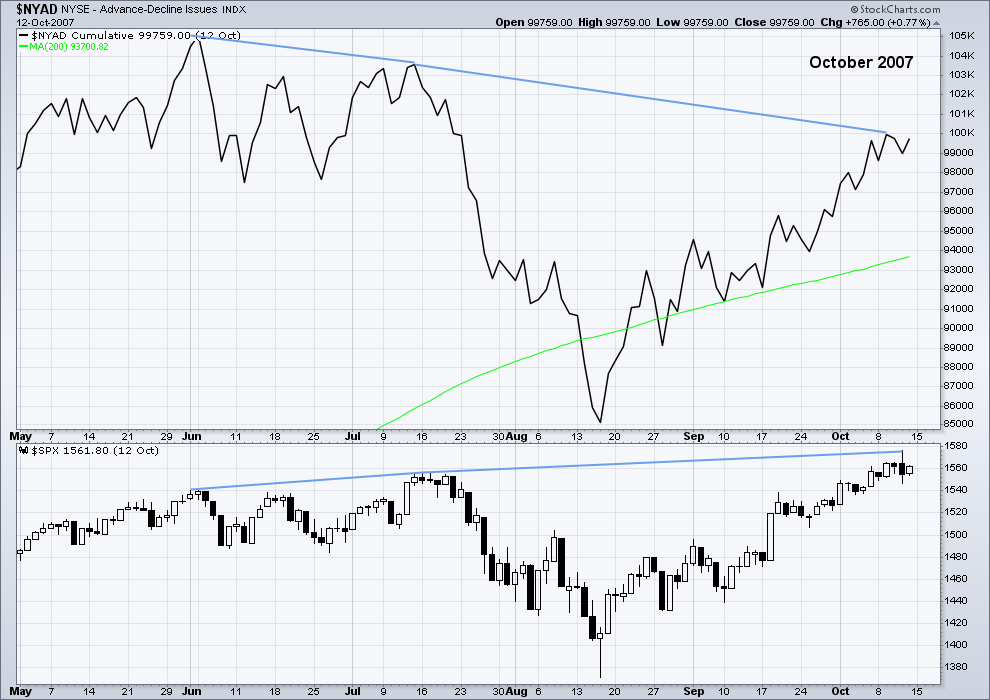
At the end of the bull market on 11th October 2007, there was bearish divergence between price and the AD line dating back to 4th June 2007. This was just over 4 months of divergence.
Click chart to enlarge. Chart courtesy of StockCharts.com. So that colour blind members are included, bearish signals
will be noted with blue and bullish signals with yellow.
Finally, a comparison may be made to the current situation.
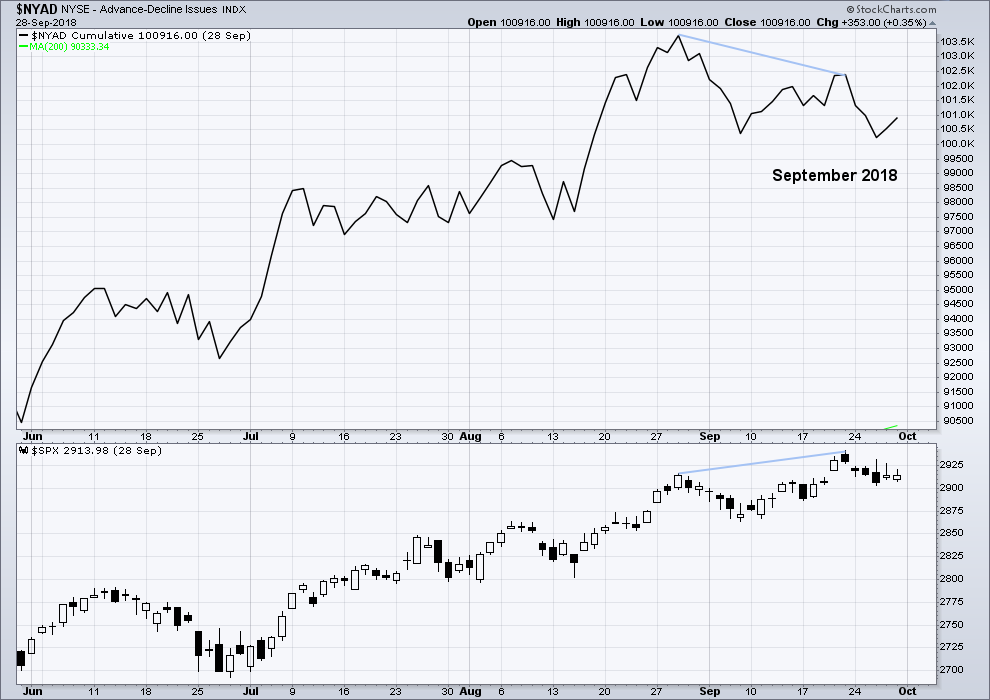
There was just 16 sessions of bearish divergence between price and the AD line at the last all time high.
This chart is more comparable to the first three charts of pullbacks within a bull market and not to the last two charts of the ends of bull markets and beginning of fully fledged bear markets.
Further, Lowry’s Operating Companies Only AD line shows no divergence between price and breadth at the high of the 21st of September. At that point, there was also no rise in selling pressure as measured by Lowry’s. Normally, selling pressure will show a steady and sustained rise towards the end of a bull market.
In conclusion, I am reasonably confident that the current fall in price will find a low reasonably soon and then be followed by a continuation of the bull market to new all time highs in 2019.
VOLATILITY – INVERTED VIX CHART
WEEKLY CHART
Click chart to enlarge. Chart courtesy of StockCharts.com. So that colour blind members are included, bearish signals
will be noted with blue and bullish signals with yellow.
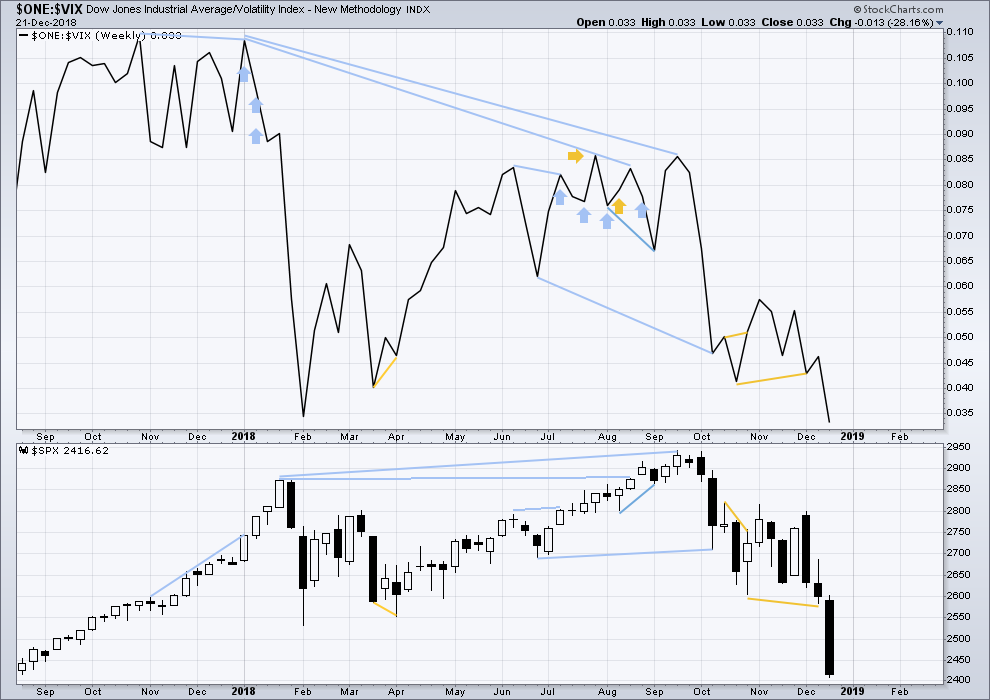
Bullish divergence noted in last week’s analysis of VIX has disappeared. There is now no divergence as both inverted VIX and price make new lows.
DAILY CHART
Click chart to enlarge. Chart courtesy of StockCharts.com. So that colour blind members are included, bearish signals
will be noted with blue and bullish signals with yellow.
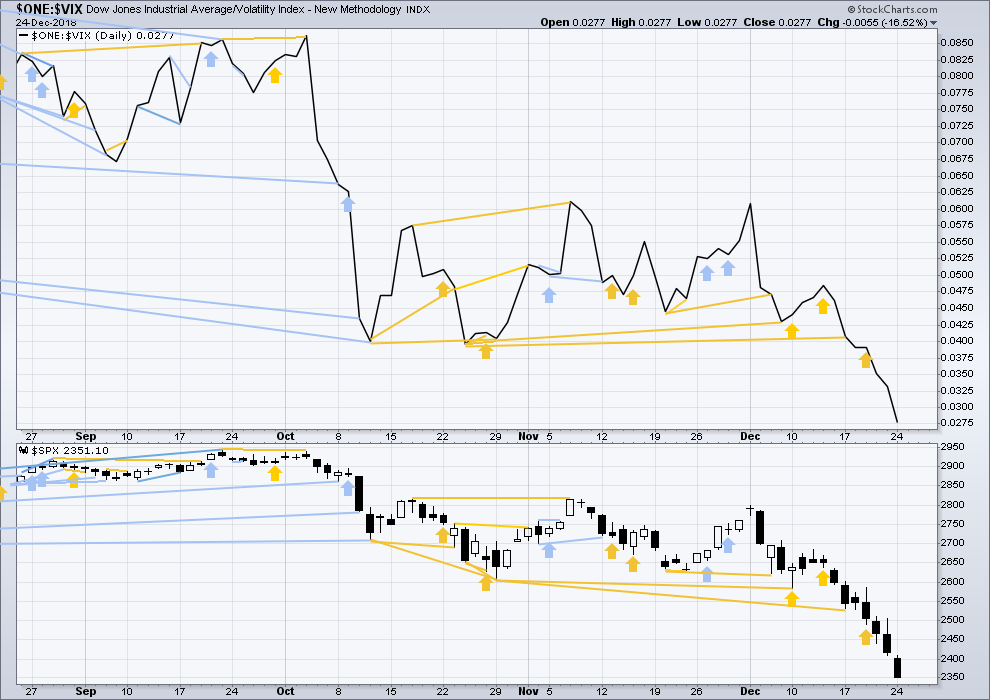
Both price and inverted VIX have made new lows. There is no divergence.
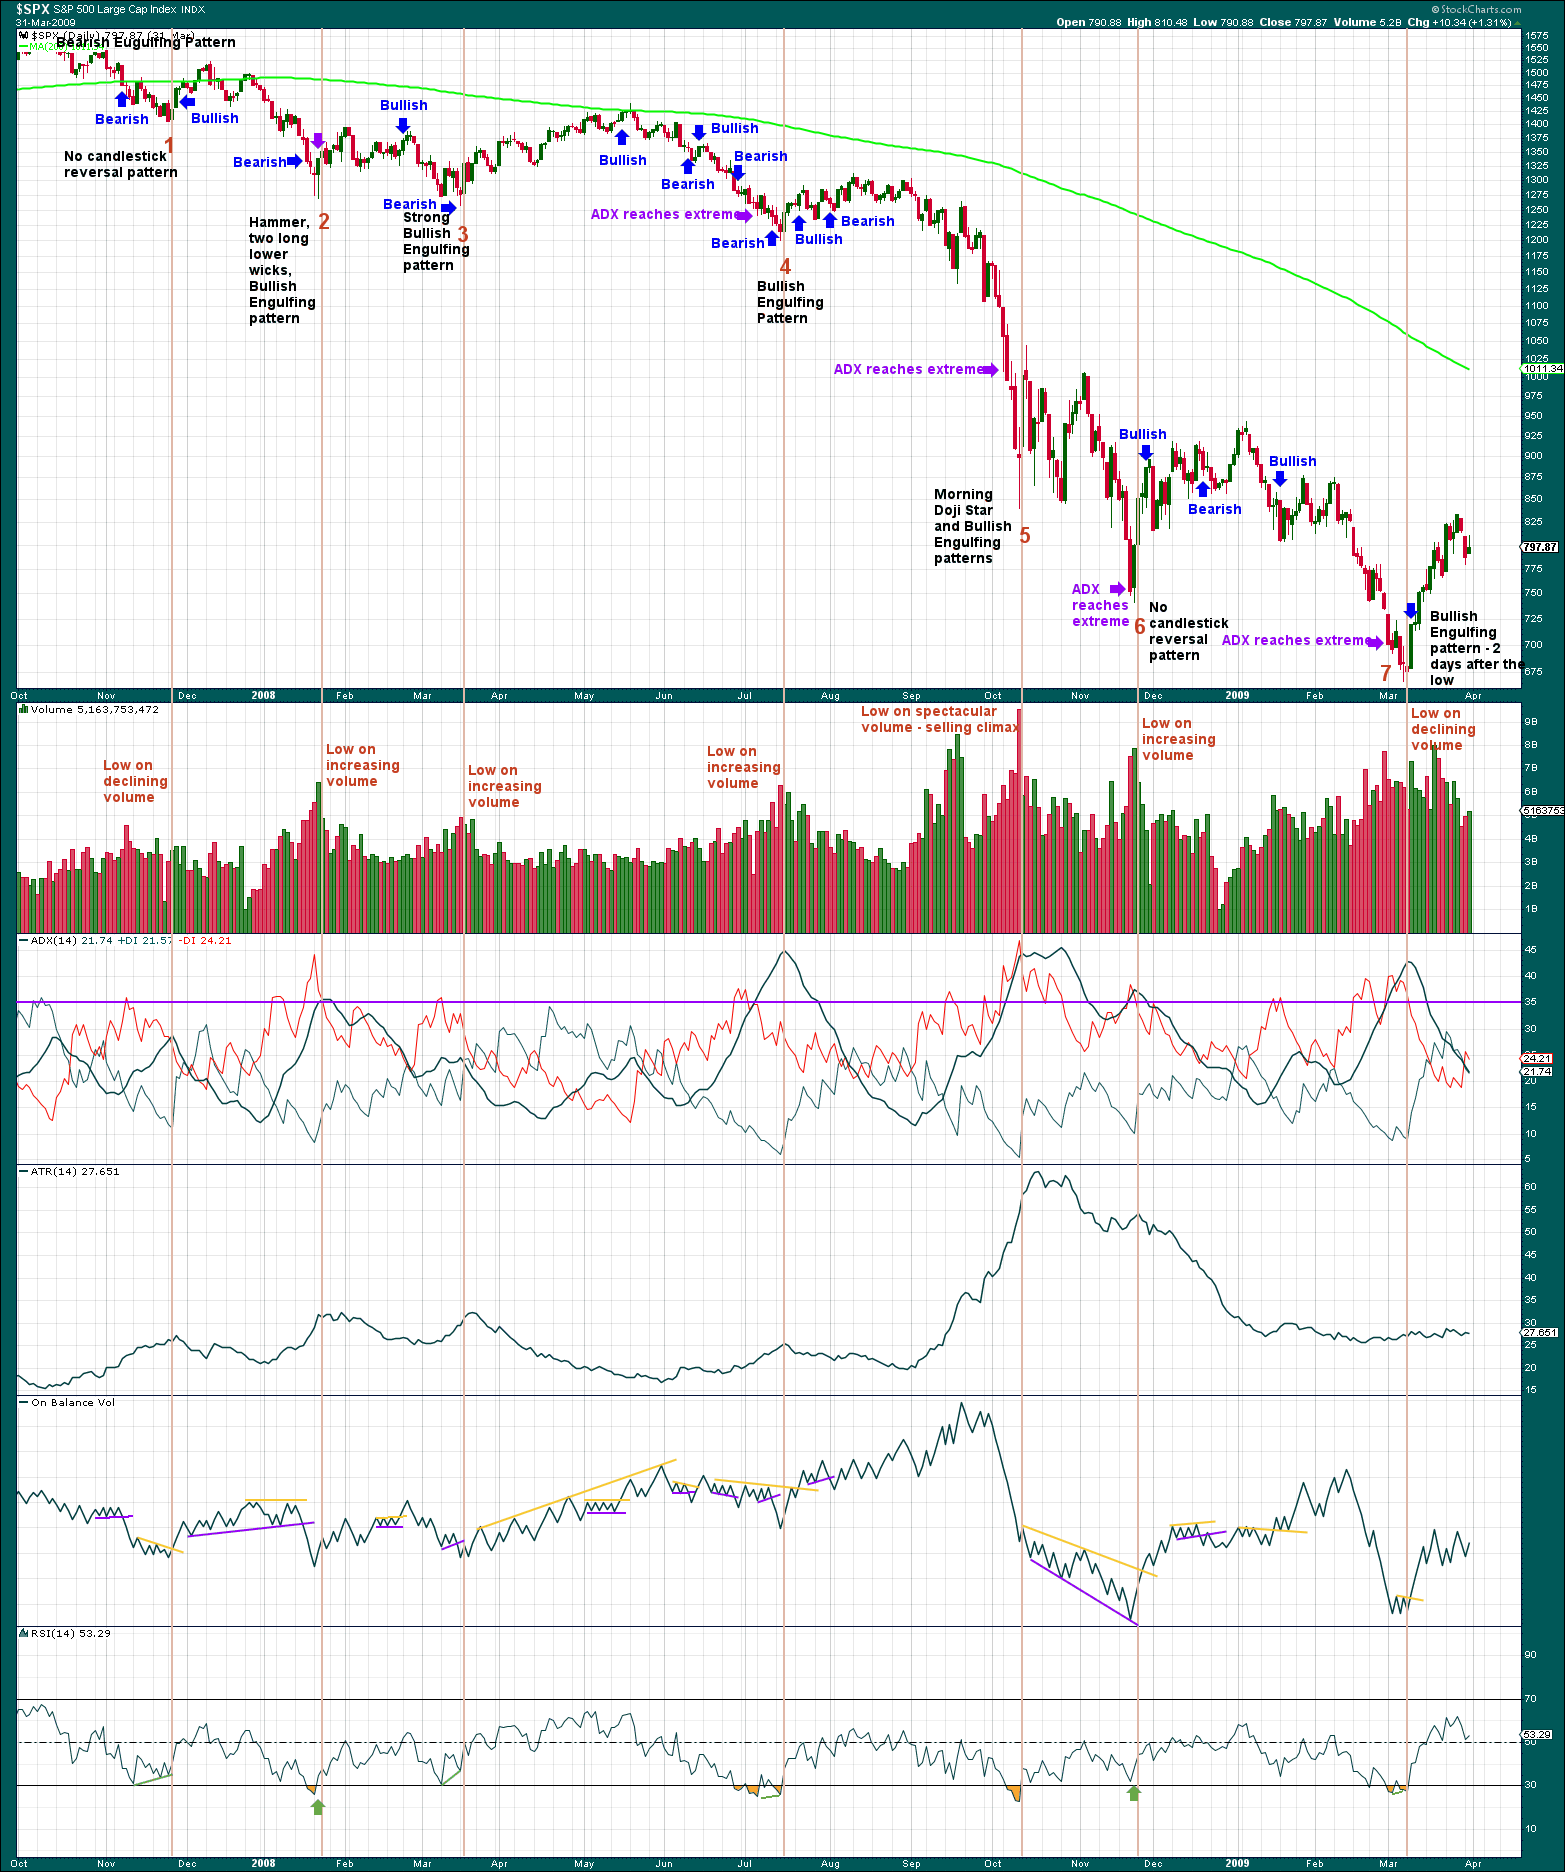
SUPPLEMENT – DAILY CHART – OCTOBER 2007 TO MARCH 2009
Click chart to enlarge. Chart courtesy of StockCharts.com
This exercise is to determine if there are any signals or a cluster of signals that appeared at minor swing lows and the final low within the most recent bear market from October 2007 to March 2009.
Lows as numbered were characterised by:
1. Declining volume as price fell on the final day, no candlestick reversal pattern, ADX was not extreme. Strong double divergence between price and RSI, but RSI had not reached oversold. A bullish signal from On Balance Volume two days after the low.
2. The day before the low a Hammer pattern (almost a Dragonfly doji but the upper wick is a little too apparent) appeared. The next day a low was found and a Bullish Engulfing pattern completed. Volume increased steadily and markedly to the low. ADX reached extreme just on the day of the low. RSI reached oversold and on the day of the low showed single day bullish divergence.
3. A strong bullish candlestick reversal pattern, and strong divergence with RSI but RSI was not extreme. On Balance Volume gave a bearish signal the day before the low.
4. A candlestick reversal pattern, a strong and steady increase in volume, downwards movement for six sessions after ADX reached very extreme. RSI reached oversold and then exhibited clear divergence with price. On Balance Volume gave a bearish signal two days before the low.
5. A strong bullish candlestick reversal pattern, a spectacular selling climax, ADX reached extreme four sessions prior to the low. RSI reached extreme but exhibited no divergence with price.
6. No candlestick reversal pattern, ADX reached extreme one session before the low, downwards movement had strong support from increasing volume; at the day of the low, there was single day divergence between price and RSI but RSI was not oversold.
7. There was no candlestick reversal pattern (the lower wick was not long enough for a Hammer pattern) at the final low in March 2009. A bullish reversal pattern appeared two sessions after the low. Price fell for the final three sessions on declining volume. ADX reached extreme five sessions prior to the low. On Balance Volume gave a bullish signal two sessions after the low, on the same day as the Bullish Engulfing pattern completed. RSI reached oversold and then exhibited divergence with price.
Additional:
Failed (and partially failed) bearish and bullish candlestick reversal patterns:
14th Feb 2008 – A Bearish Engulfing pattern was followed by only five sessions of downwards movement.
7th May 2008 – A Bearish Engulfing pattern was followed by only two sessions of downwards movement and then a high eight sessions afterwards.
8 Jul 2008 – A Bullish Engulfing pattern was followed by a new low five sessions later.
24th Jul 2008 – A Bearish Engulfing pattern was followed by only two sessions of downwards movement and a new high twelve sessions after.
1 Dec 2008 – A huge Bearish Engulfing pattern was immediately followed by 24 sessions of choppy upwards movement.
20 Feb 2009 – A strong bullish Hammer pattern was followed immediately by downwards movement.
Failed signals from RSI:
3rd Jun 2008 – Price made a slight new swing low and RSI made a slight new swing high. This bullish divergence was slight and RSI was not oversold.
18th Sep 2008 – Single day divergence where price moved lower but RSI moved higher, followed only by one more day of upwards movement.
29th Sep 2008 – Price made a strong new swing low but RSI made a slightly higher swing low, followed by only one day of upwards movement.
3 Oct 2008 – Price made a new low which was not matched by RSI. This bullish divergence was slight and disappeared the following day. It was followed by very strong downwards movement.
13 Nov 2008 – Price made a strong new swing low but RSI was substantially higher. This was followed immediately by very strong downwards movement.
17 Feb 2009 – Price made a new swing low which was not matched by RSI. This bullish divergence disappeared three sessions later and was followed by the final low 13 sessions after.
Volume profile:
Without looking at the price chart, and only looking at volume bars, it is possible to see in what direction price was moving for most of this bear market with a few exceptions. As price moved higher, upwards days exhibited stronger volume than downwards days. The reverse was true as price moved lower. A clear exception was from the 8th to the 18th of Sep 2008, and the 13th of Nov 2008.
Conclusions:
No one indicator or method may be used in isolation.
Strongly rising volume can coincide with a minor or major low. This is also observed by Lowry’s.
Divergence between price and RSI is more reliable when RSI is oversold, or when the divergence is strong. However, even strong divergence can simply disappear.
A cluster of bearish indications at one time increases the probability of a low.
DOW THEORY
Dow Theory confirms a bear market. This does not necessarily mean a bear market at Grand Super Cycle degree though; Dow Theory makes no comment on Elliott wave counts. It may equally as likely mean that Primary wave 4 could be deeper and stronger than originally anticipated.
DJIA: 23,344.52 – a close on the 19th of December at 23,284.97 confirms a bear market.
DJT: 9,806.79 – price has closed below this point on the 13th of December.
S&P500: 2,532.69 – a close on the 19th of December at 2,506.96 provides support to a bear market conclusion.
Nasdaq: 6,630.67 – a close on the 19th of December at 6,618.86 provides support to a bear market conclusion.
Published @ 09:05 p.m. EST.
—
Careful risk management protects your trading account(s).
Follow my two Golden Rules:
1. Always trade with stops.
2. Risk only 1-5% of equity on any one trade.
SPX hourly.
Sure looks like an ABC up to me that is topping. If price accelerates upward and starts a “new leg” up of this C wave…my suspicion increases dramatically that we are in the alternate with the cycle 4 completed already, and this isn’t a iv wave up correction at all but a new impulse starting the cycle 5.
I know C waves can often be quite extended vs the length of A (as we saw in the cycle 4 down!!)…but this one just doesn’t look right if it takes off upward.
Well…one minute, hour, and day at a time.
its ugly and I want to short it ….
but it keeps going…
…but not forever!
Updated hourly chart for the main count, with a new first target.
For this wave count intermediate wave (4) may be over at today’s high.
There is no Fibonacci ratio between intermediate waves (1) and (3), making it more likely there may be a Fibonacci ratio between intermediate wave (5) and either of (1) or (3). Equality with (1) is the most likely.
This is where the main and alternate wave counts now diverge strongly.
The main count expects a new low. The alternate expects the low is in.
December 26th was a 90% up day. That’s very bullish.
When the session for Friday is closed and I can analyse final data I will be weighing it all up and making a judgement about which count looks more likely.
They may swap over. They may not. But be prepared please for this possibility.
The action from that possible high to complete .. has been very choppy and sideways
Looks more like consilidation for a move up ..
Then a reversal wave down to complete a 5
It’s just doesn’t seem to have the punch for that
We will see what end of day brings
Also the way vix and vix futures are behaving .. it doesn’t feel like a big wave down is at hand
More like the vix buyers and markets sellers are drying up
Looking like a 5 wave up from the bottom Wednesday
any one a convert to the alternate?
I converted yesterday on that abc correction from the high Wednesday
More so today
Selling looks done
End of day will see if machines are sweeping up calls at end
Should at least test the 13dema around 2525
That being said
I also see the possibility of a top being in
So will watch closely around 2600-2800
Which could be a correction back before a large drop below 2000
Convert? Well, no. But open to the possibility, yes. Since the low of a few days ago we have seen VIX close inside its upper BB and then yesterday closed lower than the day before. Secondly, SPX closed inside its lower BB and then yesterday closed higher than the day before. Thirdly, the McClellan Oscillator after hitting -109 (the lowest close since around 2008) has also closed inside its lower BB and then above the previous day’s close. These three in combination are most often a very strong buy signal.
But that buy signal may indicate a rally within an on-going bear market or the start of a bull market. SPX 2631 is a decisive level that needs to be exceeded.
All that said, I have long positions entered a few days ago.
One part of me “hopes” (the non-trading side…hope is deadly to trading!!!) that Lara’s alternate that says the Cycle 4 is complete is correct.
That same side of me thinks “can’t be” because (a) we have a US gov’t shutdown that is only going to continue as far as the eye can see, (b) we are approaching the US/China trade negotiation deadlines and that will almost certainly end in failure, and (c) we have a hard Brexit approaching in March that will plunge the UK into recession. Hard to see how the market in January is going to ignore those factors; I would expect significant discounting to the downside based on the combination of the three.
We’ll see…said the blind man!
The short vol trade has been unwinding
It all comes down to how many buyers are left on a vix above 30
I would not be taking shorts or selling longs at these levels
Could it drop lower yeah..
But risk reward is better on the upside now
At least till 2600
It seems possible that the iv wave up is complete here. I have a lot of overlapped fibos in the 2511-2523 range. Structurally there’s a clear ABC up…question being is the C complete, or just getting started? I dunno…but I have a put bull spread with large profits sitting on the short put side, and can’t all that to wither away, so triggers to the downside are key for me here.
danger, thinking about fundamentals…
seems like the escalation of the wall absurdity and now further absurdity of “closing the border” (ending all trade???) could easily drive this market into wave v of C down mode, quickly.
I’m going to try to let the market inform me…
(ps: there are 4 lights folks)
This feels like an algo push
It’s pressing and pressing until it can’t squeeze anymore out on the downside
We will see if it gets bought back up after this push
Cheap calls that expire today may not be a bad idea if you exited your put spread
Yesterday when vxx pushed near 52
That felt like a flush ..
I’m short vxx so I felt every bit of it …lol
And the vix futures and spot vix are closing up in each other and the backwardation isn’t so bad
I’m highly suspicious that today’s top might be it for the iv wave up, and come monday/wednesday next week there will be some serious selling as the v down of the C down fires off. I’ve got a bear credit spread in place as a cheap way (if wrong) to get positioned for that.
If 4 ended at high today
The behavior down since looks a little funny
It looks more like sideways consolidation for a continued move up
Then a beginning 1 of a final move down to a new low to complete 4
There isn’t the strong push back down to start the 5 wave
Just my two cents
sweet, timed that well, now let’s have the darned v down happen asap so we can get on with the cycle 5 up!
The “Deep World” are making their move… The Puppeteers…….
“I believe according to the evidence that the central banks are motivated by ideological zealotry with the core purpose of total global centralization of economic and political power into the hands of a select group of elitists. This agenda is really just a modern “reboot” of feudalism or totalitarianism. They sometimes refer to the plan in public as the “new world order,” or the “global economic reset.” I often refer to the encompassing ideology as “globalism” for the sake of expediency.”
https://www.zerohedge.com/news/2018-12-27/brandon-smith-fed-suicide-bomber-deeper-agenda
+ Zero article… Angela Merkel: Nation States Must “Give Up Sovereignty” To New World Order
It’s all connected and they all are trying to accelerate this at this time!!! Create a crisis… then never let a good crisis go to waste! All events today are connected!
I am on the same page as you Joe. For the first time, I am taking real ‘prepper’ steps: food, water, cash, precious metals, ammo and fire arms. The ammo and fire arms are not mine. They belong to my son who is a big game guide, taxidermist, general outdoorsman. He stores much at my home. If we are drawing close to a Super Cycle top, it makes sense to me to make some preparations.
This sort of thing is difficult for me because I always like to say, “I’m a lover not a fighter.”
I do believe you are going to need all that and more Rodney…but not until the migrations north start up due to the US south/Mexico/Central America becoming uninhabitable due to warming. Perhaps by the early to mid 2030’s. Without doubt by the 2040’s. Everything is accelerating, not slowing, and the worst case projections are virtually certain, and likely to be exceeded, and that far more quickly than anyone is predicting. With feedback loops such as the permafrost melting…the rate of temp rise is likely to go exponential. But until people start being forced to pack up and move due to unlivable conditions, I don’t think mere recession/depression (certainly coming in the 2020’s) will cause widespread looting etc. Though…you never know. America is armed to the teeth now; AR15’s sold at every street corner. It could get bad in the 2020’s as mass numbers of people become fully destitute.
Understand you are reading Tyler Durden, the pickup “artist”. Except now he’s rebranded himself as a financial pundit. ‘Nuff said.
FYI: If you want real news before any other media out there reports it… Zerohedge is that site.
and yes some articles are “Out there” but most reports are spot on! Furthermore it’s easy to determine the “Out there” articles. The Angela Merkel one is right out of her own mouth… not reported anywhere else yet!
Plus even in mainstream business media… its amazing how many are coming out and trying to crash this market for what appears to me to be political purposes! But if you understand business and economics… you can see right through their FARCE!
“I see!” said the blind man
as he picked up his hammer and saw…
You are so Blind!
But I have saw’s in the garage so I’m okay.
There’s so much nonsense in this theater piece by Durden, it’s hugely laughable. How about this one for example: “the fed was sent here to blah blah”. Sent here? By who, the trilateral commission? Lol!!!
And then the argument that the Fed is on a secret mission to create a global government and currency etc. I mean, Seriously? That’s just pure la-la land nonsense. But you know what? It sells for Tyler Durden. He is a smart guy; he knows how to spew nonsense and make a buck by being outrageous and appealing to the conspiracy minded. After all, it is true that everything is explainable with a conspiracy theory!
The banking/money/real estate cycle is driven by the fractional banking system itself. It’s a mechanism that by it’s very structure generates booms and busts. It’s a highly documented cycle through US history that averages 18 years (but sometimes runs as short as 12 or as long as 25). The mechanisms driving it are far beyond the hopes and fears and micro-actions of individual bankers.
I highly recommend “The Secret Life of Real Estate and Banking” if you want a detailed treatise on the subject, including a detailed review of every cycle through the history of the US, as well as the details of how the US banking system has evolved through it’s history. And (shockingly) all without the need for any conspiracies whatsoever.
A “short cycle” would have a peak upcoming very soon, and a crash well under way by 2021. A nominal cycle would put the same out around 2026/27. So perhaps the upcoming recession will be moderate and an “intermediate” recession as well described and documented historically; very common to have such about 1/2 to 2/3’s of the way through every cycle. The BIG crashes involve plummeting real estate values (ala 2008/9).
Well…whatever will be will be. But as for the bankers generating a crash…yes and no. They are part of a bigger system, and it’s well beyond them to control it in any real way. So says my knowledge in my blind darkness, lol!!! I could be wrong…and it’s all a Trilateral Commission conspiracy! I think they are located in the hole in the earth at the south pole, by the way…
Lara,
Is there a scenario where the index comes back to retest at or just below the 2347 low keeping it inside the bull channel (or slight overshoot)? Rarely do you see this kind of correction ending a V-bottom?
The bounce appears to have come at the 200 wk moving avg and/or the bottom of the bull channel just like the last two corrections?
The main count expects a slight new low below 2,347. After intermediate (4) is over.
So, the short answer to your question, is yes.
I will be publishing a full end of week analysis with video after tomorrow’s session.
Updated analysis for the 27th:
Technical Analysis:
A long lower wick and a high almost at the close for the day indicates more upwards movement likely tomorrow.
It is not concerning in current market conditions that volume today has declined. I’d be expecting to see price rise on declining volume for cycle wave V.
Main daily Elliott wave count:
This count remains possible. But notice that price has bounced very strongly off the lower edge of this channel. That trend line is the one which was finally respected.
This count now expects an overshoot of the channel. That’s possible, fourth waves aren’t always contained within these channels, but I’ve got a new alternate for you below that avoids this problem and actually looks pretty good.
The price point to clearly differentiate the two counts is 2,631.09.
Intermediate (4) may not move into intermediate wave (1) price territory. This is cash market data so I would not accept an overlap. This invalidation point is black and white.
Hourly chart:
Minor waves A and B may be complete. At 2,519 minor C would reach equality in length with minor A. This is also the 0.382 Fibonacci ratio of intermediate wave (3) and so this target is now calculated at two degrees, it has a good probability if this is the correct count.
New alternate daily Elliott wave count:
It is possible that cycle IV was complete as a double zigzag at yesterday’s low. It is possible that cycle wave V has only just begun, to make new all time highs in 2019. The target may be met in March or October, these two months seem to be somewhat more common months for bull markets to end.
Members may like to enter long positions here or very soon in anticipation of this alternate, in case it’s correct. Risk is at 2,346.58. Remember my two Golden Rules of risk management. I put it at the end of every analysis.
This weekend, my family was singing that song by Karen and Richard Carpenter, “We’ve Only Just Begun”.
Seems appropriate.
Dear Lara, i cannot help but notice that it is very common that the alternate scenarios make the main counts untradable. You are right on your golden rules and i am a big supporter on stop losses but there is no way that someone can trade your daily or hourly scenarios without having their stop loss activated. What i would humbly recommend is to have us focused on weekly and monthly scenarios. On a daily basis , when volatility strikes there is no reason to put any possible scenario since some contradict the others. This is my personal opinion and even though i respect your work, it is evident ( especially in January 18 and December 18), that even though your were right on the big picture, stop losses are constantly activated because a ‘low might be in place’. the move from 2800 to 2315 is the example that when we stop loss we should actually stop them. At this point from your scenarios it is not clear if you would be long or short for the daily. If we are long then how can we place a stop at 2346 when The target for this large pullback to end is now at either 2,269 or 2,242. If we are short according to your daily alternate where do we put a stop? i know times of volatility create pressure but i have to put my perspective into this. Our decisions are affected by your scenarios.
Lara’s EW information is not (in my opinion) a one stop shop for all things needed to trade successfully. If you are trying to view it or utilize it as such…you are likely to have significant problems and challenges (as you describe).
I view the information as backdrop roadmaps, and yes, the market might suddenly veer off the current roadmap and as such, the alternative roadmap becomes active.
How to trade leveraging the EW information is not a simple formula and of course there are really infinite ways. But for sure…just attempting to trade off the EW “main” and “alternates” is going to be…well, probably a losing proposition. You need more tools than that, that operate at finer degree of resolution, etc. I’m a fibonacci retrace/turn oriented trader; others are big into moving averages, bollinger band excursions, etc etc. For example, when Rodney shares his reasoning for entry…it’s predicated fundamentally on the primary EW count, but supported by a lot of his own additional analysis. And Verne…well, he views the market through his own lens and will often be aggressively trading the alternate, for logical reasons of his own.
Just my $0.02. Trust me that most of us highly value the longer time frame view…and the short term (hourly chart/count) view too.
Thanks Kevin. That makes sense and appreciate the input. My intention was not to be judgmental but because, i also value Laras’ work i must reflect on the fact that in the 2 times that there was a huge move in 2018 i could not take advantage of it because i was too careful due to her strong conviction e.g. the teal line. When you value this work you can not just disregard the short term view. Unfortunately , these are hard facts and not personal perspective. So my suggestion is just not to have this next day prediction with all these scenarios. There is no reason cause its distracting. No-one canpredict next day that so there is no one to blame. I really value Laras commitment and all the comments i see and i hope i am not misunderstood. We are all trying to benefit and all have common goal here. So i have to be honest with best intention at heart.
I understand the sentiment G.
And my analysis since the 10th of December has not been very good. Alternates proved to be more correct, but they have all now been discarded for a new count.
This is not always the case. Back in April 2018 I almost nailed the end of a fourth wave triangle and was able to give members a good entry point for long positions.
I’m not always right. But I will learn from mistakes. My mistake here was not considering a bigger picture alternate wave count at cycle degree.
Which is why risk management is so important.
As Kevin notes, members here are all using may analysis differently.
Also, regarding the bigger picture, that’s kinda why I developed Lara’s Weekly. It very carefully does not provide hourly charts, I want members there to focus on the larger trend and avoid noise of smaller movements.
It all depends on what kind of trader you are.
Wild day. Nice profitable…I managed to wait for that little 2 wave to finished then took bite after bite on SPY, QQQ and IWM as the rocketed. Things look nicely bullish here for the next few trading days I would guess.
ABC correction down from yesterday’s strong move up completed at 2397.. followed by strong buying
.62 retrace from up move
For what it’s worth
Looks like the machines are sweeping up the calls end of day now on the mid week s and p options expirations
it was worth a lot today! slowly selling long positions at close….
Might want to keep a few …
They could really run AMZN and AAPL here if sellers are exhausted
more than a few 🙂
This should just be i of iii action of the C wave up of the iv up (clear?).
Meaning…we should see perhaps even more powerful movement upward tomorrow at some point.
yeah still around 75 SPX handles left in the Elliot channel….. but I have learned that profit can vanish quickly in this market….
Going to at least the 2528 13ema…
IMHO
Yes
And vix is giving it up a little
And there was what looked like capitulation in VXX
If this is the ending 4..:). Down… not the 4 of the 4 up…lol
Another Rollacoaster of a day!!
This is all technical (don’t believe all the garbage being spewed)… Hedge funds closing, Hedge funds getting huge redemption calls… both leading to huge positions (L&S) being closed out, ETF’s & funds being met with selling and redemptions. The leveraged ETF’s are in the same boat. Sprinkle in some margin calls + algo trading + lack of human traders with sizable powder and this is an example of what has been occurring! It’s that simple!!!
By the end of the 2nd full week of January + option expiration period… this will all settle down and then the waves will be more in line with the direction and things will make sense again. At least I hope things will make sense again!
Today (12/27, a few hours in) it appears that we’ve got this iv up, which so far on the hourly is showing as a completed A up, a B down in progress…and Friday/early next week, a C up?
That’s how I”m seeing it at the moment.
B looking like a triangle ….. so far
I had to buy a few puts near yesterdays highs, a very interesting look on the hourly chart….
well done!
All I can hear in my head now is Verne…. “You know what to do” 🙂
And the reality is I don’t….. but I love reading Lara’s analysis and getting input from the forum
Well…no one “knows” for a fact what to do.
Wave count wise, a 4 up is due. Logically, the market is “due for a bounce” and its happening. So everything seems kosher here. If getting long (I am), the issue is properly getting out with profits (or in the worst case, minimal if any loss). And getting positioned for that final 5 of C down.
What I’m a bit concerned about is the coming March madness of Brexit which appears will destroy the economy of Britain, and that can’t be good for broader work markets and results. How does that fit with a cycle 5 up around that timeframe? Hmmm.
Markets like to climb a wall of worry?
While today’s candlestick doesn’t fully engulf the 24th of December, it does fully engulf the 21st of December. This is a very bullish reversal pattern, with support from volume.
The expectation for the short to mid term is a consolidation or bounce for intermediate wave (4). Most likely target 2,520. To last about one to three weeks.
It may be a very choppy overlapping combination, flat or triangle, most likely.
Lara, when are you next planning to do a full daily review.
Thanks
End of week.
DJIA… 628 pts down then down 1,086 up… what’s next???
1,498 down??? What a crazy market… I believe it is the combination of raising the fed funds rate while also reducing the balance sheet.
For those that say reducing the balance sheet is meaningless, just remember it was QE3 that that pushed up the balance sheet dramatically higher and kept fed funds rates at zero.
A 116 point SPX rally! Now that is what I call a counter-trend rally. And only 14 posts today. Interesting.
A lack of interest or hope is what you need to kick off this rally. 1st stage of rally is short covering- 2nd stage funds are rebalances and end of the year tax selling is done by next Monday. 3rd stage will be hope comes back with trade talk resolution or Fed becomes more dovish. Spy is going back to 260ish where it broke down. Support will now be resistance!
what is your time frame for 260ish?
Mid January.
that would be great for my march spy calls….. cheers to a little gamble
going to get close to 2600 much faster than that, next week looks like to me. Then…back down in the final v of the C down. Be ready…
The wave count doesn’t work if I put minor 3 complete at the last low and this bounce as minor 4.
Because within minor 3, minute i is 154.90 points, minute iii is 144.11 points. Minute v may not be longer than minute iii, which it would be if I put it over at the last low. Minute iii may not be the shortest actionary wave within minor 3 impulse.
I hope that makes sense!
If I’ve got the little subdivisions within intermediate (3) labelled right, then it should now be over. Not reaching the target.
Look now for a sideways consolidation or a bounce for intermediate (4).
Close to a 100 rally, now thats something to draw people in!!
Somehow I’m thinking that was minor 4. And we still head to the target 2318. Or maybe that’s just Verne in my head ….
The time frame of 4 will be important
Could it only last a few hours from the bounce this morning ?
Seems like with the length of 3.. it would need at least a couple days before flushing lower ..
Definitely appears to be starting
She had a count of it lasting a few days and going over 2500
I’m long AAPL at $150 from Friday and short VXX at $46.50 from Friday too
So maybe I’m biased towards a bigger bounce ..lol
End of day will be interesting
Not such selling pressure yet…
But who knows end of day
If people are selling the rips end of day and forced liquidation’s are over
We could see that squeeze to 2500 next couple days
I am guessing if we see a move above 2410.34, that would mean Minor 5 of Intermediate 3 has completed and we are in Intermediate 4 up. That is only another 30 points up from here and with the volatility we have seen, it is entirely possible.
However, it looks like we are headed for the 2318 target first just as Lara has outlined.
I have no clue. If forced to guess, I’d say this market goes sideways until the new year. After that, anyone’s guess, truly. Yes, a 4 up is due due due. A reasonable positional shorting opportunity when it arrives and peaks.
A cycle V is now called for starting sometime in 2019…which means the GSC wave 1 is going to end substantially later, 2021-2022 timeframe? That starts to line up more with the 18 year (average) banking/real estate boom/bust cycle (which does vary between 12-24 years historically).
Cycle III is shorter in length and duration than cycle I.
So cycle V must be shorter in length than cycle III, and so probably also shorter in duration. Cycle III lasted 31 months. Cycle V could be over in 2019, and October will again be my expectation, or it could continue through to 2020.
October seems to be a fairly common month for fully fledged bear markets to begin.
Thanks Lara.
2411.51 (and counting…).
I agree, it would appear the iv up is on here.
the market opens in 12 minutes and I’m first? whaaaat?
Yes you are. I did not post earlier. I wanted coffee first.
Boy of boy, this update explains a lot. All I can say is “Wow. A cycle degree move down. That explains a lot.” Thanks Lara.