
Upwards movement continued as the Elliott wave count expected. The target remains the same.
Summary: A target now is at 2,856 for the short term. The upwards trend should be assumed to continue as long as price remains above 2,718.05.
A new low below 2,718.05 would indicate a larger pullback may have begun.
The bigger picture still expects that a low may now be in place. At its end, primary wave 2 may offer a good entry opportunity to join the upwards trend.
The target is at 3,045 with a limit at 3,477.39.
New updates to this analysis are in bold.
The biggest picture, Grand Super Cycle analysis, is here.
The monthly chart was last published here.
ELLIOTT WAVE COUNT
WEEKLY CHART
Click chart to enlarge.
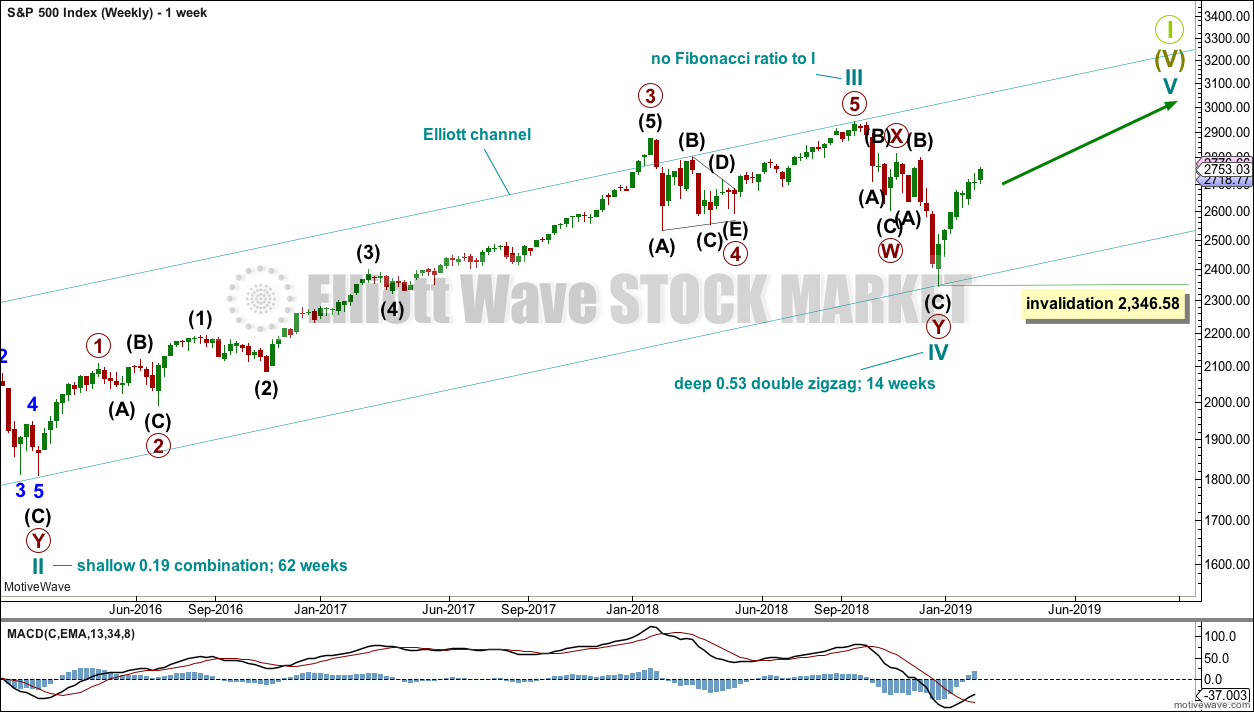
This weekly chart shows all of cycle waves III, IV and V so far.
Cycle wave II fits as a time consuming double combination: flat – X – zigzag. Combinations tend to be more time consuming corrective structures than zigzags. Cycle wave IV has completed as a multiple zigzag that should be expected to be more brief than cycle wave II.
Cycle wave IV may have ended at the lower edge of the Elliott channel.
Within cycle wave V, no second wave correction may move beyond the start of its first wave below 2,346.58.
Although both cycle waves II and IV are labelled W-X-Y, they are different corrective structures. There are two broad groups of Elliott wave corrective structures: the zigzag family, which are sharp corrections, and all the rest, which are sideways corrections. Multiple zigzags belong to the zigzag family and combinations belong to the sideways family. There is perfect alternation between the possible double zigzag of cycle wave IV and the combination of cycle wave II.
Although there is gross disproportion between the duration of cycle waves II and IV, the size of cycle wave IV in terms of price makes these two corrections look like they should be labelled at the same degree. Proportion is a function of either or both of price and time.
Draw the Elliott channel about Super Cycle wave (V) with the first trend line from the end of cycle wave I (at 2,079.46 on the week beginning 30th November 2014) to the high of cycle wave III, then place a parallel copy on the low of cycle wave II. Cycle wave V may find resistance about the upper edge.
DAILY CHART
Click chart to enlarge.
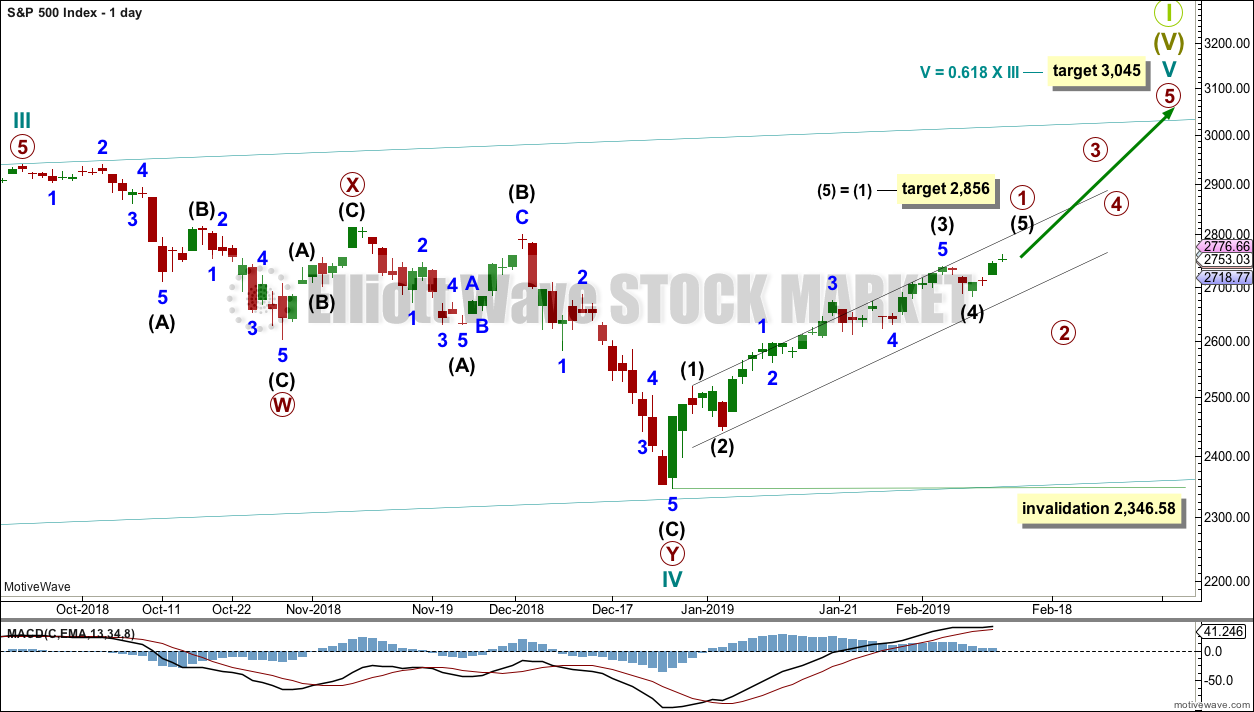
The daily chart will focus on the structure of cycle waves IV and V.
Cycle wave IV now looks like a complete double zigzag. This provides perfect alternation with the combination of cycle wave II. Double zigzags are fairly common corrective structures.
Within Super Cycle wave (V), cycle wave III may not be the shortest actionary wave. Because cycle wave III is shorter than cycle wave I, this limits cycle wave V to no longer than equality in length with cycle wave III at 3,477.39. A target is calculated for cycle wave V to end prior to this point.
Cycle wave V must subdivide as a five wave motive structure, either an impulse or an ending diagonal. An impulse is much more common and that will be how it is labelled. A diagonal would be considered if overlapping suggests it.
Primary wave 1 is labelled as incomplete.
Primary wave 2 may not move beyond the start of primary wave 1 below 2,346.58.
HOURLY CHART
Click chart to enlarge.
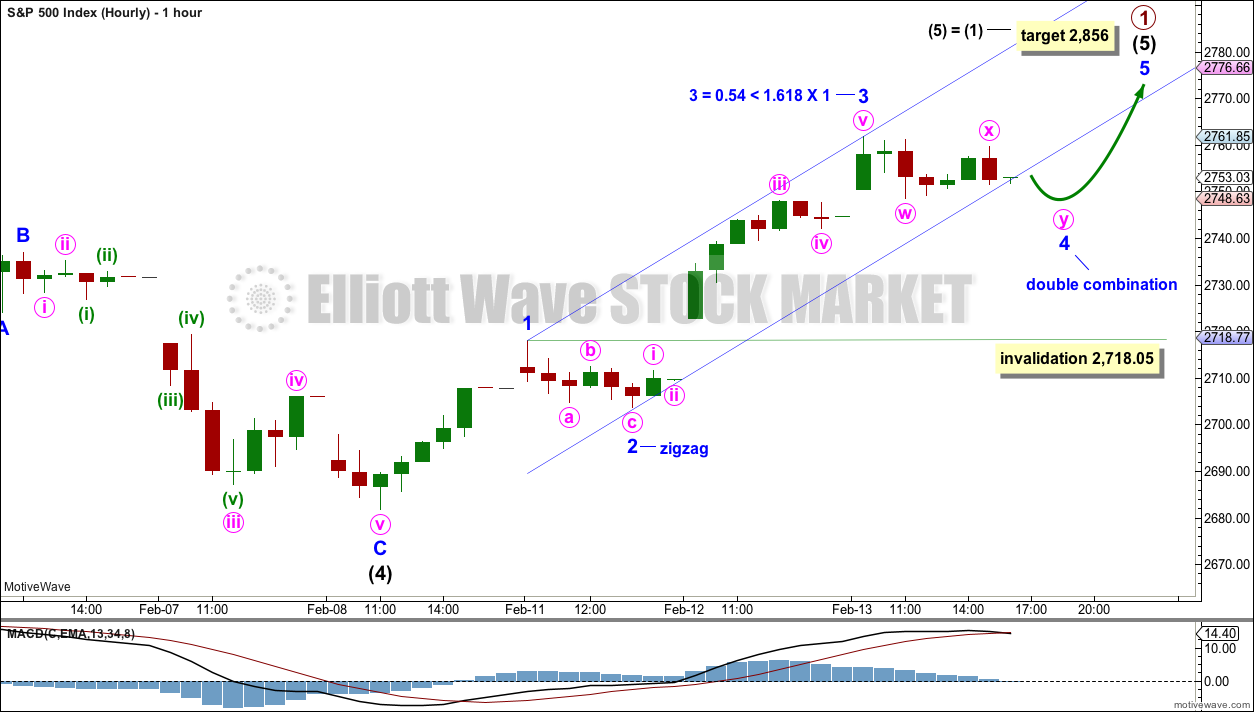
If intermediate wave (5) is under way, then within it minor waves 1 through to 3 may be complete.
With this labelling of intermediate wave (5), there is a very close Fibonacci ratio between minor waves 3 and 1. Minor wave 3 shows stronger momentum than minor wave 1.
Minor wave 2 fits as a zigzag. Minor wave 4 so far fits as an incomplete double combination: flat – X – zigzag. Minute wave y looks incomplete on the five minute chart; it may end with a little more downwards movement when markets open tomorrow.
Thereafter, the upwards trend may resume.
The channel is drawn using Elliott’s first technique, but the structure of minor wave 4 suggests it may be breached tomorrow. If this happens, then the channel should be redrawn when minor wave 4 is complete using Elliott’s second technique: the first trend line from the ends of minor waves 2 to 4, then a parallel copy on the end of minor wave 3. The trend channel may show where minor wave 5 ends; it may find resistance about the upper edge of the channel.
The target expects to see the most common Fibonacci ratio for intermediate wave (5).
ALTERNATE DAILY CHART
Click chart to enlarge.
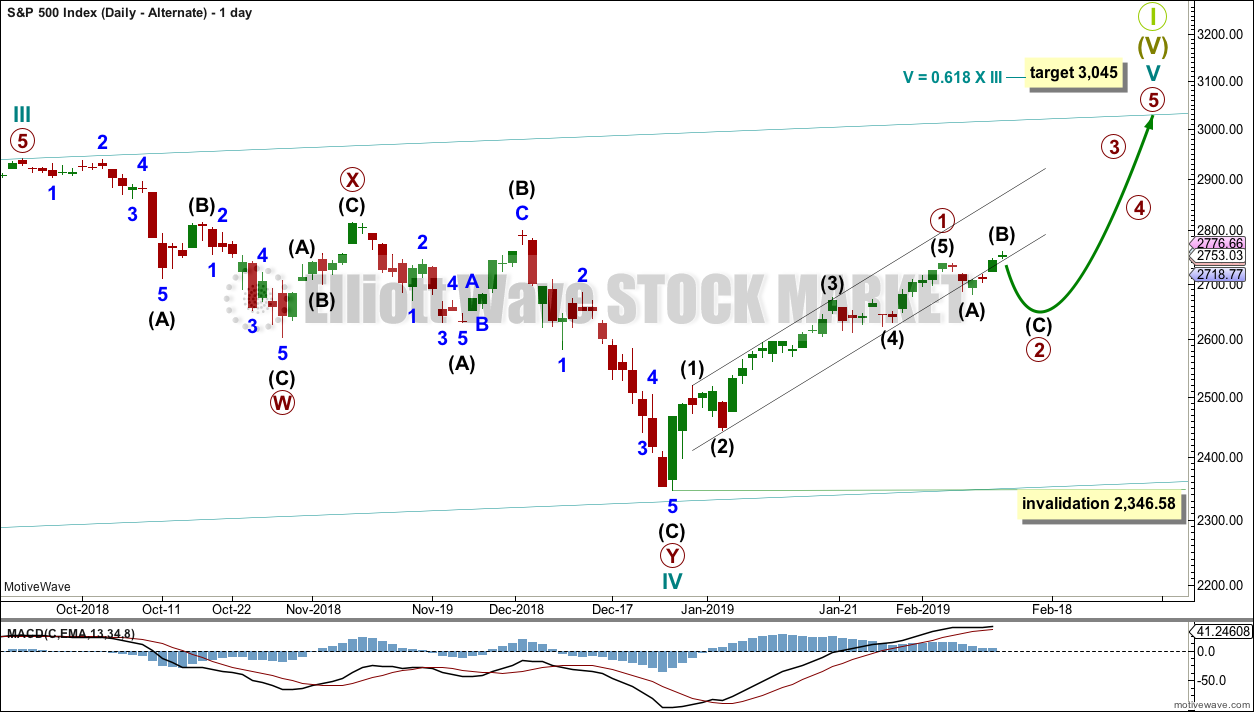
This alternate wave count should only be used if price makes a new low below 2,718.05 in the short term.
It is still possible that primary wave 1 was over at the last high and primary wave 2 may be continuing sideways as an expanded flat correction.
However, the new high yesterday comes with some support from volume. This does not look like intermediate wave (B). Intermediate wave (B) should exhibit weakness.
The target for intermediate wave (C) would be at 2,669 where intermediate wave (C) would reach 1.618 the length of intermediate wave (A).
Primary wave 2 may not move beyond the start of primary wave 1 below 2,346.58.
TECHNICAL ANALYSIS
WEEKLY CHART
Click chart to enlarge. Chart courtesy of et=”_blank”>StockCharts.com.
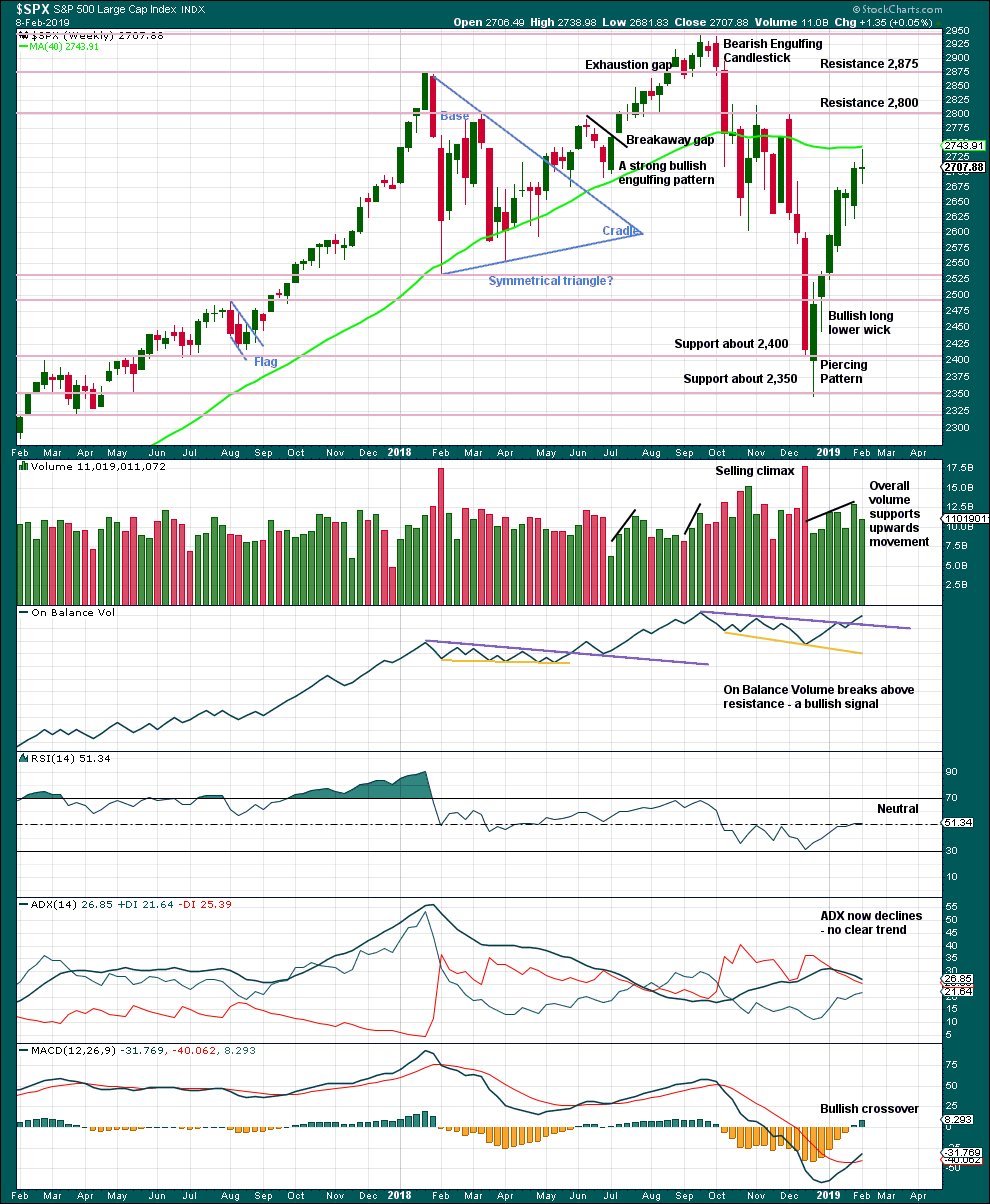
From the all time high to the low at the end of December 2018, price moved lower by 20.2% of market value meeting the definition for a bear market.
It should be noted that the large fall in price from May 2011 to October 2011 also met this definition of a bear market, yet it was only a very large pullback within a bull market, which so far has lasted almost 10 years.
Overall, volume supports upwards movement. There is plenty of room for price to rise further.
Last week the long legged doji candlestick puts the trend for now from up to neutral. Risk of a pullback is heightened.
DAILY CHART
Click chart to enlarge. Chart courtesy of StockCharts.com.
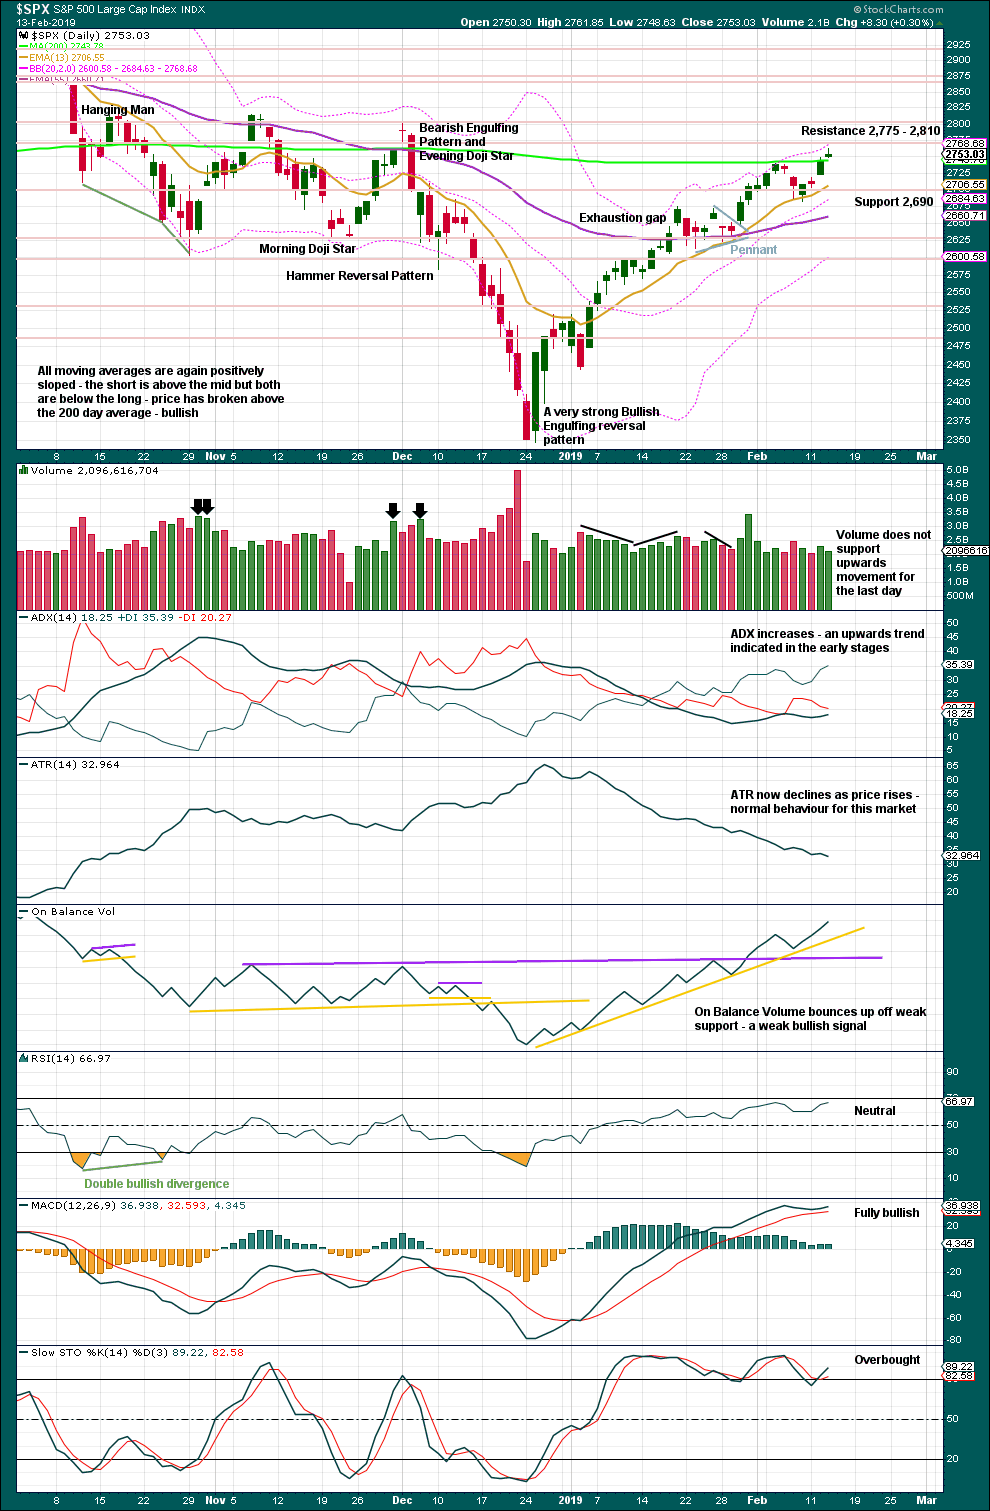
Over a fairly long period of time this ageing bull market has been characterised by upwards movement on light and declining volume and low ATR. For the short to mid term, little concern may be had if price now rises again on declining volume. Current market conditions have allowed for this during a sustained rise in price.
It is also normal for this market to have lower ATR during bullish phases, and strongly increasing ATR during bearish phases. Currently, declining ATR is normal and not of a concern.
Considering the larger picture from the Elliott wave count, some weakness approaching the end of Grand Super Cycle wave I is to be expected.
From Kirkpatrick and Dhalquist, “Technical Analysis” page 152:
“A 90% downside day occurs when on a particular day, the percentage of downside volume exceeds the total of upside and downside volume by 90% and the percentage of downside points exceeds the total of gained points and lost points by 90%. A 90% upside day occurs when both the upside volume and points gained are 90% of their respective totals”…
and “A major reversal is singled when an NPDD is followed by a 90% upside day or two 80% upside days back-to-back”.
The current situation saw two 80% downside days on December 20th and 21st, then a near 90% downside day with 88.97% downside on December 24th. This very heavy selling pressure on three sessions together may be sufficient to exhibit the pressure observed in a 90% downside day.
This has now been followed by two 90% upside days: on December 26th and again on 4th January.
The current situation looks very much like a major low has been found.
Price now has closed above the 200 day moving average, on an upwards day with some support from volume. This looks like a classic upwards breakout from a small pullback within an ongoing upwards trend.
This trend is nearing an end for the short to mid term though. The number of stocks trading above their 10 day moving averages is declining while price is rising. This divergence is bearish and suggests developing weakness. This fits the Elliott wave count, and this is normal behaviour for a fifth wave. It is not particularly useful however in identifying a high in place; it is only a warning of an approaching high.
BREADTH – AD LINE
WEEKLY CHART
Click chart to enlarge. Chart courtesy of StockCharts.com. So that colour blind members are included, bearish signals
will be noted with blue and bullish signals with yellow.
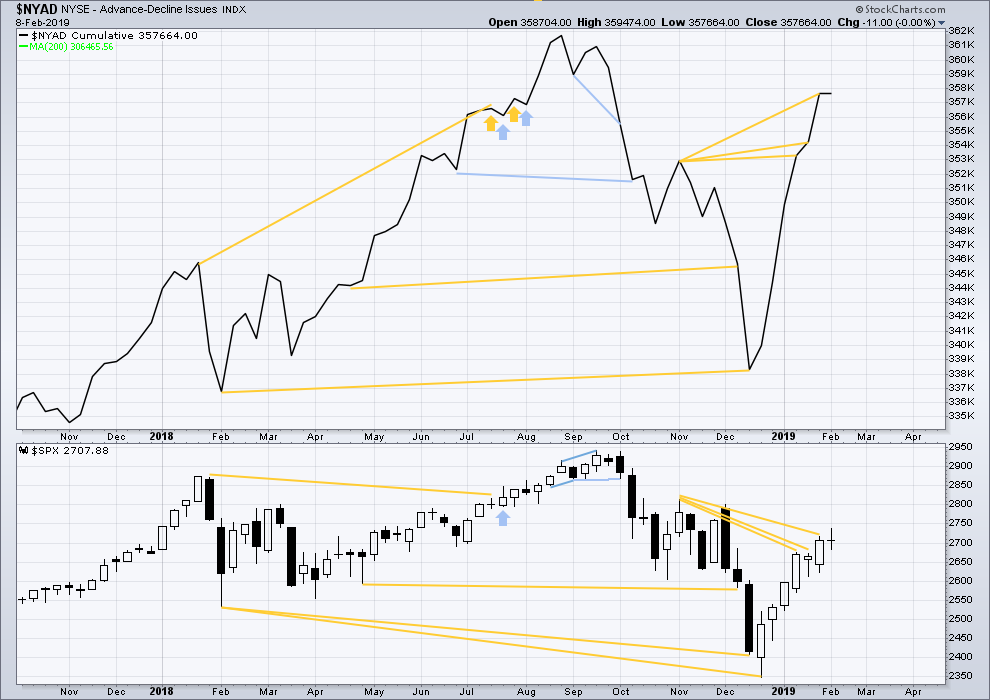
The AD line has made yet another new high above the prior swing high of the week beginning 5th of November 2018, but price has not. This divergence is bullish for the mid term.
Last week price moved mostly sideways and the AD line is flat. This is considered to exhibit no divergence.
DAILY CHART
Click chart to enlarge. Chart courtesy of StockCharts.com. So that colour blind members are included, bearish signals
will be noted with blue and bullish signals with yellow.
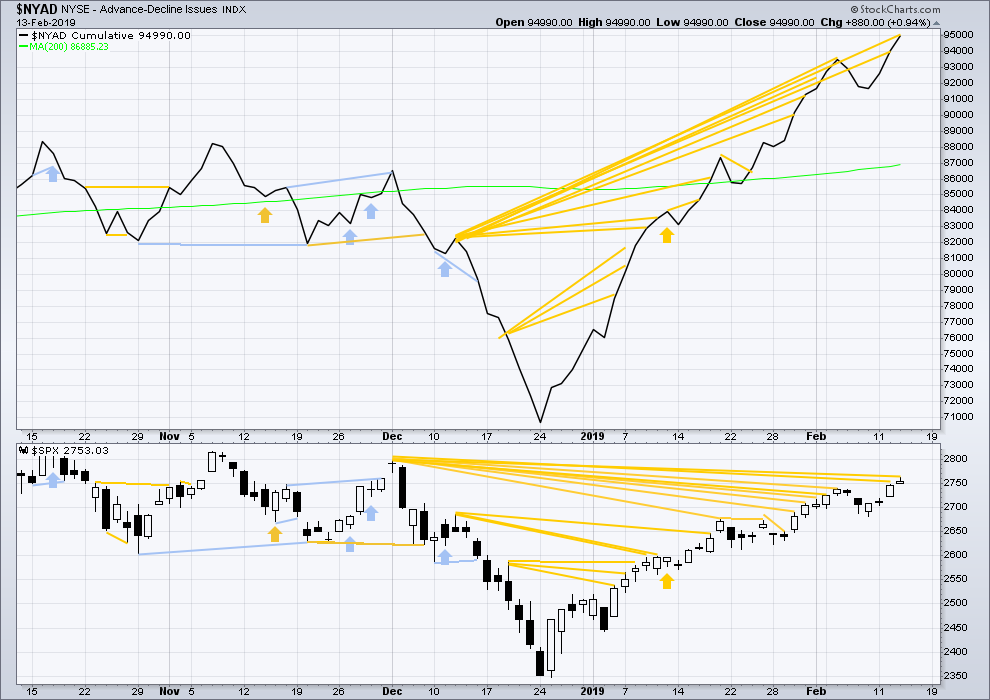
Breadth should be read as a leading indicator.
There is now a cluster of bullish signals from the AD line. This supports the Elliott wave count.
The AD line has again made another new high above the prior swing high of the 3rd of December, but price has not. This continuing divergence is bullish.
VOLATILITY – INVERTED VIX CHART
WEEKLY CHART
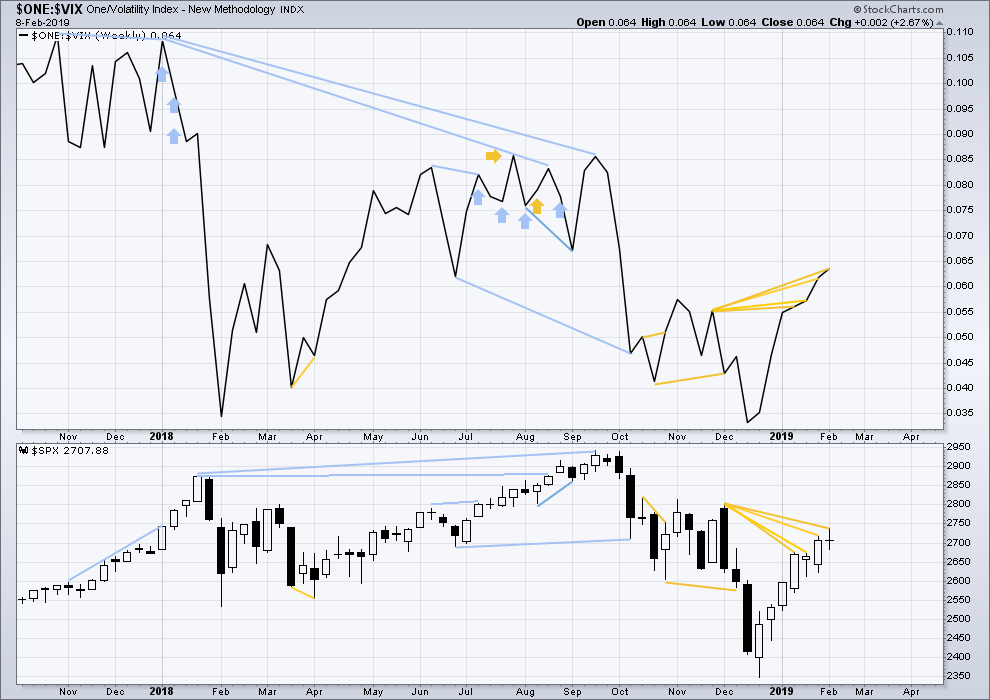
Click chart to enlarge. Chart courtesy of StockCharts.com. So that colour blind members are included, bearish signals
will be noted with blue and bullish signals with yellow.
Inverted VIX has made another new high above the prior swing high of the weeks beginning 26th of November and 3rd of December 2018, but price has not. This divergence is bullish for the mid term.
DAILY CHART
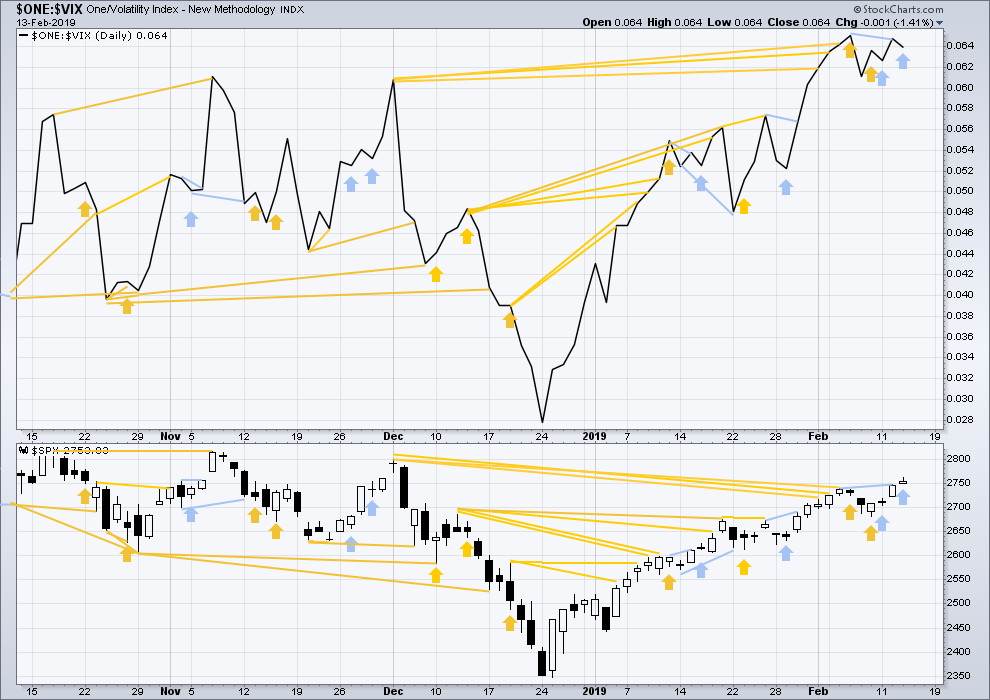
Click chart to enlarge. Chart courtesy of StockCharts.com. So that colour blind members are included, bearish signals
will be noted with blue and bullish signals with yellow.
There is now a cluster of bullish signals from inverted VIX. This supports the Elliott wave count.
Last two instances of bearish divergence have both been followed by upwards days. They are both considered to have failed.
Today price moved higher, but inverted VIX moved lower. Upwards movement today has not come with a normal corresponding decline in VIX. This divergence is again bearish, but it may not be reliable.
DOW THEORY
Dow Theory confirms a bear market. This does not necessarily mean a bear market at Grand Super Cycle degree though; Dow Theory makes no comment on Elliott wave counts. On the 25th of August 2015 Dow Theory also confirmed a bear market. The Elliott wave count sees that as part of cycle wave II. After Dow Theory confirmation of a bear market in August 2015, price went on to make new all time highs and the bull market continued.
DJIA: 23,344.52 – a close on the 19th of December at 23,284.97 confirms a bear market.
DJT: 9,806.79 – price has closed below this point on the 13th of December.
S&P500: 2,532.69 – a close on the 19th of December at 2,506.96 provides support to a bear market conclusion.
Nasdaq: 6,630.67 – a close on the 19th of December at 6,618.86 provides support to a bear market conclusion.
Published @ 10:05 p.m. EST.
—
Careful risk management protects your trading account(s).
Follow my two Golden Rules:
1. Always trade with stops.
2. Risk only 1-5% of equity on any one trade.
Who wants to hold hands and short the Rut on any strength tomorrow ?
I have already started building position shorted @ 1550 & 1552, will add more on any stregth
Goooood morning everybody!
Hourly chart updated.
While minor 4 doesn’t look like a perfect combination in that it has a strong slope, that’s how it subdivides on the five minute chart.
I’m putting the invalidation point at the start of minor 5 to allow for the possibility that my labelling of minute i through to iv as complete is premature, it may need to be moved down one degree. Within minor 5, if minute ii is yet to arrive it may not move beyond the start of minute i.
The channel is redrawn using Elliott’s second technique. Minor 5 may end either mid way within the channel, or if not there it may find resistance at the upper edge.
A new first target is calculated.
SPY and NDX have just entered a first bar of squeeze on the hourly, both with dropping momentum.
RUT is getting very close to a high potential turn zone of a 100% and the 61.8% of the entire ATH to Dec low move. 1554-1563.
I spy with my little eye…another wedge type structure in NFLX (daily chart here), similar to the one back in Sept-Oct. I will short on a break down out of it.
Yes brother
I am layering in 355-365 call spreads for tomorrow with the intention of being short if they wind up in the money by a good bit
Or rolling if it’s close
actually on the upper left of this chart there is a 3rd one of these critters, also followed by a large sell off!
Bought a 355-347.50 put spread in NfLX for tomorrow as well for .80
5 min chart
That was amazing Peter
…only if this C drops
TBH that’s how I would’ve labelled it too, and I too would have expected wave C down.
Triangles are tricksy little things!
This is how I’m labelling it now
Did you say “tricksy”, love??!!
Gollum! Gollum! 🙂
Yet another island reversal pattern. Recent ones have all been negated.
I am not overly impressed with the vigor of this initial move down, impulsive though it apoears. Negation of seemingly impulsive declines now occur with regularity. 2700 remains a line in ths sand for me. A failure to take it out suggests leverage remains intact…
Man
I have seen some vix smashes in my time
But that smack down from 17.27 to under 16
Was something
No soup for you !,,.lol
Covered my vxxb short 34 puts
Looking for another good entry
Covered the spy 276. -278 calls spread at just the 276 strike
Looking for another entry there as well
Nibbling I’m selling some upside 355-365 call spreads in Netflix
Best fill so far is around $3
VIX bull flag…. 🙂
Yes brother
It’s a restless animal now
They are smashing vix futures…
I had to sell some tomorrow ex vxxb 33.5 puts at .40…..will use that as a rolling leg if need be…
VX just broke from a falling wedge.
Either it breaks back below upper boundary or tags it before heading higher.
https://invst.ly/a1ezh
Resold my 276 spy calls for tomorrow on this push back above 275
Hammer time!
Looks like Inter 2 might have started?
Still very much in reasonable minor 4 territory re: the hourly main. if <2718, yes.
5 minute looks like a 5 wave move down off yesterday’s highs. Might be a complete A of a 3 wave minor 4 down. A B up would likely test the gap, then a C down to complete a flat or zigzag.
The low today might be the completion of the y-wave to complete minor 4 (per Lara’s chart above), and from the low to the high might be an impulse to start minor 5, and now its having a zigzag 2nd wave correction… so we might not take out today’s lows if this scenario plays out…
Thanks Ari I didn’t see that, I need to pay more attention!
An upward thrust pattern. 4 flat bottomed daily candles. The 4th makes the high. The 5th makes a higher close but also makes a lower high. The 6th makes a lower close.
We are in day 2 of the pattern. Today’s daily candle (in progress) has already made a higher high.
FWIW, there is a data release at 8:30. The markets are not using the standard pullbacks to the entire “normal” acceptable entry levels. They are just moving without fully checking the retracement box.
I think you mentioned this before a few days ago, but what platform do you use to give you accurate Heiken Aki candle patterns? I’m finding them to be quite useful to confirm patterns and gauging strength of a trend…
Thanks for your input and charts…
The black background charts that I post are from interactive brokers.
There are very decent free charts at the CNBC site online … For example, the path to the ES Heikin-Ashi is: Markets>Pre-Mkt>S&P 500 (Mini)>Display pulldown>Chart Style: Heikin-Ashi. Then click on your preferred duration and bar size.
Today’s daily candle has shown that we are not involved in the upward thrust pattern at this time.
#1 and on the run.