An upwards breakout with support from volume suggests a new Elliott wave count.
Summary: A target now is at 2,856 for the short term. If this target is wrong, it may not be high enough. The upwards trend should be assumed to continue as long as price remains above 2,718.05.
The bigger picture still expects that a low may now be in place. At its end, primary wave 2 may offer a good entry opportunity to join the upwards trend.
The target is at 3,045 with a limit at 3,477.39.
New updates to this analysis are in bold.
The biggest picture, Grand Super Cycle analysis, is here.
The monthly chart was last published here.
ELLIOTT WAVE COUNT
WEEKLY CHART
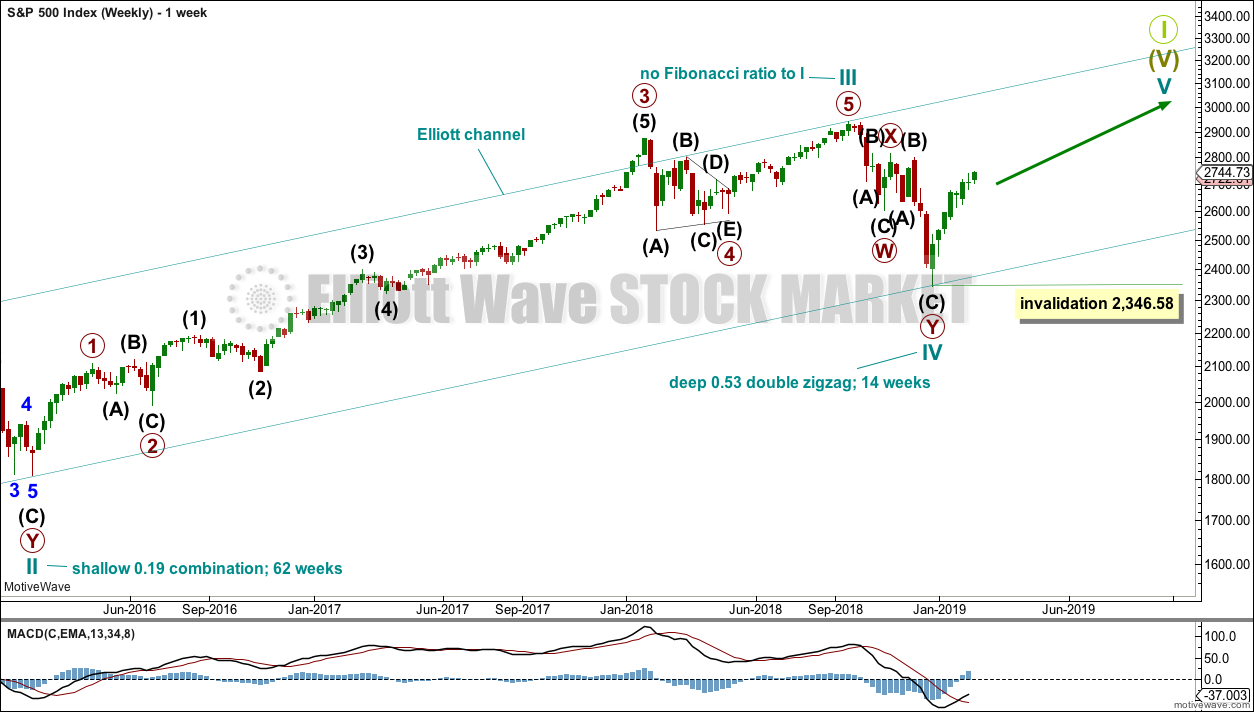
This weekly chart shows all of cycle waves III, IV and V so far.
Cycle wave II fits as a time consuming double combination: flat – X – zigzag. Combinations tend to be more time consuming corrective structures than zigzags. Cycle wave IV has completed as a multiple zigzag that should be expected to be more brief than cycle wave II.
Cycle wave IV may have ended at the lower edge of the Elliott channel.
Within cycle wave V, no second wave correction may move beyond the start of its first wave below 2,346.58.
Although both cycle waves II and IV are labelled W-X-Y, they are different corrective structures. There are two broad groups of Elliott wave corrective structures: the zigzag family, which are sharp corrections, and all the rest, which are sideways corrections. Multiple zigzags belong to the zigzag family and combinations belong to the sideways family. There is perfect alternation between the possible double zigzag of cycle wave IV and the combination of cycle wave II.
Although there is gross disproportion between the duration of cycle waves II and IV, the size of cycle wave IV in terms of price makes these two corrections look like they should be labelled at the same degree. Proportion is a function of either or both of price and time.
Draw the Elliott channel about Super Cycle wave (V) with the first trend line from the end of cycle wave I (at 2,079.46 on the week beginning 30th November 2014) to the high of cycle wave III, then place a parallel copy on the low of cycle wave II. Cycle wave V may find resistance about the upper edge.
DAILY CHART
The daily chart will focus on the structure of cycle waves IV and V.
Cycle wave IV now looks like a complete double zigzag. This provides perfect alternation with the combination of cycle wave II. Double zigzags are fairly common corrective structures.
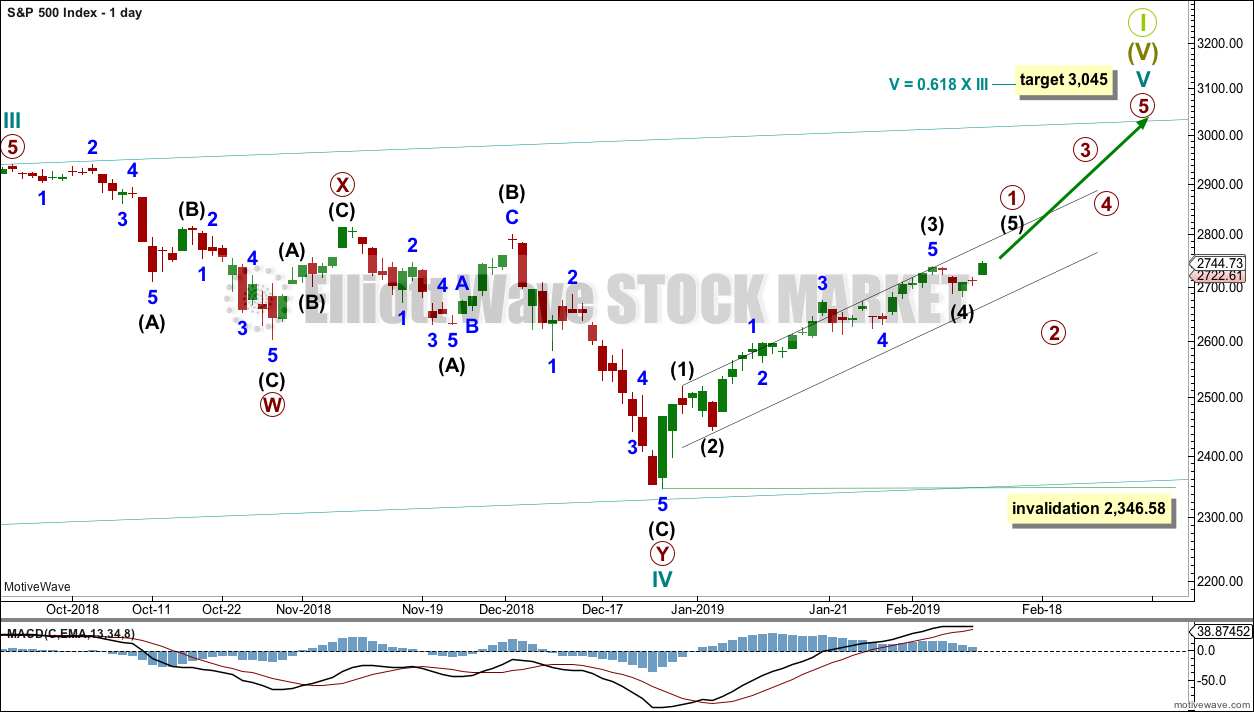
Within Super Cycle wave (V), cycle wave III may not be the shortest actionary wave. Because cycle wave III is shorter than cycle wave I, this limits cycle wave V to no longer than equality in length with cycle wave III at 3,477.39. A target is calculated for cycle wave V to end prior to this point.
Cycle wave V must subdivide as a five wave motive structure, either an impulse or an ending diagonal. An impulse is much more common and that will be how it is labelled. A diagonal would be considered if overlapping suggests it.
Primary wave 1 is again labelled as incomplete. The last small pullback within this ongoing upwards trend is now labelled intermediate wave (4). This looks too small to be a correction at primary degree.
Primary wave 2 may not move beyond the start of primary wave 1 below 2,346.58.
HOURLY CHART
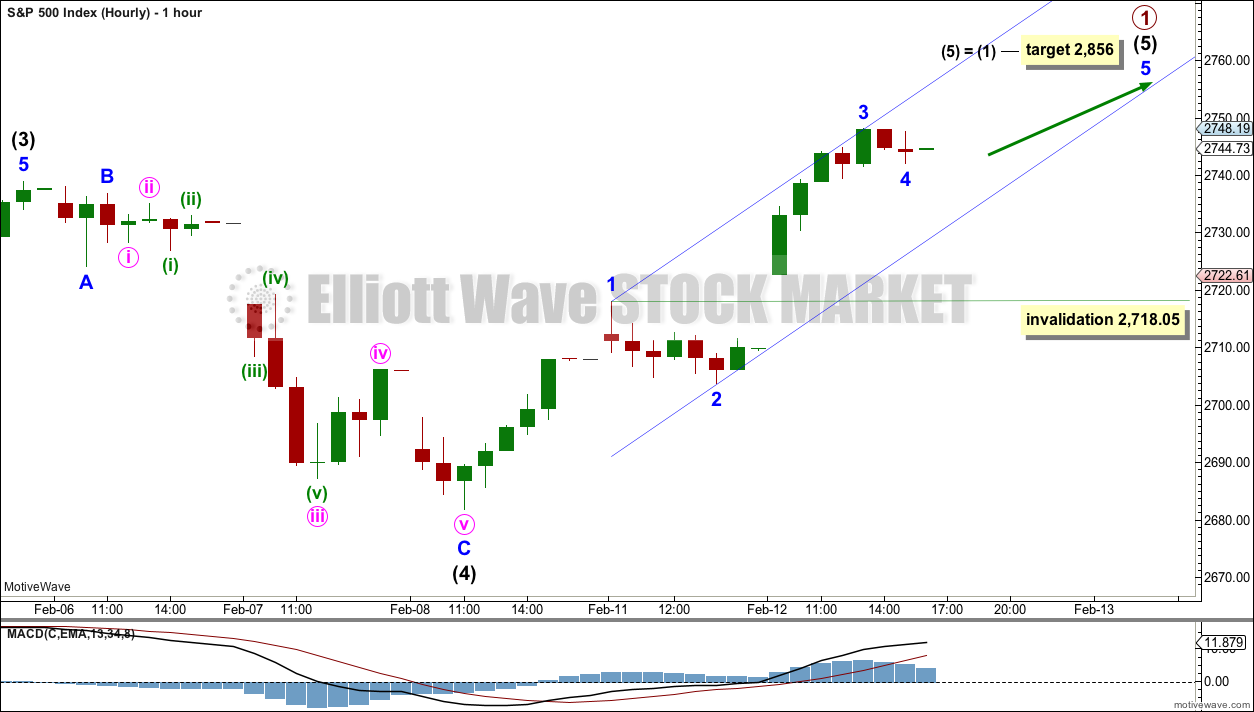
If intermediate wave (5) is under way, then within it minor waves 1 through to 3 may be complete.
Minor wave 4 may also be complete, or it may continue sideways. Minor wave 4 may not move into minor wave 1 price territory below 2,718.05.
The target expects to see the most common Fibonacci ratio for intermediate wave (5).
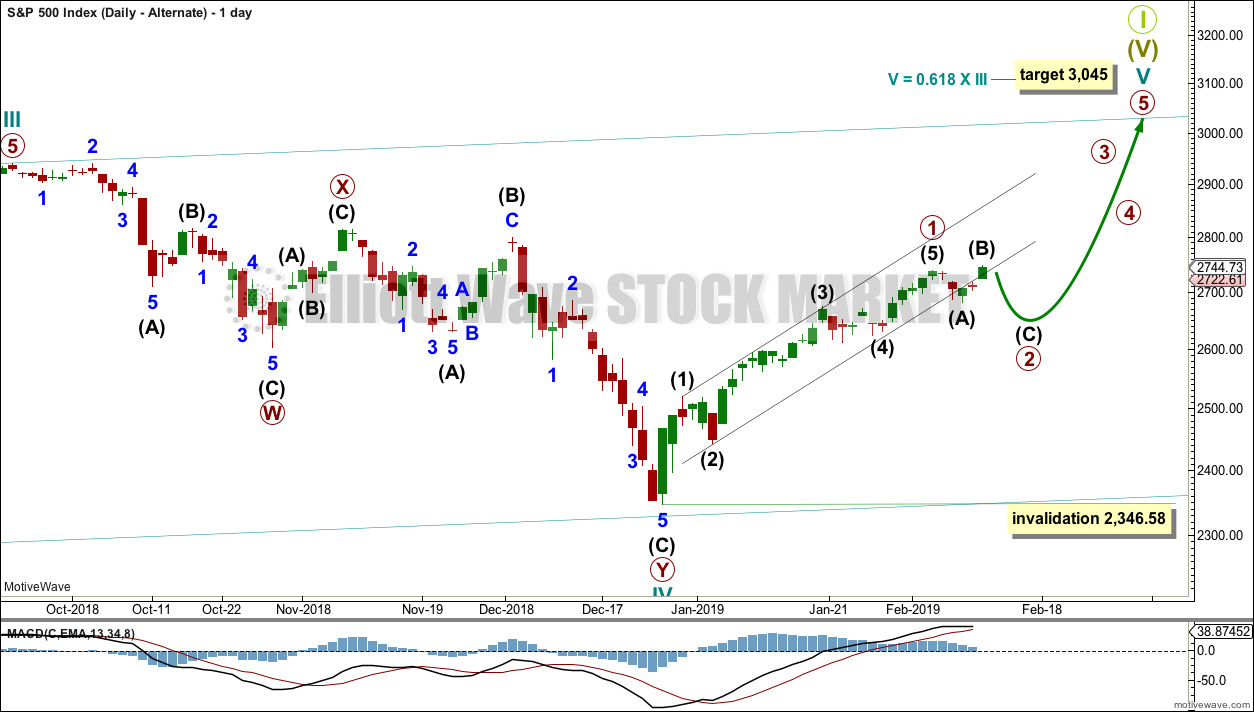
ALTERNATE DAILY CHART
This alternate wave count should only be used if price makes a new low below 2,718.05 in the short term.
It is still possible that primary wave 1 was over at the last high and primary wave 2 may be continuing sideways as an expanded flat correction.
However, the new high today comes with some support from volume. This does not look like intermediate wave (B). Intermediate wave (B) should exhibit weakness.
The target for intermediate wave (C) would be at 2,656 where intermediate wave (C) would reach 1.618 the length of intermediate wave (A).
Primary wave 2 may not move beyond the start of primary wave 1 below 2,346.58.
TECHNICAL ANALYSIS
WEEKLY CHART
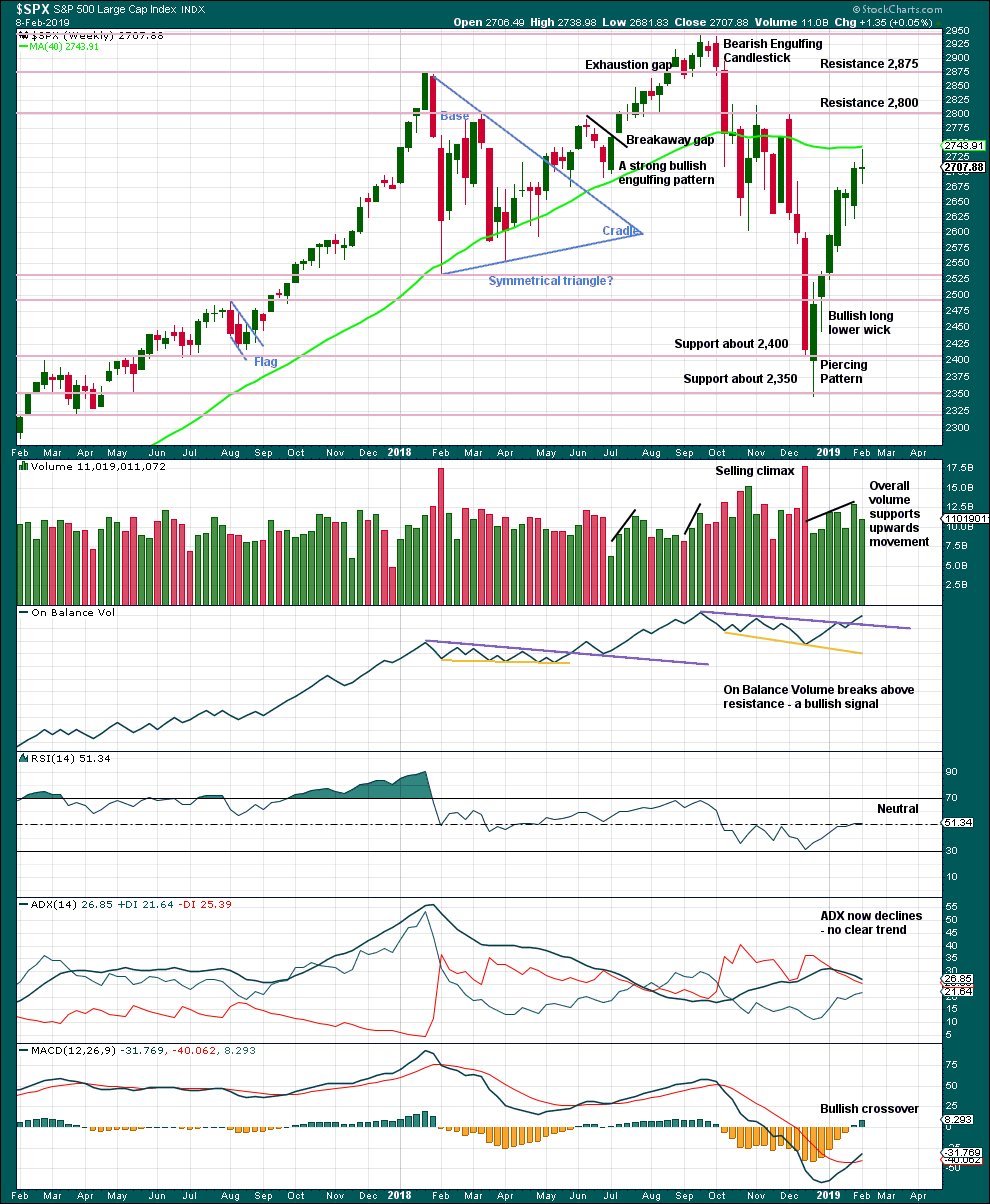
Click chart to enlarge. Chart courtesy of et=”_blank”>StockCharts.com.
From the all time high to the low at the end of December 2018, price moved lower by 20.2% of market value meeting the definition for a bear market.
It should be noted that the large fall in price from May 2011 to October 2011 also met this definition of a bear market, yet it was only a very large pullback within a bull market, which so far has lasted almost 10 years.
Overall, volume supports upwards movement. There is plenty of room for price to rise further.
Last week the long legged doji candlestick puts the trend for now from up to neutral. Risk of a pullback is heightened.
DAILY CHART
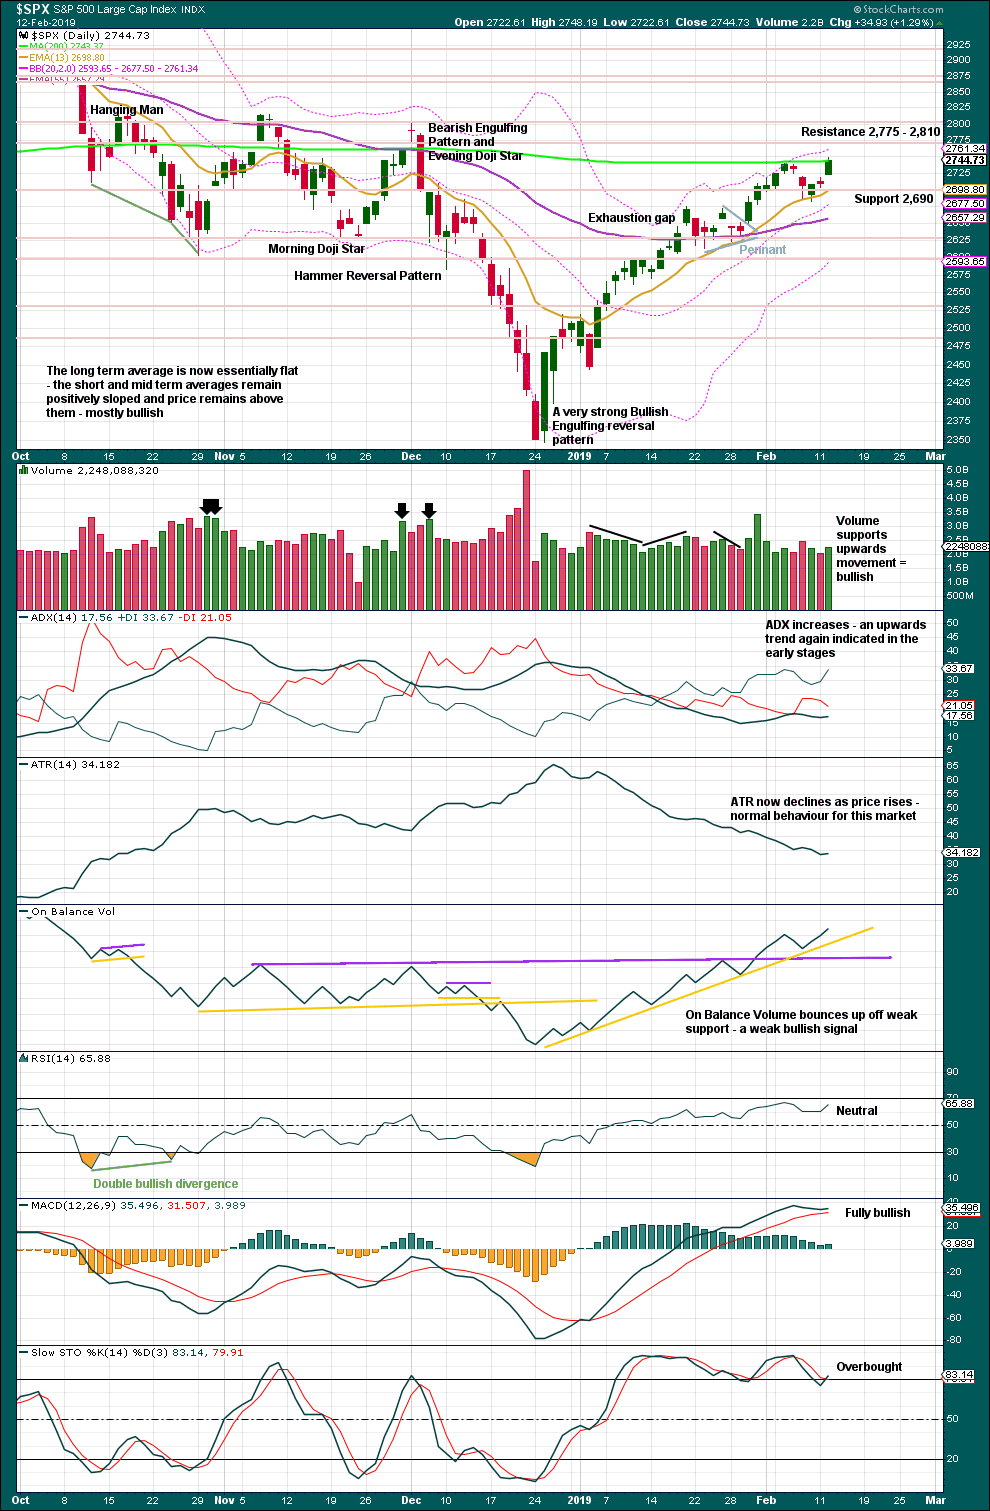
Click chart to enlarge. Chart courtesy of StockCharts.com.
Over a fairly long period of time this ageing bull market has been characterised by upwards movement on light and declining volume and low ATR. For the short to mid term, little concern may be had if price now rises again on declining volume. Current market conditions have allowed for this during a sustained rise in price.
It is also normal for this market to have lower ATR during bullish phases, and strongly increasing ATR during bearish phases. Currently, declining ATR is normal and not of a concern.
Considering the larger picture from the Elliott wave count, some weakness approaching the end of Grand Super Cycle wave I is to be expected.
From Kirkpatrick and Dhalquist, “Technical Analysis” page 152:
“A 90% downside day occurs when on a particular day, the percentage of downside volume exceeds the total of upside and downside volume by 90% and the percentage of downside points exceeds the total of gained points and lost points by 90%. A 90% upside day occurs when both the upside volume and points gained are 90% of their respective totals”…
and “A major reversal is singled when an NPDD is followed by a 90% upside day or two 80% upside days back-to-back”.
The current situation saw two 80% downside days on December 20th and 21st, then a near 90% downside day with 88.97% downside on December 24th. This very heavy selling pressure on three sessions together may be sufficient to exhibit the pressure observed in a 90% downside day.
This has now been followed by two 90% upside days: on December 26th and again on 4th January.
The current situation looks very much like a major low has been found.
Price now looks like it has closed above the 200 day moving average, on an upwards day with some support from volume. Today’s new high looks like a classic upwards breakout from a small pullback within an ongoing upwards trend.
Upwards movement today came with up volume 74% of total volume, the highest since 30th of January. This upwards movement has internal strength.
BREADTH – AD LINE
WEEKLY CHART
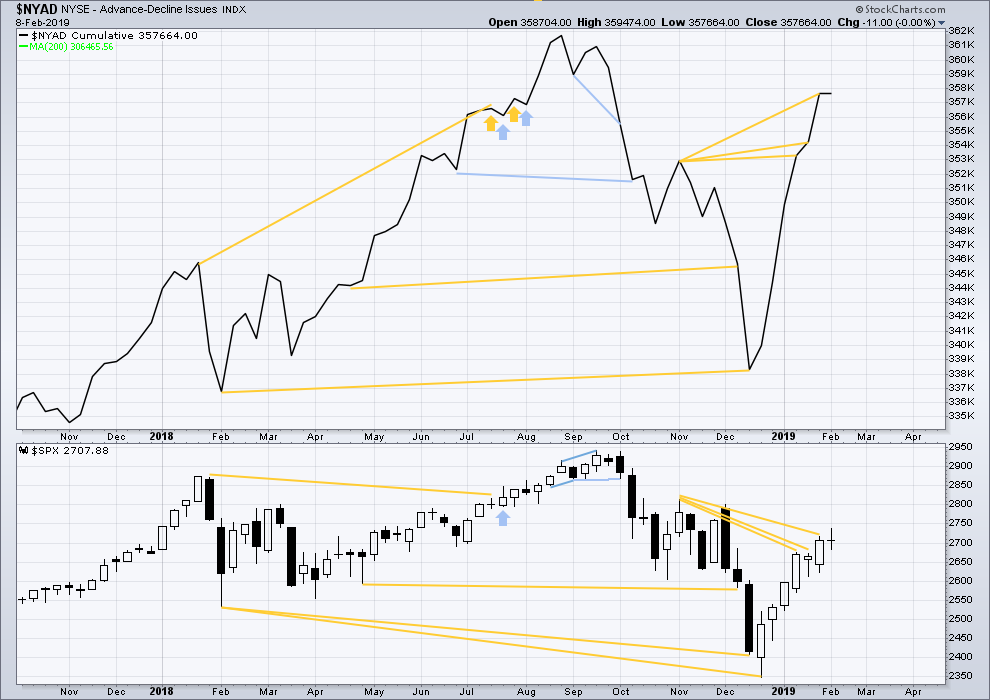
Click chart to enlarge. Chart courtesy of StockCharts.com. So that colour blind members are included, bearish signals
will be noted with blue and bullish signals with yellow.
The AD line has made yet another new high above the prior swing high of the week beginning 5th of November 2018, but price has not. This divergence is bullish for the mid term.
Last week price moved mostly sideways and the AD line is flat. This is considered to exhibit no divergence.
DAILY CHART
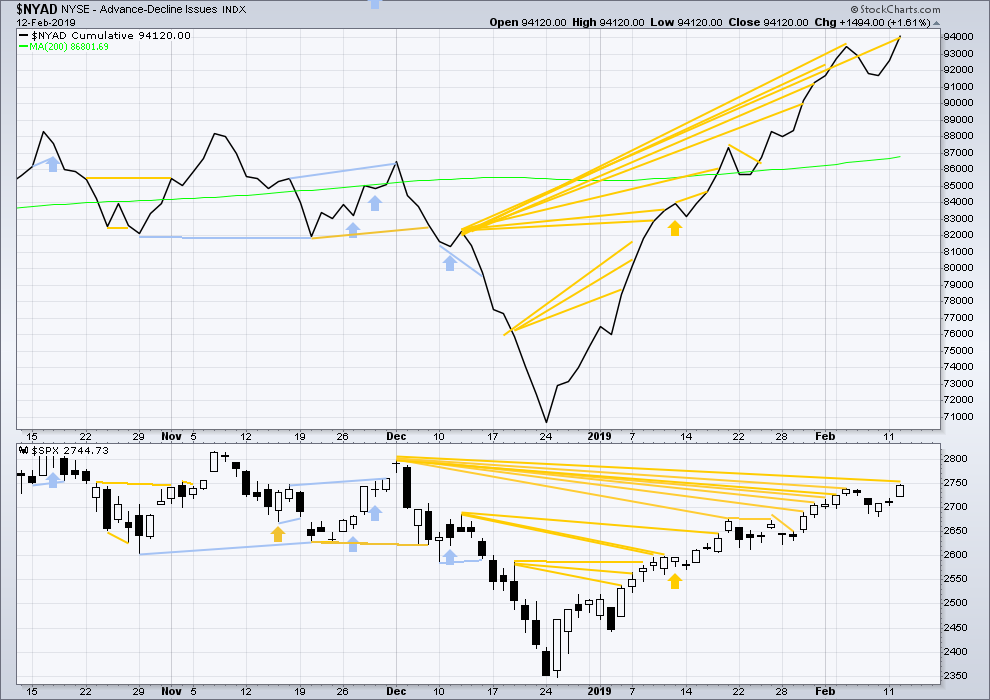
Click chart to enlarge. Chart courtesy of StockCharts.com. So that colour blind members are included, bearish signals
will be noted with blue and bullish signals with yellow.
Breadth should be read as a leading indicator.
There is now a cluster of bullish signals from the AD line. This supports the Elliott wave count.
The AD line has made another new high above the prior swing high of the 3rd of December, but price has not. This continuing divergence is bullish.
VOLATILITY – INVERTED VIX CHART
WEEKLY CHART
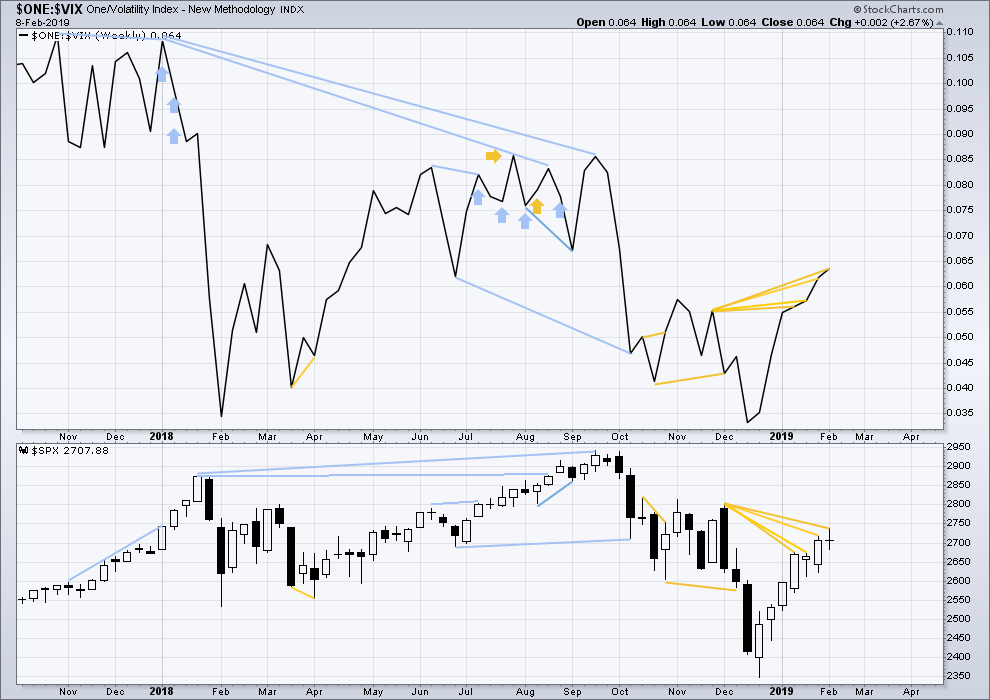
Click chart to enlarge. Chart courtesy of StockCharts.com. So that colour blind members are included, bearish signals
will be noted with blue and bullish signals with yellow.
Inverted VIX has made another new high above the prior swing high of the weeks beginning 26th of November and 3rd of December 2018, but price has not. This divergence is bullish for the mid term.
DAILY CHART
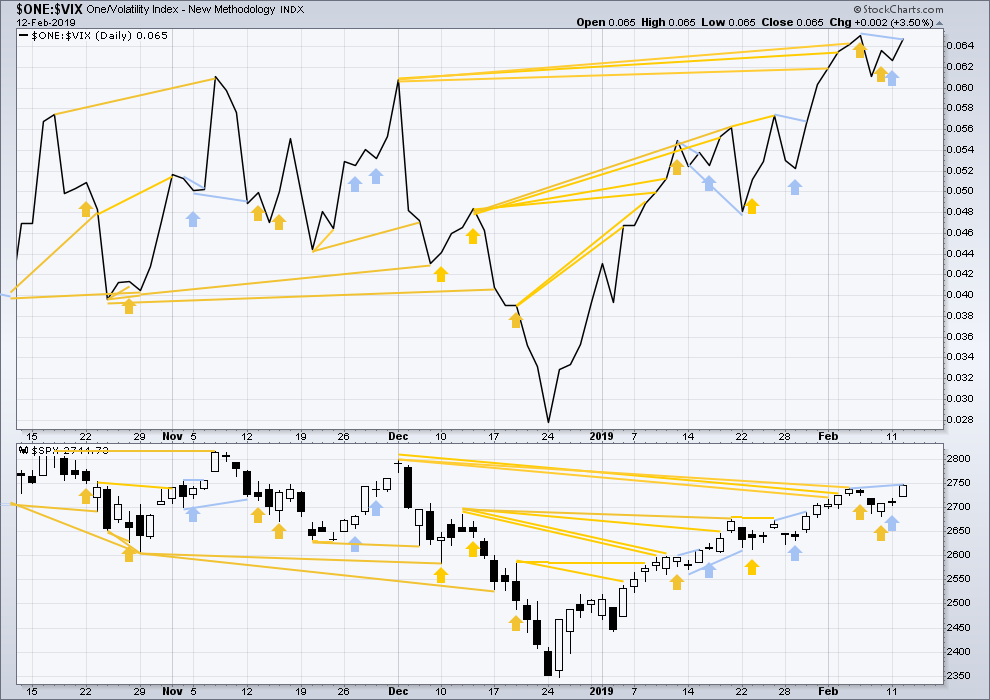
Click chart to enlarge. Chart courtesy of StockCharts.com. So that colour blind members are included, bearish signals
will be noted with blue and bullish signals with yellow.
There is now a cluster of bullish signals from inverted VIX. This supports the Elliott wave count.
Bearish divergence noted in last analysis has been followed by an upwards day. It may have failed.
Today price has made a slight new high above the prior high of the 6th of February, but inverted VIX has not. This divergence is again bearish for the short term.
DOW THEORY
Dow Theory confirms a bear market. This does not necessarily mean a bear market at Grand Super Cycle degree though; Dow Theory makes no comment on Elliott wave counts. On the 25th of August 2015 Dow Theory also confirmed a bear market. The Elliott wave count sees that as part of cycle wave II. After Dow Theory confirmation of a bear market in August 2015, price went on to make new all time highs and the bull market continued.
DJIA: 23,344.52 – a close on the 19th of December at 23,284.97 confirms a bear market.
DJT: 9,806.79 – price has closed below this point on the 13th of December.
S&P500: 2,532.69 – a close on the 19th of December at 2,506.96 provides support to a bear market conclusion.
Nasdaq: 6,630.67 – a close on the 19th of December at 6,618.86 provides support to a bear market conclusion.
Published @ 08:35 p.m. EST.
—
Careful risk management protects your trading account(s).
Follow my two Golden Rules:
1. Always trade with stops.
2. Risk only 1-5% of equity on any one trade.

More reason to watch out just overhead. Yet another 1.272 extension lies very close to the other one already mentioned (2769 and 2775). And where was the last daily pivot high? 2742, a 1.272 extension of one of the prior upswings…these extension are significant. So careful with the axe Eugene if/as SPX gets into the range of 2769-2775. Likely area of a stall, at least.
Hourly chart updated:
Labelling within intermediate wave (5) is slightly relabelled today to see an extended minor 3 within it.
The invalidation point has to remain the same.
Gold continues to give signals that a major (weekly/monthly) swing high right off the major 78.6% is in place (I’m looking at GLD, this is daily). Not confirmed yet though. The move up off the Oct’18 low should be a 5 wave now complete, adding huge weight to the potential of the pivot high being in here. The weekly swing low below is too far away to wait for. The prior daily swing low however is just below the 2018-19 trend line, at 122.19. This trend line is inside the EW channel surrounding the 5 wave.
Taking it early (on the break of the daily low pivot) would be a counter trend trade (monthly and weekly are both in up trends). So an incremental “build a position” as we get further confirmation of the trend change is my approach, starting with that break.
ps: I find it interesting that the first half 2018 down move went to exactly the 78.6% of the prior up move and turned. A dollop more evidence this turn might very well be Significant.
IWM and DJT say up…
So 2762 from 2704 is 1.618 extension of the minor 1 (from 2682 to 2718), so I would say based on the action we have finished the minor 3 of intermediate 5, we are in minor 4.. with target around 2746…
If we get the same move of 58 points (1.618 of minor 1) then we could top around 2804..
That’s my preferred scenario, hoping for a top around 2800-2810.. then P2 to end somewhere around 2600…
Seems like lows & highs both are in for the day,it’s gonna balance around for the day, chop and close around 2653-2657…
Another strong day tomorrow before the top, let’s see..
Maybe low today of 2740.40?
anybody gonna buy the gap fill?
so far c = 1.62 a
nice tail on the 30 min
The 2856 target is where intermediate 5 = intermediate 1.
However, inside this intermediate 5, the target where minor 5 = minor 1 is only about 2779. And when minor 5 completes, “everything” completes (the intermediate 5 and the primary 1).
So there is the higher degree target and the lower degree target…
There’s also a flattening upper channel line just overhead at about 2765.
This. The white horizontal line marks where minor 5 = minor 1.
And I just noticed that the 1.272 extension of the low of the intermediate 3’s minor 4 lowest point to the top of it’s minor 5 is 2775. Quite a confluence of indicators of potential turn in that zone of 2775-2780.
Excellent work today Kevin
I’m shorting any and all strength tomorrow …lol
Sold some vxxb 34 puts today for Friday
Looking at a rolling position if need be there.. and looking at it as a leg to go very “sized “
On any approach close to 32.50 …
Selling large mid March …31-30 put strikes
Also sold some 276-278 call spreads for Friday in spy
Thanks Kevin. I am favoring the lower target based on the visible waves up on the daily charts. The daily charts show the 1st and 2nd waves followed by an extended third wave and 4th wave correction. We are now in the fifth wave and the hourly chart shows we are in the middle of a 3rd wave extension. 2780 looks about right for the completion.
Here is a chart that we’ll call “the view of the forest”. Lara’s comment about “Because we should always assume the trend remains the same, until proven otherwise” is illustrated here. We see the march of the flat-bottomed candlesticks continuing upward at a beautiful pace. Note — the far right candlestick is only 2 days (so far) of this week’s weekly candlestick.
Here is a chart that we’ll call “the view of the trees”. The trade today was capped by the ES 200 day MA, which is the blue line.
For the last month I’ve been calling this uptrend’s target as ES 2860. For the last several sessions I’ve been saying that the up move has failed at its 76.4% fib level and we have entered a fresh downtrend. Today has renewed my bullish bias.
We closed today above the 76.4% fib level. The ES 2860 is still the target. After 76.4, the next thing is the 100% target of 2860. Each fib level on this uptrend has been breached then the market has pulled back and bounced around under the fib level, then moved on to break through the next higher fib level. This is what we have been doing over the last 6 sessions with the 76.4% level.
The levels I’m referring to are the fibs between the December low and the ES 2860 target. Here’s that chart:
The 76% target is what the machines aim for to dislodge traders using the old 61.8% target. Traders are increasingly aware of this scheme to they just might push it a bit past. I think we likely get a turn down this week after an intra-day jump past the 200 dsma.
Hats off to you if we do indeed tag the 2820-2860 region!
Since you posted that Verne, we are already trading above the ES 200 dma. Looking at the daily chart of this runup since December, I notice that they have been using 5 days of flat-bottom (or close to flat-bottom) candles to thrust up to their next target. If today’s (as in today the evening of the 12th and the day of the 13th) new daily candle stays flat bottomed, that would make it the “thrust candle #1”. Right now, we’re a bit more than 100 points from the target. I’m always over-optimistic about this stuff, but it seems very possible. A couple of good short squeezes and a climactic run-up burst should do it.
They just need china trade agreement and it will reachbthe target in 1 day… lol ?
As I mentioned the headline risks remain this week but I too think that 2860 is tad optimistic, I have had my eye on 2800-2810, which has been significant resistance and the drop from 2800 to 2600 will complete a right shoulder of a very good looking H&S with targets in 3200s
They don’t need a whole day, just a massive gap higher should do it.
Great to see traders who know what’s going on… 🙂
Hey Hash_trader,
I appreciate what you’re saying but I think the potential China trade agreement is over-hyped. The last trade agreement we did was the USMCA (United States-Mexico-Canada Agreement) which replaced the NAFTA (North American Free Trade Agreement). That was completed at the end of September 2018. And then the market fell off a cliff.
Everyone assumes that any new China deal will favor the USA. The China tariffs that are in effect now are paid by US companies. China has negotiating leverage. President Xi Jinping of China is president for life. President Trump has less than 2 years to go.
But whatever. I agree with Lara when she says, the news is presented to fit what the markets do; not the other way around.
Aren’t there massive new tariffs that get added if this current effort at an agreement fails? I thought so. And I would suspect that that would indeed tank the markets. Such would not be an EW problem here: the market could start tanking right now and we’ve got sufficient/reasonable structure to call it a complete primary 1 up, I believe. So while the news fits the EW count…the EW count also fits the news. The problem with the news fits the EW count argument is that in its most simplistic form, it requires an assumption that there is only one “correct” EW model (i.e., EW gives us a prediction) and it will all play out as “ordained”. But we all know that’s not at all how it works. The future is not written in stone, and as events and sentiment drive the market in the future…it will play out in SOME kind of EW structure. But not necessarily the one we think is highest probability as of this moment.
Yesterday’s headline: Trump says he may not stick to March deadline on China tariffs.
That’s true.
There is only one correct wave count eventually. But until it’s complete we can’t know for sure what that is.
That’s the nature of probability, sadly.
The next significant fibo level overhead is the 78.6% of the entire Oct-Dec downswing, at about 2812. Very close to a key pivot high (“100% fibo”) at 2814, and other extensions as well (the 1.618 of the intermediate 3’s minor 4 low to minor 5 high is at 2819).
The 74% and 78% levels of the smaller swings are indeed blown. I rarely find the 74% level to be significant. On the other hand, I find the 78.6% level to be VERY significant, very often.
If price gets above 2800, I’ll be shocked to see movement straight up and through the 2812-2820 zone. There “should” be at a minimum some significant consolidation first under that, if not a major pivot turn. That said…market action speaks. We’ll see!!