
A small bounce to end close to 2,717.15 was expected for Monday. Upwards movement has reached slightly above this to a high at 2,718.05 for the session.
Summary: A breach of the black Elliott channel has indicated primary wave 2 has arrived.
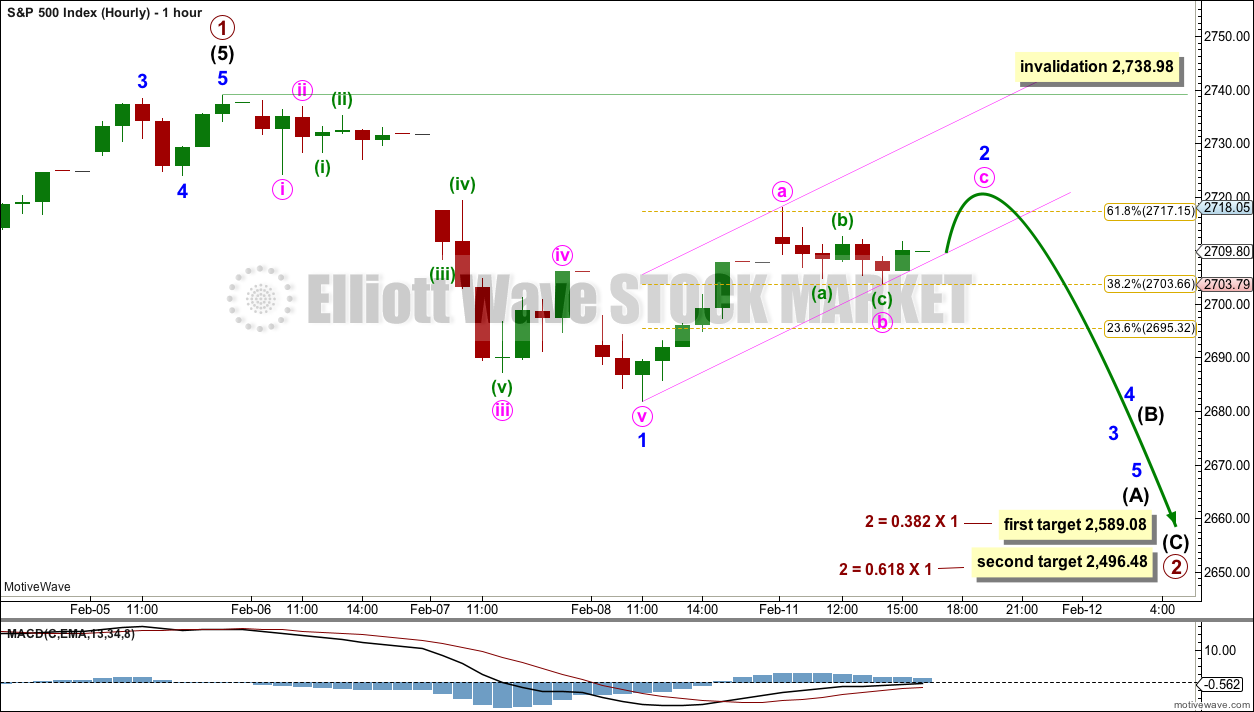
Primary wave 2 may last about a Fibonacci 13, 21 or 34 sessions in total. The first target is the 0.236 Fibonacci ratio at 2,646; it is possible that primary wave 2 could be more brief and shallow than expected. The next target is the 0.382 Fibonacci ratio of primary wave 1 about 2,589. The last target is the 0.618 Fibonacci ratio about 2,496.
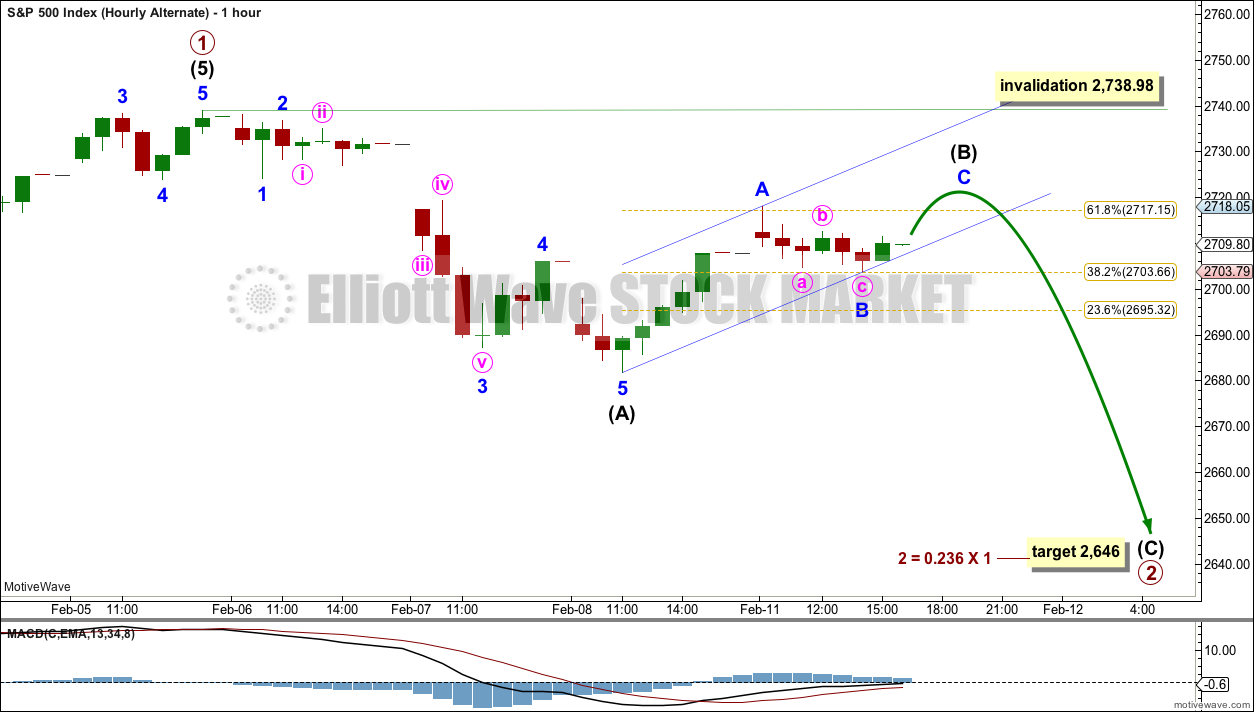
Today an alternate hourly wave count looks at the possibility that primary wave 2 may be more brief and shallow than originally expected.
The bigger picture still expects that a low may now be in place. At its end, primary wave 2 may offer a good entry opportunity to join the upwards trend.
The target is at 3,045 with a limit at 3,477.39.
New updates to this analysis are in bold.
The biggest picture, Grand Super Cycle analysis, is here.
The monthly chart was last published here.
ELLIOTT WAVE COUNT
WEEKLY CHART
Click chart to enlarge.
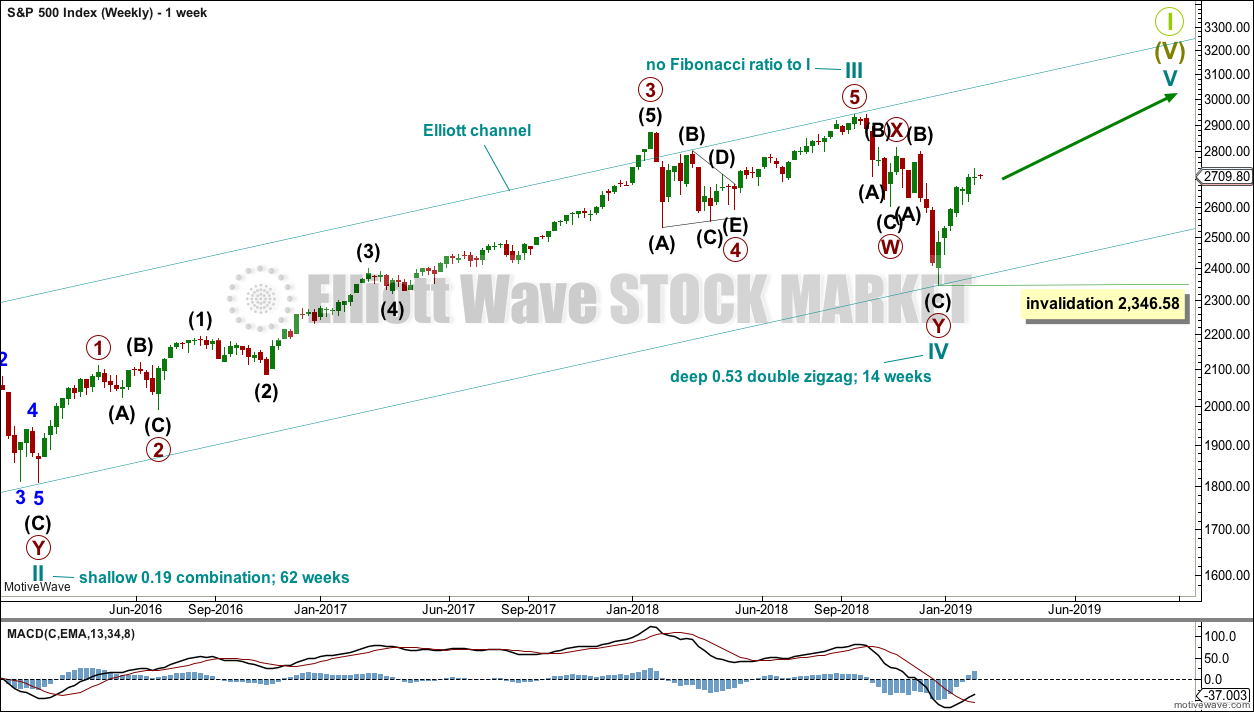
This weekly chart shows all of cycle waves III, IV and V so far.
Cycle wave II fits as a time consuming double combination: flat – X – zigzag. Combinations tend to be more time consuming corrective structures than zigzags. Cycle wave IV has completed as a multiple zigzag that should be expected to be more brief than cycle wave II.
Cycle wave IV may have ended at the lower edge of the Elliott channel.
Within cycle wave V, no second wave correction may move beyond the start of its first wave below 2,346.58.
Although both cycle waves II and IV are labelled W-X-Y, they are different corrective structures. There are two broad groups of Elliott wave corrective structures: the zigzag family, which are sharp corrections, and all the rest, which are sideways corrections. Multiple zigzags belong to the zigzag family and combinations belong to the sideways family. There is perfect alternation between the possible double zigzag of cycle wave IV and the combination of cycle wave II.
Although there is gross disproportion between the duration of cycle waves II and IV, the size of cycle wave IV in terms of price makes these two corrections look like they should be labelled at the same degree. Proportion is a function of either or both of price and time.
Draw the Elliott channel about Super Cycle wave (V) with the first trend line from the end of cycle wave I (at 2,079.46 on the week beginning 30th November 2014) to the high of cycle wave III, then place a parallel copy on the low of cycle wave II. Cycle wave V may find resistance about the upper edge.
DAILY CHART
Click chart to enlarge.
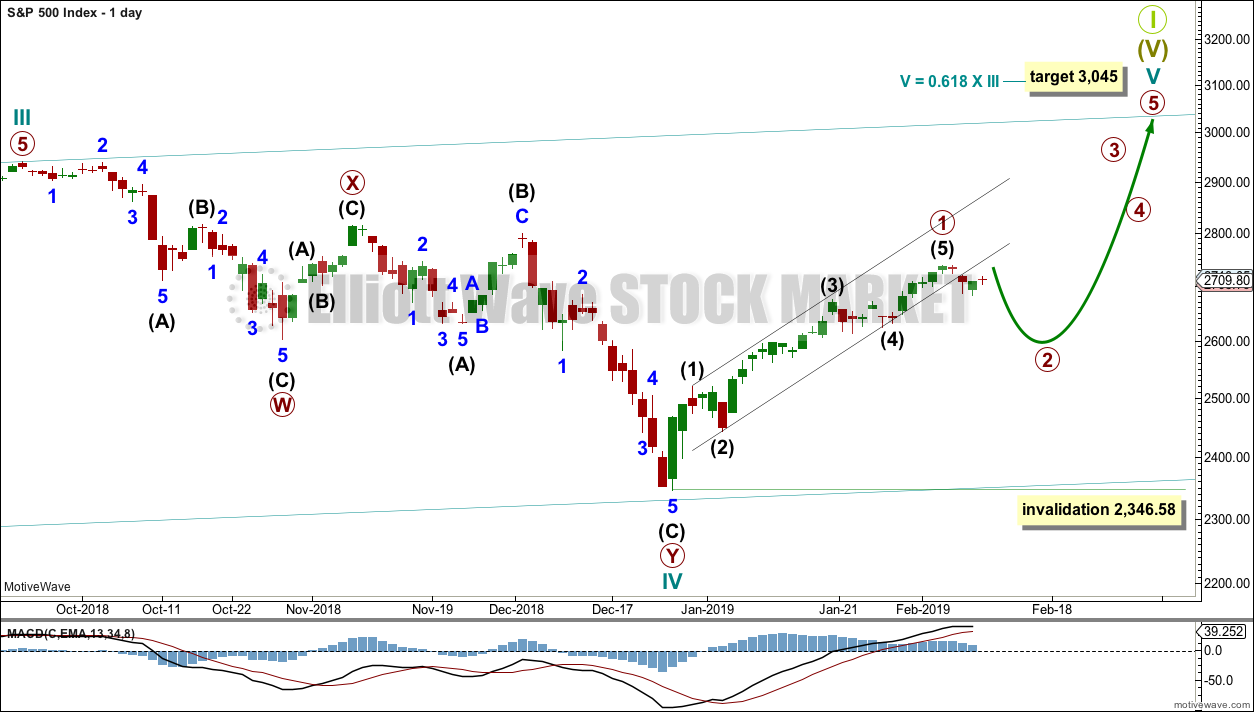
The daily chart will focus on the structure of cycle waves IV and V.
Cycle wave IV now looks like a complete double zigzag. This provides perfect alternation with the combination of cycle wave II. Double zigzags are fairly common corrective structures.
Within Super Cycle wave (V), cycle wave III may not be the shortest actionary wave. Because cycle wave III is shorter than cycle wave I, this limits cycle wave V to no longer than equality in length with cycle wave III at 3,477.39. A target is calculated for cycle wave V to end prior to this point.
Cycle wave V must subdivide as a five wave motive structure, either an impulse or an ending diagonal. An impulse is much more common and that will be how it is labelled. A diagonal would be considered if overlapping suggests it.
Within the five wave structure for cycle wave V, primary wave 1 may now be complete. Primary wave 1 lasted 27 sessions. Primary wave 2 may exhibit good proportion if it lasts a Fibonacci 13, 21 or 34 sessions. Primary wave 2 would most likely subdivide as a zigzag, but it may be any corrective structure except a triangle.
Primary wave 2 may not move beyond the start of primary wave 1 below 2,346.58.
A new low below the start of intermediate wave (5) at 2,631.05 would add further confidence that primary wave 1 is over and primary wave 2 has begun.
HOURLY CHART
Click chart to enlarge.
The most likely structure for primary wave 2 would be a zigzag. Intermediate wave (A) would most likely subdivide as a five wave structure, most likely an impulse. Within intermediate wave (A), minor wave 2 may not move beyond the start of minor wave 1 above 2,738.98.
Minor wave 2 may be incomplete. Downwards movement to the last small swing low looks like a complete three wave structure, which may be minute wave b within minor wave 2.
A small channel is drawn about minor wave 2. If price breaks below the lower edge of this channel, that may be taken as an indication that minor wave 2 should be over and minor wave 3 should be underway, whether or not a new high above 2,718.05 is reached first.
The labelling within primary wave 2 may change as it unfolds. It is impossible to tell at this stage which Elliott wave structure it may take.
ALTERNATE HOURLY CHART
Click chart to enlarge.
This alternate wave count looks at the possibility that primary wave 2 may be more brief and shallow than originally expected. It is possible that it could complete within a total Fibonacci 5 or 8 sessions. So far it has lasted 3.
The first target for primary wave 2 would be the 0.236 Fibonacci ratio.
TECHNICAL ANALYSIS
WEEKLY CHART
Click chart to enlarge. Chart courtesy of et=”_blank”>StockCharts.com.
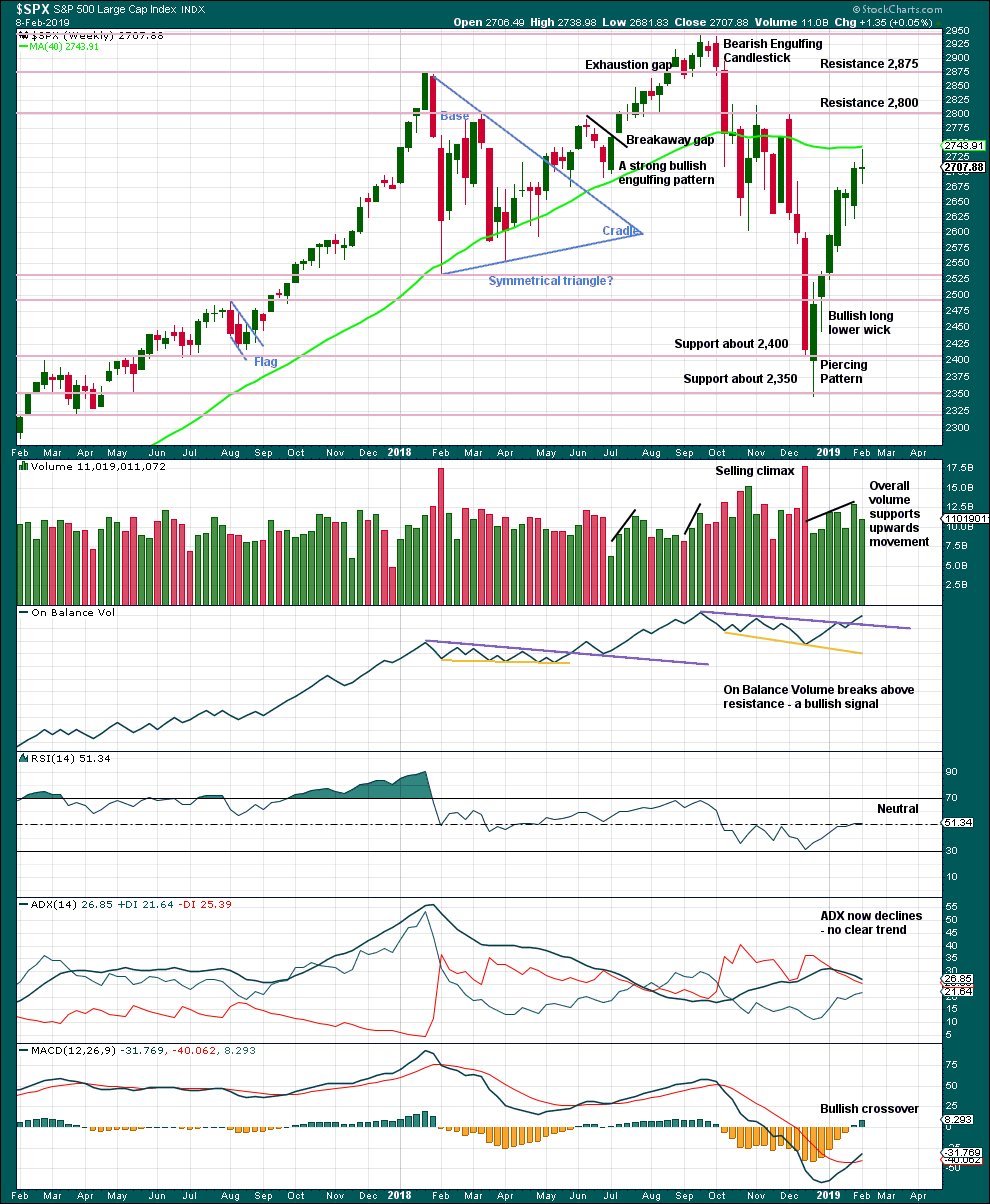
From the all time high to the low at the end of December 2018, price moved lower by 20.2% of market value meeting the definition for a bear market.
It should be noted that the large fall in price from May 2011 to October 2011 also met this definition of a bear market, yet it was only a very large pullback within a bull market, which so far has lasted almost 10 years.
Overall, volume supports upwards movement. There is plenty of room for price to rise further.
Last week the long legged doji candlestick puts the trend for now from up to neutral. Risk of a pullback is heightened.
DAILY CHART
Click chart to enlarge. Chart courtesy of StockCharts.com.
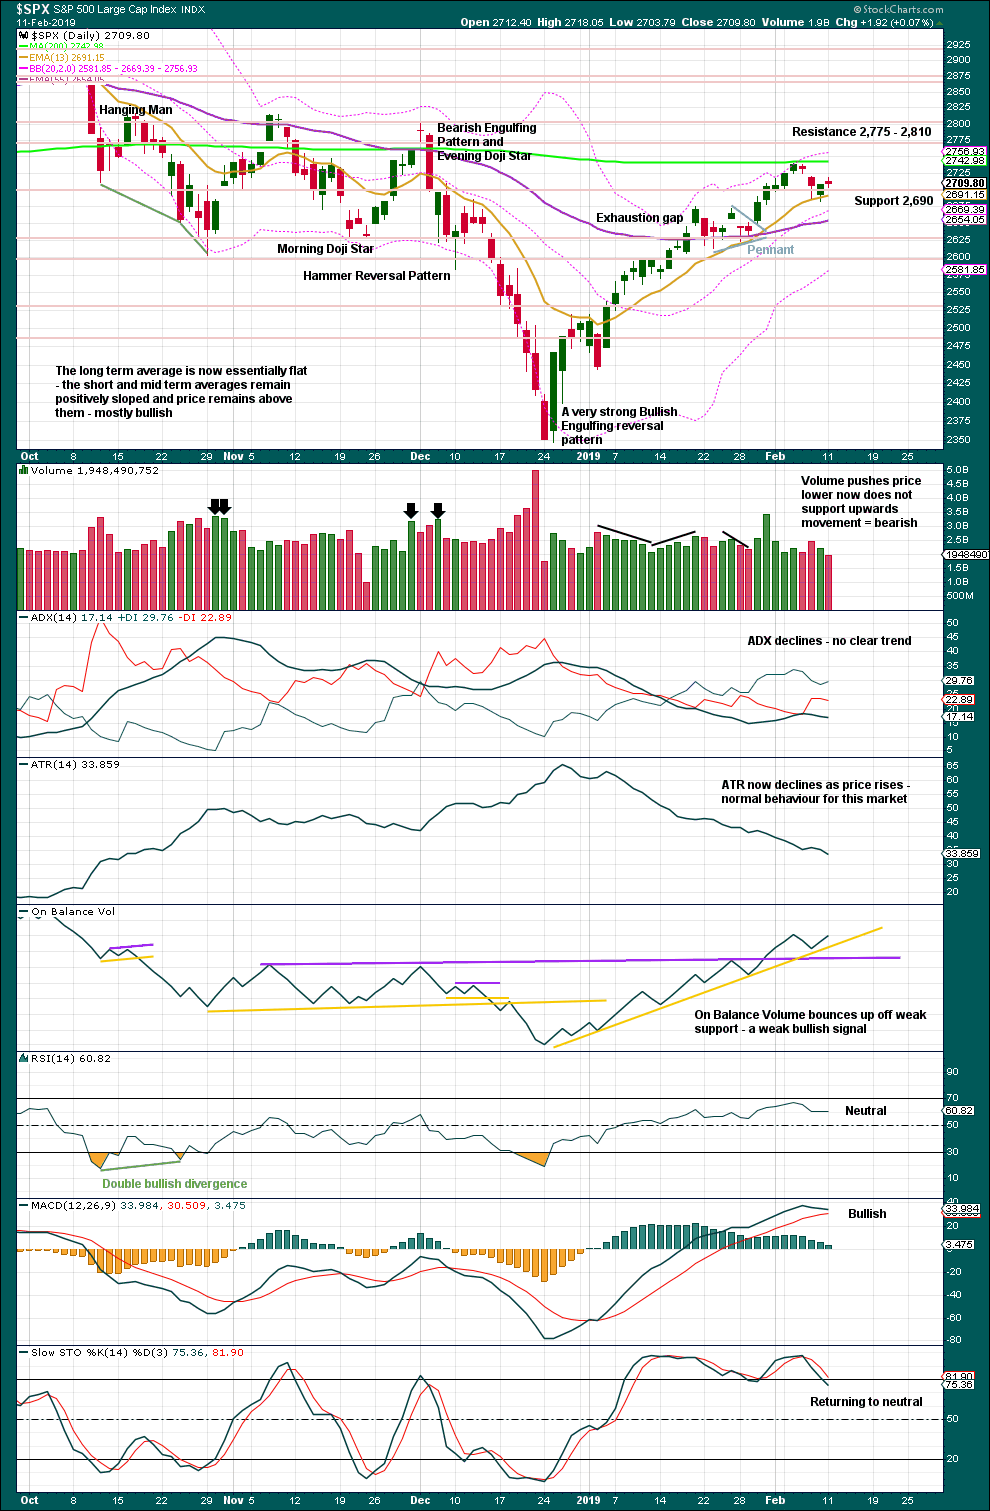
Over a fairly long period of time this ageing bull market has been characterised by upwards movement on light and declining volume and low ATR. For the short to mid term, little concern may be had if price now rises again on declining volume. Current market conditions have allowed for this during a sustained rise in price.
It is also normal for this market to have lower ATR during bullish phases, and strongly increasing ATR during bearish phases. Currently, declining ATR is normal and not of a concern.
Considering the larger picture from the Elliott wave count, some weakness approaching the end of Grand Super Cycle wave I is to be expected.
From Kirkpatrick and Dhalquist, “Technical Analysis” page 152:
“A 90% downside day occurs when on a particular day, the percentage of downside volume exceeds the total of upside and downside volume by 90% and the percentage of downside points exceeds the total of gained points and lost points by 90%. A 90% upside day occurs when both the upside volume and points gained are 90% of their respective totals”…
and “A major reversal is singled when an NPDD is followed by a 90% upside day or two 80% upside days back-to-back”.
The current situation saw two 80% downside days on December 20th and 21st, then a near 90% downside day with 88.97% downside on December 24th. This very heavy selling pressure on three sessions together may be sufficient to exhibit the pressure observed in a 90% downside day.
This has now been followed by two 90% upside days: on December 26th and again on 4th January.
The current situation looks very much like a major low has been found.
For the short term, price has found resistance at the 200 day moving average. Downwards movement here should be assumed to be another correction within an ongoing upwards trend until proven otherwise.
BREADTH – AD LINE
WEEKLY CHART
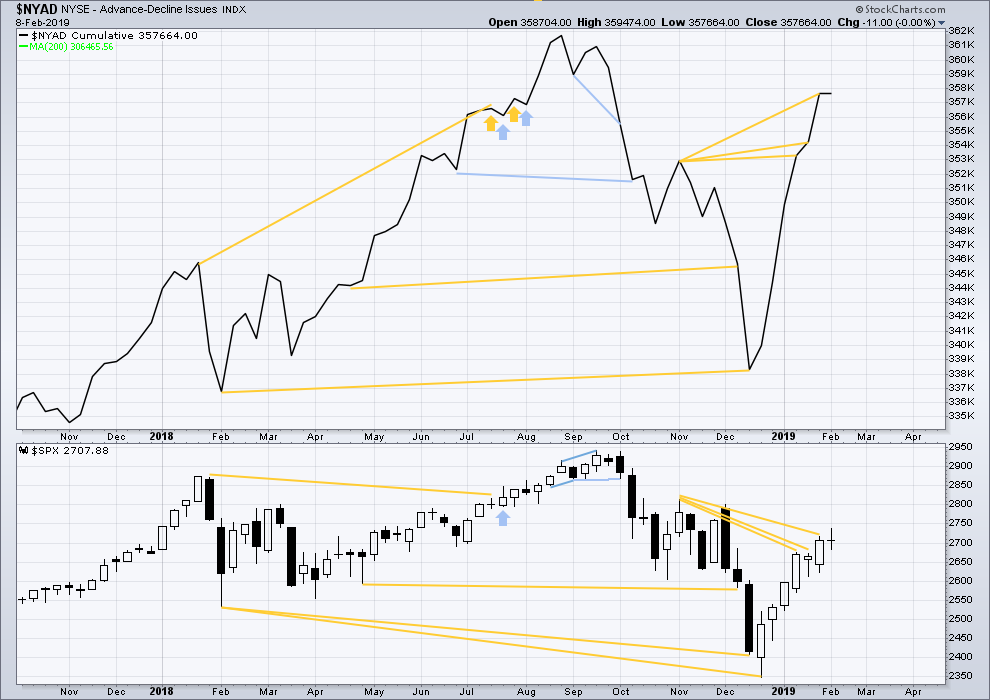
Click chart to enlarge. Chart courtesy of StockCharts.com. So that colour blind members are included, bearish signals
will be noted with blue and bullish signals with yellow.
The AD line has made yet another new high above the prior swing high of the week beginning 5th of November 2018, but price has not. This divergence is bullish for the mid term.
Last week price moved mostly sideways and the AD line is flat. This is considered to exhibit no divergence.
DAILY CHART
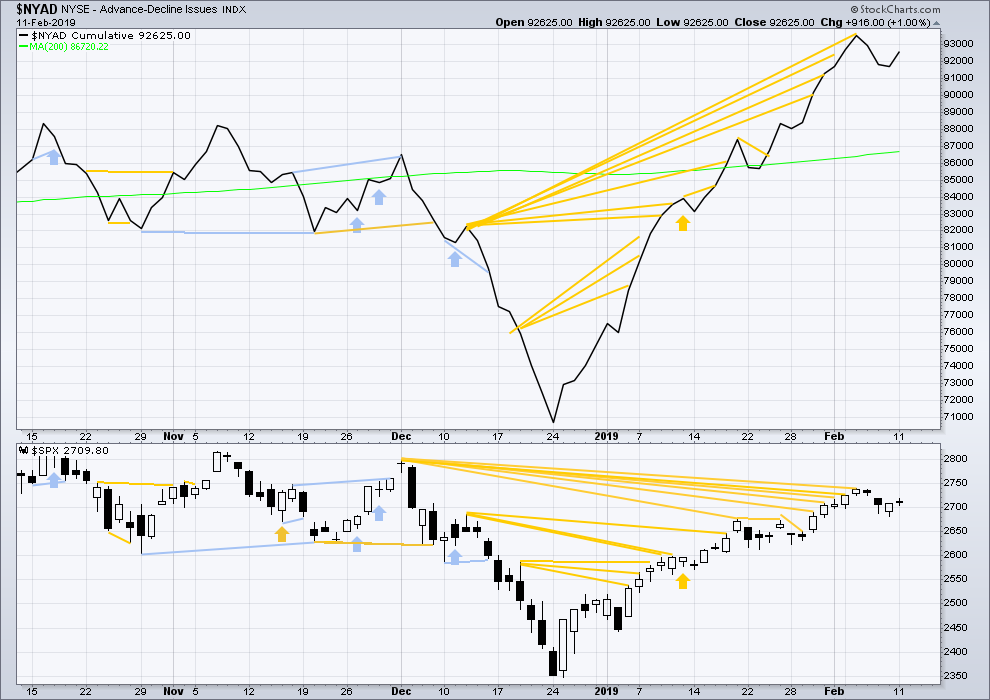
Click chart to enlarge. Chart courtesy of StockCharts.com. So that colour blind members are included, bearish signals
will be noted with blue and bullish signals with yellow.
Breadth should be read as a leading indicator.
There is now a cluster of bullish signals from the AD line. This supports the Elliott wave count.
Today both price and the AD line moved higher. There is no new short-term divergence.
VOLATILITY – INVERTED VIX CHART
WEEKLY CHART
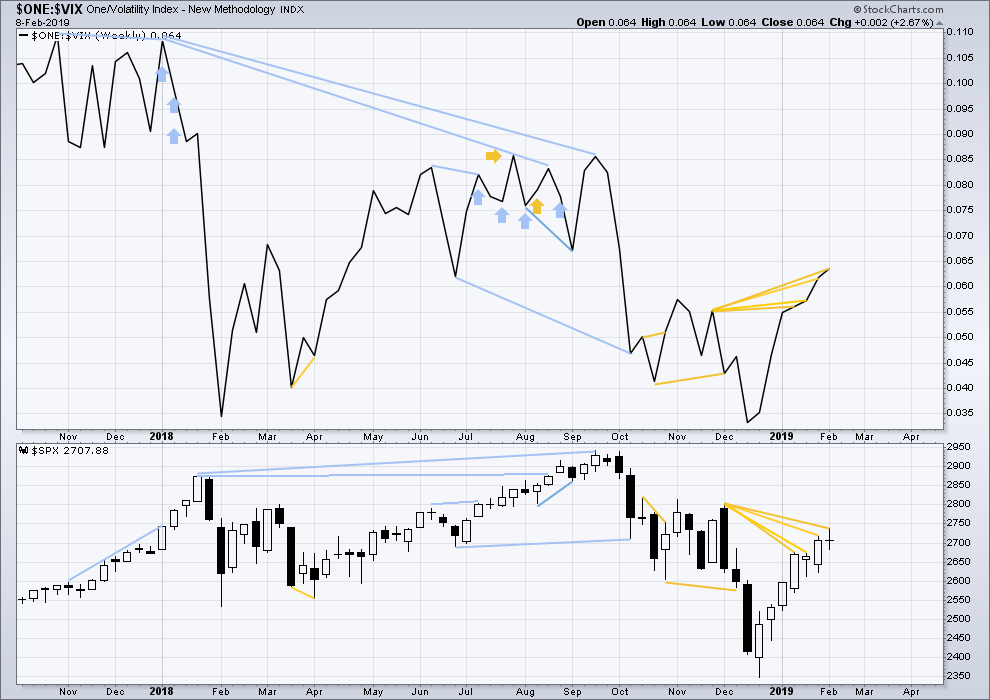
Click chart to enlarge. Chart courtesy of StockCharts.com. So that colour blind members are included, bearish signals
will be noted with blue and bullish signals with yellow.
Inverted VIX has made another new high above the prior swing high of the weeks beginning 26th of November and 3rd of December 2018, but price has not. This divergence is bullish for the mid term.
DAILY CHART
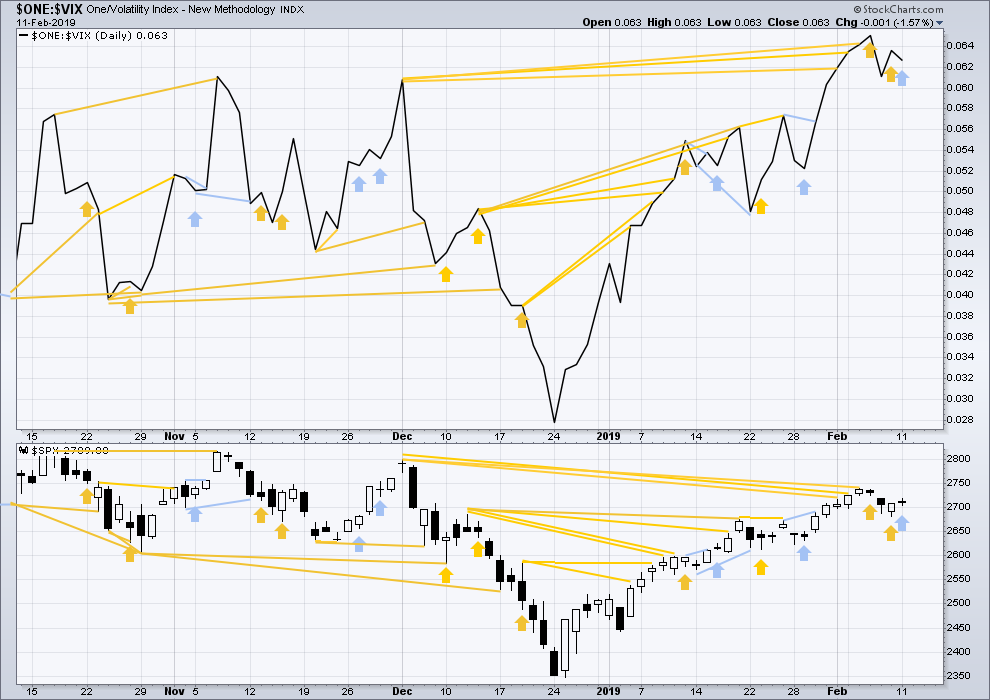
Click chart to enlarge. Chart courtesy of StockCharts.com. So that colour blind members are included, bearish signals
will be noted with blue and bullish signals with yellow.
There is now a cluster of bullish signals from inverted VIX. This supports the Elliott wave count.
Bullish divergence noted in last analysis has been followed by an upwards day. It may be resolved here.
Today price moved higher, but inverted VIX has moved lower. This divergence is bearish for the short term.
DOW THEORY
Dow Theory confirms a bear market. This does not necessarily mean a bear market at Grand Super Cycle degree though; Dow Theory makes no comment on Elliott wave counts. On the 25th of August 2015 Dow Theory also confirmed a bear market. The Elliott wave count sees that as part of cycle wave II. After Dow Theory confirmation of a bear market in August 2015, price went on to make new all time highs and the bull market continued.
DJIA: 23,344.52 – a close on the 19th of December at 23,284.97 confirms a bear market.
DJT: 9,806.79 – price has closed below this point on the 13th of December.
S&P500: 2,532.69 – a close on the 19th of December at 2,506.96 provides support to a bear market conclusion.
Nasdaq: 6,630.67 – a close on the 19th of December at 6,618.86 provides support to a bear market conclusion.
Published @ 09:24 p.m. EST.
—
Careful risk management protects your trading account(s).
Follow my two Golden Rules:
1. Always trade with stops.
2. Risk only 1-5% of equity on any one trade.
Two ideas at the hourly chart level.
Because we should always assume the trend remains the same, until proven otherwise, with a new high today let us consider primary wave 2 as possibly over.
Although, when I look at this on the daily chart level it looks impossibly brief and shallow.
This is a tentative idea this morning only. I need more time to consider alternatives for this count.
If the correction is over and a new impulse up is underway, then the invalidation point is where 4 may not move into 1.
Alternatively, as some members have noticed below, what if primary wave 2 is an expanded flat?
This would have better proportion.
The key is in today’s high. For a classic upwards breakout (main count above) it needs to have support from volume, even in current market conditions.
If there is any weakness in upwards movement today then this may be the main wave count, it would indicate a B wave.
Now, I could also move the degree of labelling for this alternate idea down one. Minor wave A may only be completing as an expanded flat. It may also be minor wave W as the first structure within a double combination.
That would have the best proportion of all. It would be a very shallow sideways consolidation to last a few more weeks.
Thanks Lara.
There seems to be divergences on a lot of timeframes with the highs today, which is generally sign of 5th of 5th… is it possible that we are in the final 5th wave of intermediate 5 of primary 1..
And P2 about to start??
Just thinking out loud here.
On a weekly chart it sure does look like a huge three wave downward move.
WHAT IF….we are now in a huge B wave up (perhaps even just the a leg!) with a b down, c up of B yet to come….THEN…the mother of all C waves down to complete a P4??
Verne as Lara said due to internal strength, it doesn’t seem like a B wave…
I am TBH really confused now with the break of highs today.. even so more now as it’s not getting a follow through..
As move down from 2739 clearly seemed like a 5 wave down…
Cashed in 271.5 calls.
Scaling out of short 272 puts.
No reversal signals yet but bearish divergences persist at new highs.
Coming move down will likely be very violent….
there we go – boom! main count invalidated.
Presumably this is still Primary 1.
Ok. But that was a 5 wave down?.?.?
Probably gonna be A down , B triangle, Massive C?
Other ways to count it…
Impulsive looking declines have been getting negated for quite some time now and should always be viewed with suspicion absent other confirming metrics…
Minor 2 could be an expanded flat, with its B wave making a new high. I hate those structures!
But there’s too much strength in the market. I just don’t see price turning around and crashing down to 2600 here…
I am thinking Minor 2 cannot violate the beginning of Minor 1 no matter what the count or pattern. Main count is invalidated.
Ari might be right. I can see this labeled as possibly an expanded flat – three down complete at 2681.83, three up almost complete, with a nice downward C coming real soon.
I could be missing some critical element at the moment. Lara will set us straight soon enough.
If that is the case, and it certainly may be, the current correction would need to be labeled as a Intermediate 4 down since the Feb 5th high of 2739 labeled as the end of Intermediate 3. Following the completion of this Intermediate 4 correction Intermediate 5 up to 2800 or so would complete Primary 1.
Perhaps the chart below gives some clarification. Because of the time length of Intermediate 2, I would favor, Intermediate 4 as being over.
This is pretty much what Hash_trader proposed last night. Looks plausible to me. (As always, I happily defer to the brighter bulbs here, especially Lara.)
One could have said the exact same thing about the Sept ’17 – Jan ’18 period of the market (re: “there’s too much strength in the market”). One of the very few periods that has similar massive upward momentum. And we know what followed.
An interesting comment in Ciovacco’s video last weekend was the following: think about the “bad news” that tanked the market (if you believe news has anything to do with market moves) back in mid-Dec. It virtually was no news: Powell merely restating the Fed position. Now imagine truly BAD news hitting the market…
Another way of viewing the situation: while volatility as measured by option pricing is way down…actual price volatility at the daily/weekly level is still sky high. Since the star of the sell off in October, the market has been hurking and jerking with incredible momentum, up and down and up again. Is that over???? I think it’s over when it is over…that is, when price movement becomes reasonably “slow and incremental” again. That’s not the current state; price is still in a violent up move (since the December low).
Ergo, as I see it, conditions are ripe for more extremely violent price moves.
The gap down on Feb. 7th is closed and we are only a few points from 2739 where the main daily and hourly counts will be invalidated. It is not looking good at this point for the bears.
Yes. Strong resistance though at 2739, and the market is demonstrating that now. And now there’s a double top structure in place on the daily chart. The market loves to maximize uncertainty, and this would be it. The primary 2 isn’t invalidated until it is, and it’s a perfect ABC corrective minor 2 up so far.
That is all correct and I concur. But we are seeing a lot of strength the last two days. If it holds, fine. If not, I think we have a ways to go to the upside. Right now is a good shorting opportunity with very limited upside risk if one uses 2740 as a stop loss point. Reward would be at least a move to 2650 and perhaps much more. Risk is about 7 SPX points.
Price action today is a also a “from below” retest of the old lower EW channel line. Scribbled on a tad at the 1 and 5 minute level.
I think it is the third retest from the underside. My chart shows price back inside the channel as of now. However, my channel lines may not match yours or Lara’s. Well, I gotta go. We will see what happens the rest of the day.
kaboom.
2750 a probable magnet…
I did some analysis and due to headlines risk from china this week, had a path in mind for price movement…
What if the 2739 high was intermediate (3) of P1, and we are now in (4) which should end about 2630 (previous range low & strong support) then we could have a strong move in (5) to 2804 to end P1.. & breaching 200MA for first time..
Then we end P2 around 2600, (that would trap all the shorts below 2600, same way they trapped all longs above 2800).. & move strongly in P3 and move back from 2600 to 2800 level would create a nice H&S pattern with target of around 3266..
That could be the high of this cycle…
I’ll post a chart if i can later
Well that blew out of the water
My new surfboard. Introducing… the Blue Whale. 8’5″, rounded nose for nose riding, rocker mostly in the nose. I’m finding it super easy to catch waves on, no problems. It’s over 1′ smaller than I’m used to.
Cesar did the artwork for me.
New surfboard. New home. I feel like a new woman!
That’s a Cruzer! Cool artwork
Wow, cool board, enjoy surfing…
I wish i could move to NZ
So happy for you Lara.
Few things as exciting as moving into a new home. NZ is a favorite destination for lots of folk with very deep pockets and they have driven prices there sky- high, so congrats on your new place.
I was hoping Peter Jackson would turn the LOTR site into a park. I may come vist anyway. R.E. should be more affordable there in a few years, as is the case in Australia.
I’m expecting a crash in our property market. Everyone here is all in, either directly or via their Kiwi Saver funds (our retirement savings plan). Most Kiwis insist that property prices never go down really, not by much and not for long anyway.
In the crash of 2007 – 2009 our property market didn’t drop much. It then sat flat, and now has been rising quickly.
Looks like a bubble. Behaves like a bubble. Yep. It’s a bubble.
Cesar and I are patiently saving and waiting for the bubble to burst. The home we’re living in right now is owned by a family member so that feels nice.
Awesome! I think you are definitely going go have a great buying opportunity in another year or two.
Good luck and enjoy. Cesar has a creative talent.
Fun shape!
IKR! Single fin, pin tail, big fat nose, hollowed out underside. It’s really loose, thick so has heaps of flotation for fast paddling. Darn thing is almost catching waves for me! I love my new board
Very trippy, Love it!
Ideally we see a gap higher tomorrow. This provides a second marker for confirmation of the next wave down as it would allow for multiple price pivots to be impulsively breached. Set-ups do not come any better…! 🙂
Are you shorting the open?
Added 271.5 calls yesterday.
Holding big 270/272 bull put credit spread. If we close above 2700 will roll spread up one strike. If we close below, get a reversal signal, or get a gap higher in VIX, or even just a strong green candle will exit short puts. Already cashed im ES contracts…. 🙂
Yippee. #1 again. Much better than being #2. That is a crappy place. But thinking that way it may not be much better being called #1.
Yer clock’s 1 minute and 1 second too fast Doc!
BTW, the crappy place would be turd, Doc…
Got it. I feel so much better now.
Actually, I am not sleeping well these days. My surgical shoulder joint gets very stiff and painful when I am in the same position for several hours. Thus I wake up often and my sleep is disturbed. Then I feel crappy. Fortunately I can make my own schedule / office hours etc and get a nap during the day if needed.
To top it all off, after experiencing a very mild winter so far, we are now getting some of the global cooling, grand solar minimum effects, and the new ice age that has reared its ugly head the last several months across the globe. We are shut in by the winter. Better get out the snow shoes!