
A breach of an important channel changes the mid-term outlook for the S&P today. Members were warned yesterday that the risk of a pullback was heightened.
Summary: A breach of the black Elliott channel has indicated primary wave 2 has arrived.
Primary wave 2 may last about a Fibonacci 21 or 34 sessions in total. The first target is the 0.382 Fibonacci ratio of primary wave 1 about 2,580. The second target is the 0.618 Fibonacci ratio about 2,491.
The bigger picture still expects that a low may now be in place. At its end, primary wave 2 may offer a good entry opportunity to join the upwards trend.
The target is at 3,045 with a limit at 3,477.39.
New updates to this analysis are in bold.
The biggest picture, Grand Super Cycle analysis, is here.
The monthly chart was last published here.
ELLIOTT WAVE COUNT
WEEKLY CHART
Click chart to enlarge.
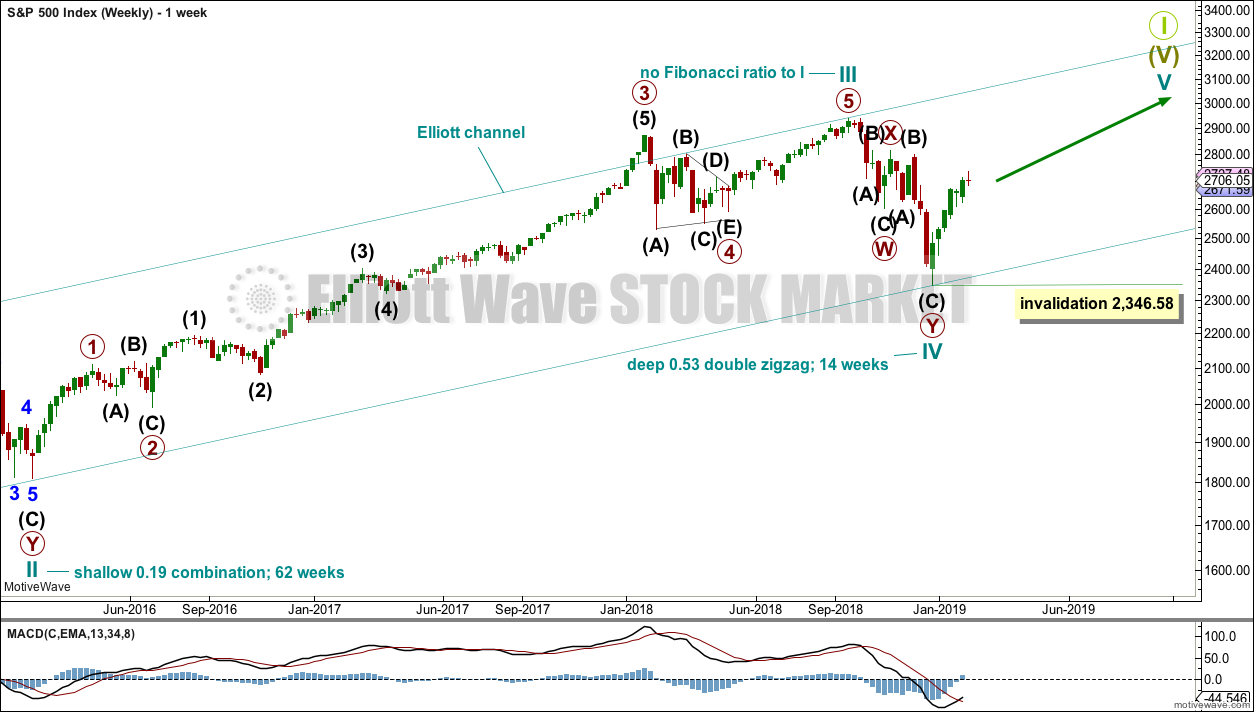
This weekly chart shows all of cycle waves III, IV and V so far.
Cycle wave II fits as a time consuming double combination: flat – X – zigzag. Combinations tend to be more time consuming corrective structures than zigzags. Cycle wave IV has completed as a multiple zigzag that should be expected to be more brief than cycle wave II.
Cycle wave IV may have ended at the lower edge of the Elliott channel.
Within cycle wave V, no second wave correction may move beyond the start of its first wave below 2,346.58.
Although both cycle waves II and IV are labelled W-X-Y, they are different corrective structures. There are two broad groups of Elliott wave corrective structures: the zigzag family, which are sharp corrections, and all the rest, which are sideways corrections. Multiple zigzags belong to the zigzag family and combinations belong to the sideways family. There is perfect alternation between the possible double zigzag of cycle wave IV and the combination of cycle wave II.
Although there is gross disproportion between the duration of cycle waves II and IV, the size of cycle wave IV in terms of price makes these two corrections look like they should be labelled at the same degree. Proportion is a function of either or both of price and time.
Draw the Elliott channel about Super Cycle wave (V) with the first trend line from the end of cycle wave I (at 2,079.46 on the week beginning 30th November 2014) to the high of cycle wave III, then place a parallel copy on the low of cycle wave II. Cycle wave V may find resistance about the upper edge.
DAILY CHART
Click chart to enlarge.
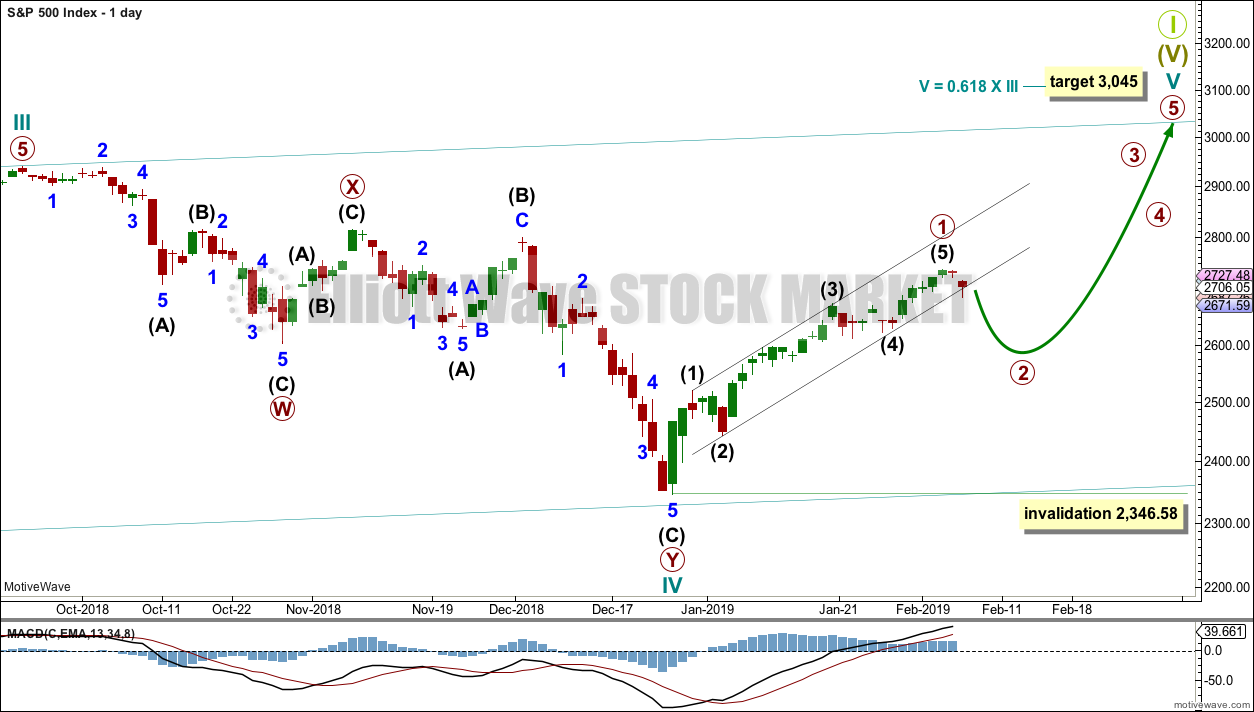
The daily chart will focus on the structure of cycle waves IV and V.
Cycle wave IV now looks like a complete double zigzag. This provides perfect alternation with the combination of cycle wave II. Double zigzags are fairly common corrective structures.
Within Super Cycle wave (V), cycle wave III may not be the shortest actionary wave. Because cycle wave III is shorter than cycle wave I, this limits cycle wave V to no longer than equality in length with cycle wave III at 3,477.39. A target is calculated for cycle wave V to end prior to this point.
Cycle wave V must subdivide as a five wave motive structure, either an impulse or an ending diagonal. An impulse is much more common and that will be how it is labelled. A diagonal would be considered if overlapping suggests it.
Within the five wave structure for cycle wave V, primary wave 1 may now be complete. Primary wave 1 lasted 27 sessions. Primary wave 2 may exhibit good proportion if it lasts a Fibonacci 21 or 34 sessions. Primary wave 2 would most likely subdivide as a zigzag, but it may be any corrective structure except a triangle.
Primary wave 2 may not move beyond the start of primary wave 1 below 2,346.58.
A new low below the start of intermediate wave (5) at 2,631.05 would add further confidence that primary wave 1 is over and primary wave 2 has begun.
HOURLY CHART
Click chart to enlarge.
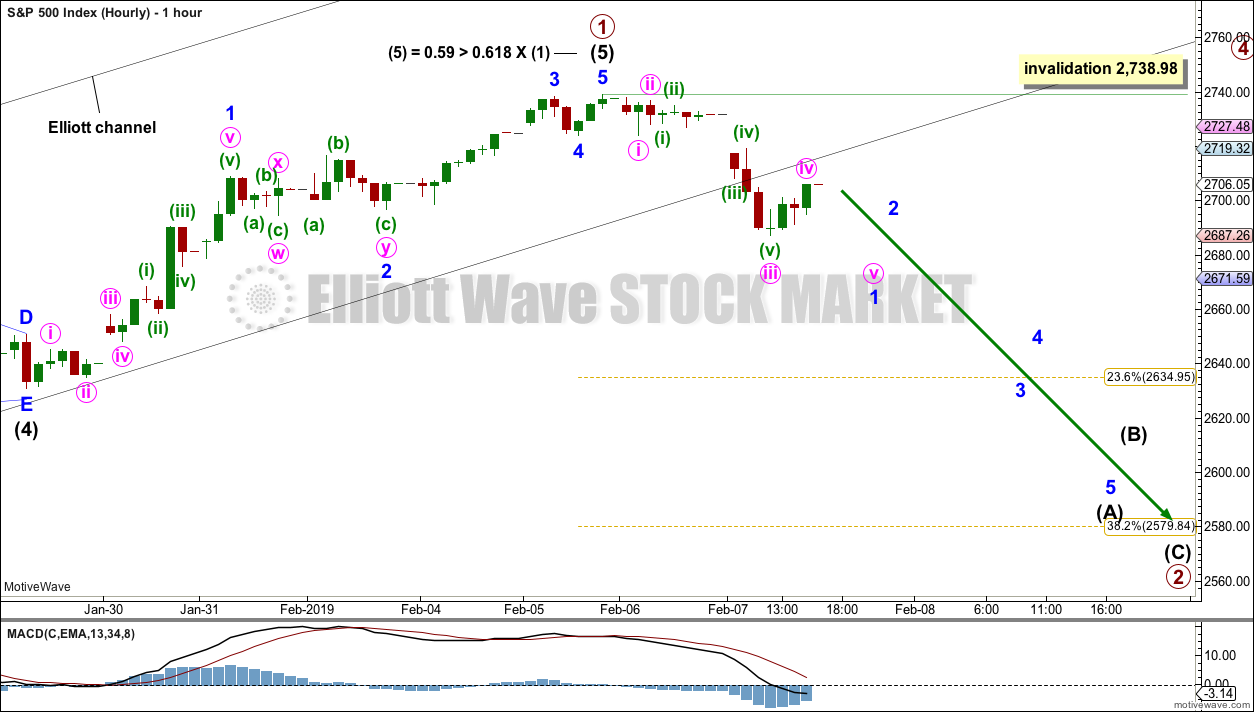
A clear breach of the lower edge of the black Elliott channel this session indicates primary wave 1 should be over and primary wave 2 should be underway.
The most likely structure for primary wave 2 would be a zigzag. Intermediate wave (A) would most likely subdivide as a five wave structure, most likely an impulse. Within intermediate wave (A), minor wave 2 may not move beyond the start of minor wave 1 above 2,738.98.
The labelling within primary wave 2 may change as it unfolds. It is impossible to tell at this stage which Elliott wave structure it may take.
TECHNICAL ANALYSIS
WEEKLY CHART
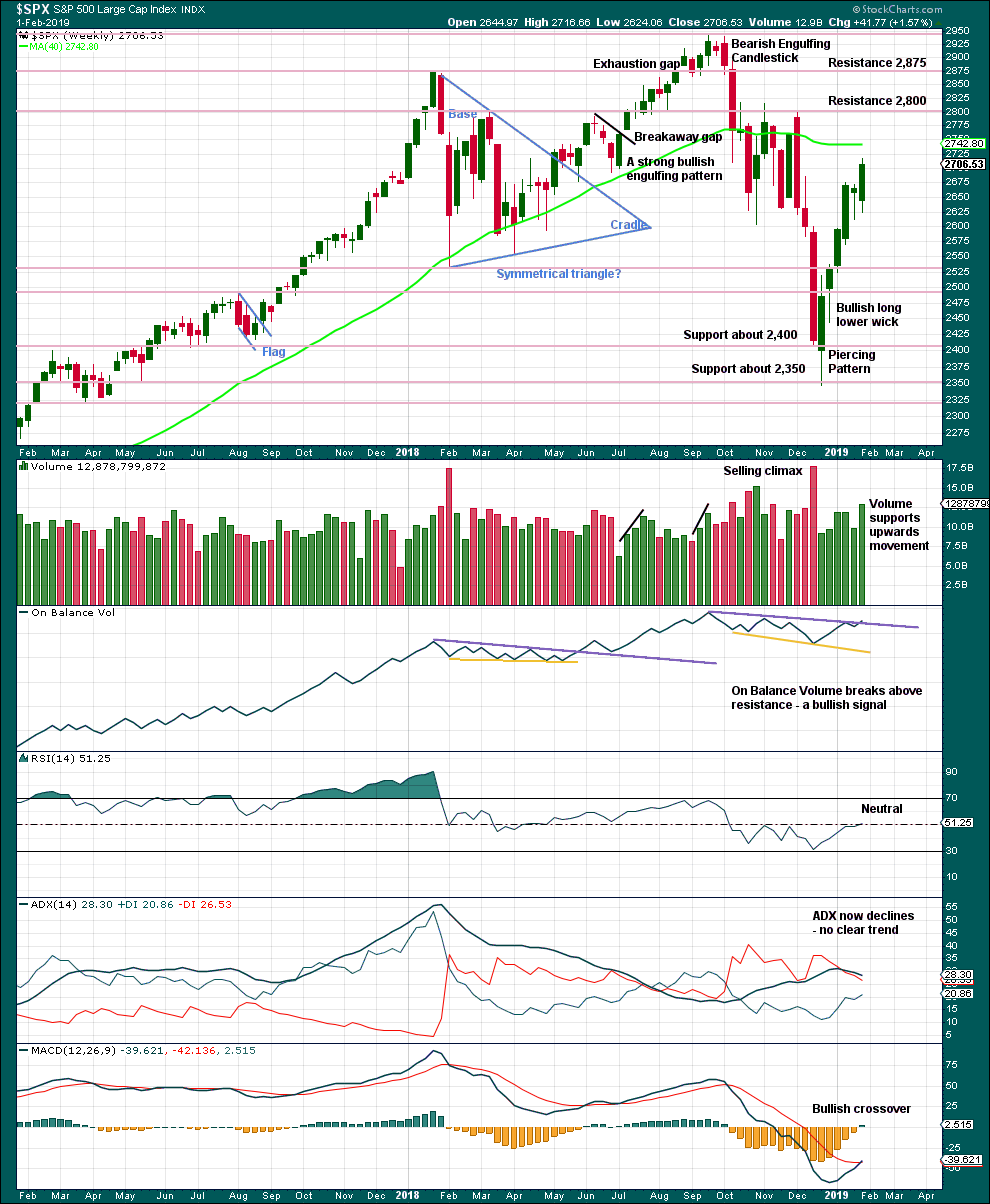
Click chart to enlarge. Chart courtesy of et=”_blank”>StockCharts.com.
From the all time high to the low at the end of December 2018, price moved lower by 20.2% of market value meeting the definition for a bear market.
It should be noted that the large fall in price from May 2011 to October 2011 also met this definition of a bear market, yet it was only a very large pullback within a bull market, which so far has lasted almost 10 years.
Overall, volume supports upwards movement last week. There is plenty of room for price to rise further.
DAILY CHART
Click chart to enlarge. Chart courtesy of StockCharts.com.
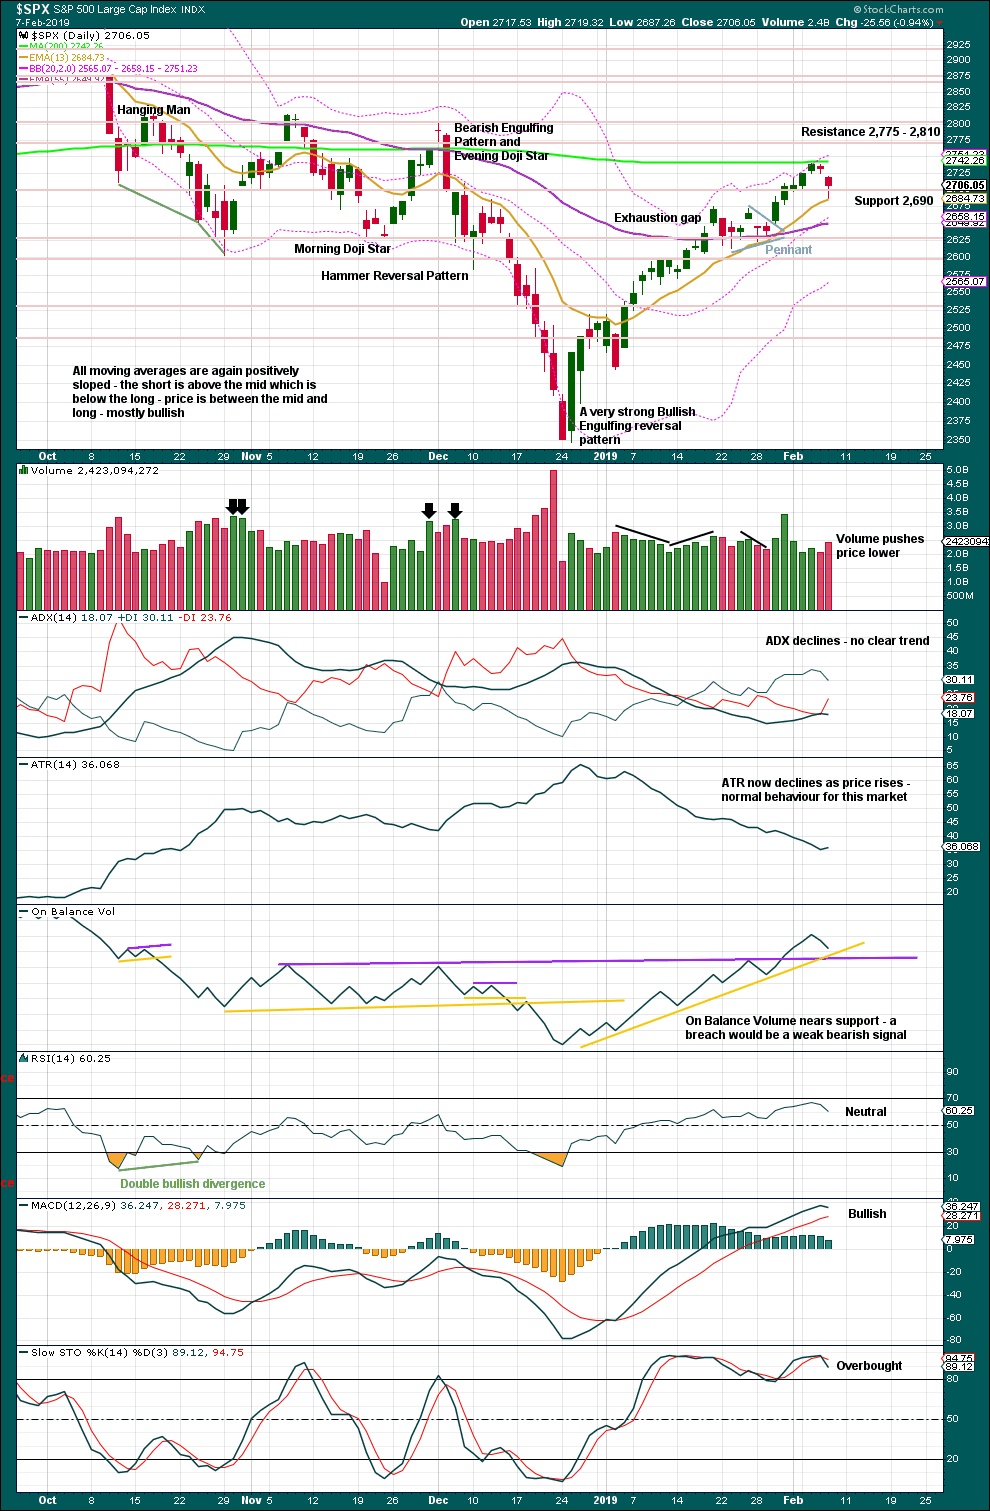
Over a fairly long period of time this ageing bull market has been characterised by upwards movement on light and declining volume and low ATR. For the short to mid term, little concern may be had if price now rises again on declining volume. Current market conditions have allowed for this during a sustained rise in price.
It is also normal for this market to have lower ATR during bullish phases, and strongly increasing ATR during bearish phases. Currently, declining ATR is normal and not of a concern.
Considering the larger picture from the Elliott wave count, some weakness approaching the end of Grand Super Cycle wave I is to be expected.
From Kirkpatrick and Dhalquist, “Technical Analysis” page 152:
“A 90% downside day occurs when on a particular day, the percentage of downside volume exceeds the total of upside and downside volume by 90% and the percentage of downside points exceeds the total of gained points and lost points by 90%. A 90% upside day occurs when both the upside volume and points gained are 90% of their respective totals”…
and “A major reversal is singled when an NPDD is followed by a 90% upside day or two 80% upside days back-to-back”.
The current situation saw two 80% downside days on December 20th and 21st, then a near 90% downside day with 88.97% downside on December 24th. This very heavy selling pressure on three sessions together may be sufficient to exhibit the pressure observed in a 90% downside day.
This has now been followed by two 90% upside days: on December 26th and again on 4th January.
The current situation looks very much like a major low has been found.
The target for upwards movement following the pennant pattern remains at 2,881. This target may not be met.
Volume today suggests more downwards movement tomorrow. Today saw 74% of total volume as down volume.
Support for On Balance Volume below is weak; the yellow line has a reasonable slope and the purple line has only three anchor points and has been subsequently breached.
BREADTH – AD LINE
WEEKLY CHART
Click chart to enlarge. Chart courtesy of StockCharts.com. So that colour blind members are included, bearish signals
will be noted with blue and bullish signals with yellow.
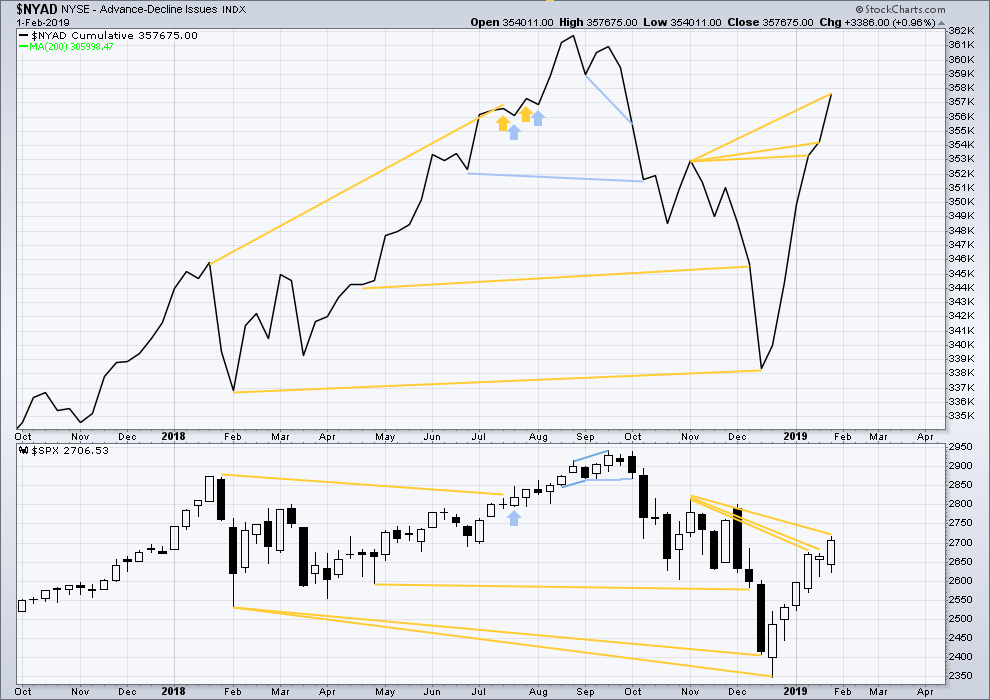
The AD line has made yet another new high above the prior swing high of the week beginning 5th of November 2018, but price has not. This divergence is bullish for the mid term.
DAILY CHART
Click chart to enlarge. Chart courtesy of StockCharts.com. So that colour blind members are included, bearish signals
will be noted with blue and bullish signals with yellow.
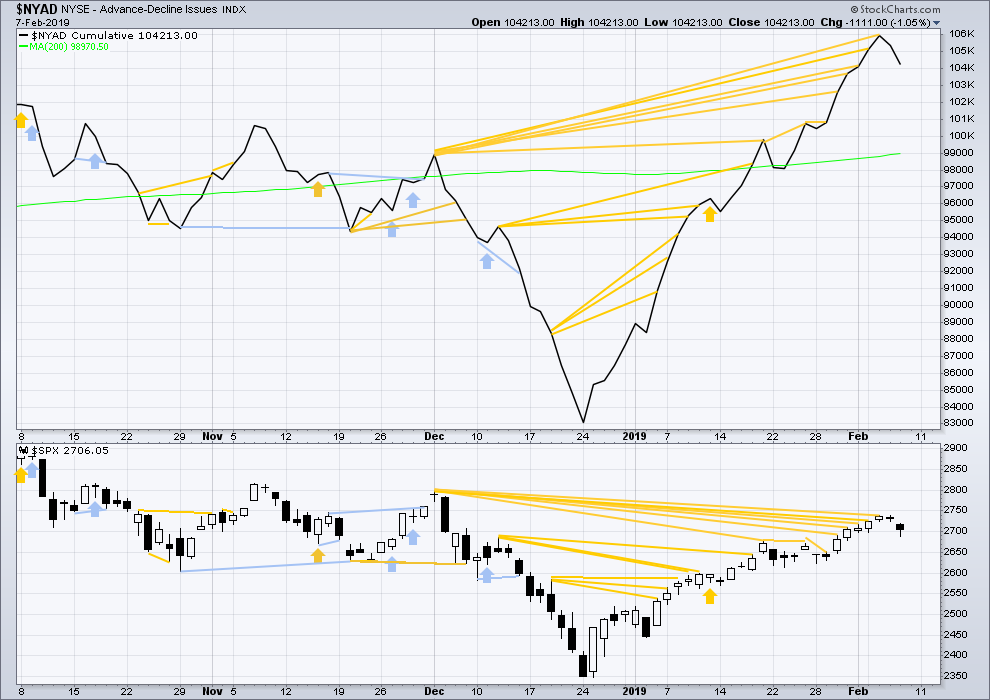
Breadth should be read as a leading indicator.
There is now a cluster of bullish signals from the AD line. This supports the Elliott wave count.
Downwards movement has further support from declining market breadth.
VOLATILITY – INVERTED VIX CHART
WEEKLY CHART
Click chart to enlarge. Chart courtesy of StockCharts.com. So that colour blind members are included, bearish signals
will be noted with blue and bullish signals with yellow.
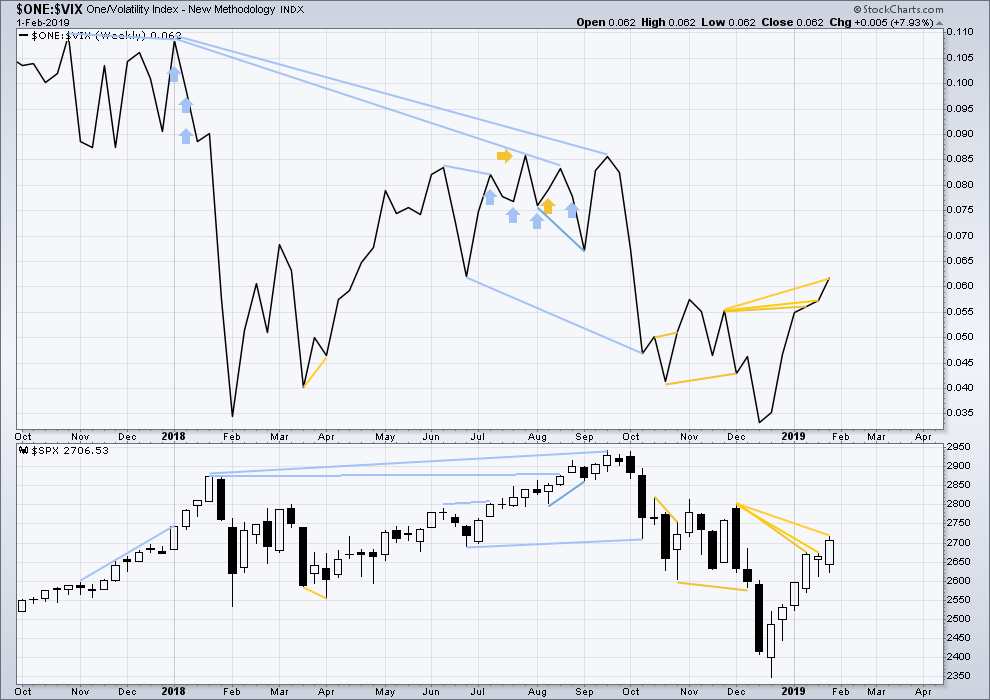
Again last week, inverted VIX has made another new high above the prior swing high of the weeks beginning 26th of November and 3rd of December 2018, but price has not. This divergence is bullish for the mid term.
DAILY CHART
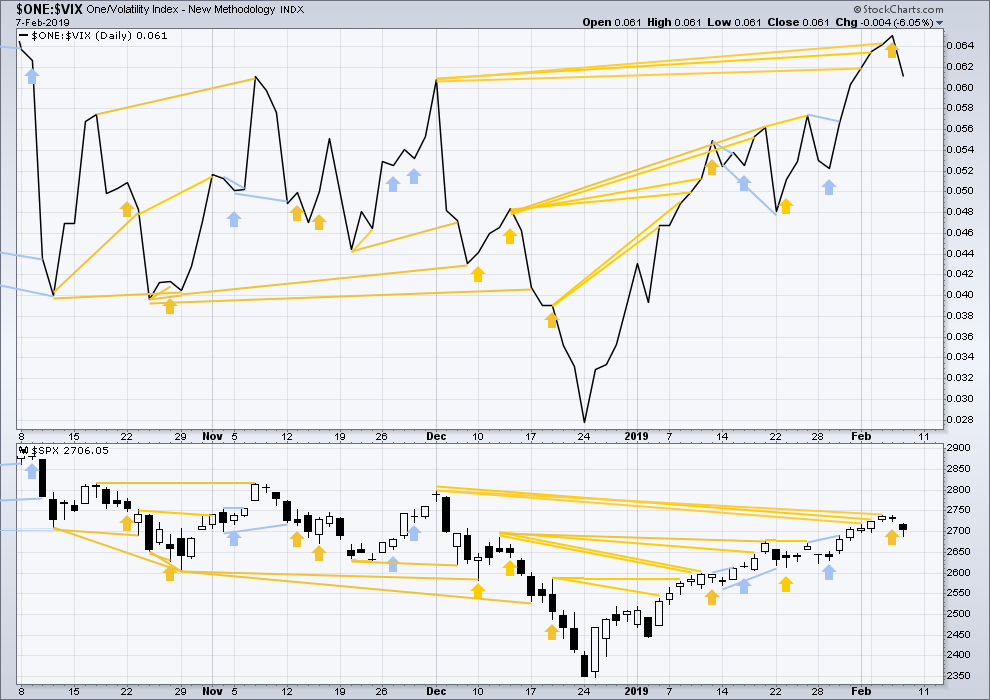
Click chart to enlarge. Chart courtesy of StockCharts.com. So that colour blind members are included, bearish signals
will be noted with blue and bullish signals with yellow.
There is now a cluster of bullish signals from inverted VIX. This supports the Elliott wave count.
Short-term bullish divergence noted in last analysis for inverted VIX has not been followed by upwards movement, so it is considered to have failed. Downwards movement today comes with a normal increase in market volatility as inverted VIX declines.
DOW THEORY
Dow Theory confirms a bear market. This does not necessarily mean a bear market at Grand Super Cycle degree though; Dow Theory makes no comment on Elliott wave counts. On the 25th of August 2015 Dow Theory also confirmed a bear market. The Elliott wave count sees that as part of cycle wave II. After Dow Theory confirmation of a bear market in August 2015, price went on to make new all time highs and the bull market continued.
DJIA: 23,344.52 – a close on the 19th of December at 23,284.97 confirms a bear market.
DJT: 9,806.79 – price has closed below this point on the 13th of December.
S&P500: 2,532.69 – a close on the 19th of December at 2,506.96 provides support to a bear market conclusion.
Nasdaq: 6,630.67 – a close on the 19th of December at 6,618.86 provides support to a bear market conclusion.
Published @ 06:44 p.m. EST.
—
Careful risk management protects your trading account(s).
Follow my two Golden Rules:
1. Always trade with stops.
2. Risk only 1-5% of equity on any one trade.
let’s see what the post 3:30pm ET action tells us. usually when the big dogs come out to play.
I’m gonna put on a gamble here ! Hope she’s down Monday !
Today’s candle finished bullish… looks like more upside on Monday. Looks like 61.8% is the target…
Updated hourly chart:
Minor 1 downwards now looks like a very nice five. Minor 2 may be incomplete. If the expectation for it to end about the 0.618 Fibonacci ratio is wrong then it may be too high.
I’m seeing an important breach of a falling wedge. Saying it’s important because it confirms the low of the day. The low was a price target from yesterday’s setup. Exited all short positions today at this low.
The LOD may be our minor 1 point. If that’s true, then a possible price target for minor 2 is circled on this chart. It’s based on a fib extension.
2661 is a 61.8% and very close by is this weeks lower expected move price of about 2665. I won’t be surprised with a close in that area today.
Turns out bearish symmetry also lies almost exactly at that 61.8% at 2661. Breaking below that (looks less likely today now) would (will?) be a critical confirmation that the P2 down is in play. Until that happens, this pullback isn’t yet the largest pullback of the P1 up.
I have a feeling (that’s all it is) that today’s low is probably the end of a first wave down, either minute i or minor 1. And we have a either a minute ii or minor 2 corrective wave up.
Took my shorts off near the lows of the day 🙂
Agree
if anyone likes shorting crazy bubble stocks, take a look at CRON (Cronos Group, a Canadian medical cannabis company). The weekly chart reminds me of bitcoin…just before it initiated a sell off of 90% of its value! A crazy exponential run up in the last few months.
Nice pick Kevin. I’m looking at CRON and yes, I see a nice bubble. I also see a rough five up, with a nice triangle in there.
I don’t like to do EW counts on individual equities, but I may be tempted to take a shot at one on CRON.
I may also be tempted to do for CRON what I did for Bitcoin… carefully analyse each prior major pullback, what was seen at the highs? how deep did it go? then extrapolate to what may possibly be seen at its next big high and find an entry point for shorts.
Because that looks like a very nice shorting opportunity.
That’s the thing about bubbles. You can’t tell in advance which market may form a bubble, but you can identify a fully formed bubble and then wait for it to pop to make some $$
Alrighty then Curtis, I put on my shorts premarket. I’m ready for the races. Remember, being first on the weekend is worth 7 points!
I loaded up short after the clearing push up. “Trust the wave count, Luke…” SPX puts and VIX calls.
Situation looking good for prior GM and JPM bear spreads too.
Have a TLT (broken wing, bullish) butterfly on expiring next Friday centered at 122. Here’s to TLT hold in the 122-123 area for a week! Right now it’s perfectly in the pocket.
I went short ES and NQ Thurs. evening. Stopped out of both for small gains. Will look to re-enter for a longer ride when minor 2 is complete.
Primary 2. The last primary wave was a 4, and it “only” peeled 11% off the market. The prior primary 2 was smaller, what 4% or so? Time for a battle plan. Oh boy.
The 38% retrace would be a 5.8% correction. And the 62% retracemnt would be 9% correction.
My main focus is to figure out where minor 2 might go up to. That’s the best spot to add to shorts…
ari,
Same here! … very focused on finding minor 2 … Kevin (I think it was Kevin) mentioned something that has stuck in my head about retracing to the lower channel line of the black Elliott channel … that would be a very elegant maneuver … of course, I’ll wait for the chart to announce that it has found minor 2, before entering any new short positions
that channel line is pretty far away now. I’m suspecting that this market will stall and turn around the 2700 roundie. 2704 is a 38.2% retrace of the overall down move from the recent highs, and there’s an hourly swing high at 2706. Somewhere in there…possibly.
I like your 2704 number because it’s the level where the trend channel was broken. I would expect the minor 2 point to be even higher because the demand to load up on shorts would be where the greed curve intersects with the bull-trap curve.
Laura, well done summary. Short, to the point , with possible timeline (sessions) and targets. Can’t ask for more.
Thanks very much Davey 🙂
As I said just be for the open today, time to get your shorts on for a run. Where I live you don’t want shorts. Winter finally hit us with single digit temps and the ground is now covered in white. I thought we might luck out this year even though the mountains have had plenty of snow.
Hi back at you Verne. I am coming along slowly doing my PT exercises twice a day. Only two more weeks with this blasted sling. Then the real PT begins. I started driving again to go to the office even though the doc did not give me that release. I could not take it any more stuck in the house even though I overlook the beautiful Columbia River about 1/2 mile wide at my house. This last month has caused me to reconsider my pending retirement. I think I might cancel my scheduled retirement in 22 months and work for another five years or so. We’ll see what my wife thinks about it.
BTW, I will be opening some short positions in the morning baring any unexpected major developments.
Take care all and have a great evening.
First!
You couldn’t wait to let this old man have it, huh?
Get your shorts on, Rodney!
Unless of course he prefers his local electrical contractor to remove them! BRRRR…!!!! 😀