More upwards movement has unfolded as expected. The Elliott wave and classic analysis targets remain the same.
Summary: The target for more upwards movement is at 2,804 (Elliott wave) or 2,881 (classic analysis).
At about one of these targets a large pullback for a second wave at primary degree may begin.
For the short term, a breach of the black Elliott channel and then a new low below 2,631.05 would indicate a bigger pullback has arrived.
The bigger picture still expects that a low may now be in place. The target is at 3,045 with a limit at 3,477.39.
New updates to this analysis are in bold.
The biggest picture, Grand Super Cycle analysis, is here.
The monthly chart was last published here.
ELLIOTT WAVE COUNT
WEEKLY CHART
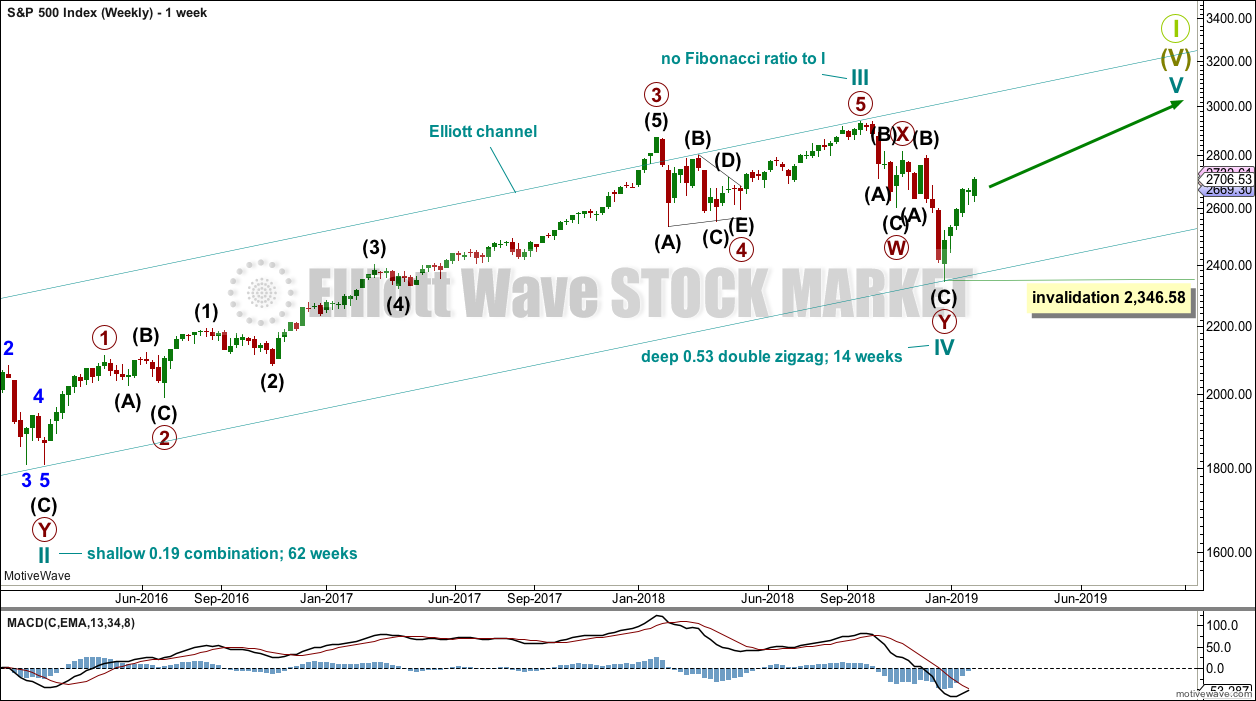
This weekly chart shows all of cycle waves III, IV and V so far.
Cycle wave II fits as a time consuming double combination: flat – X – zigzag. Combinations tend to be more time consuming corrective structures than zigzags. Cycle wave IV has completed as a multiple zigzag that should be expected to be more brief than cycle wave II.
Cycle wave IV may have ended at the lower edge of the Elliott channel.
Within cycle wave V, no second wave correction may move beyond the start of its first wave below 2,346.58.
Although both cycle waves II and IV are labelled W-X-Y, they are different corrective structures. There are two broad groups of Elliott wave corrective structures: the zigzag family, which are sharp corrections, and all the rest, which are sideways corrections. Multiple zigzags belong to the zigzag family and combinations belong to the sideways family. There is perfect alternation between the possible double zigzag of cycle wave IV and the combination of cycle wave II.
Although there is gross disproportion between the duration of cycle waves II and IV, the size of cycle wave IV in terms of price makes these two corrections look like they should be labelled at the same degree. Proportion is a function of either or both of price and time.
Draw the Elliott channel about Super Cycle wave (V) with the first trend line from the end of cycle wave I (at 2,079.46 on the week beginning 30th November 2014) to the high of cycle wave III, then place a parallel copy on the low of cycle wave II. Cycle wave V may find resistance about the upper edge.
DAILY CHART
The daily chart will focus on the structure of cycle waves IV and V.
Cycle wave IV now looks like a complete double zigzag. This provides perfect alternation with the combination of cycle wave II. Double zigzags are fairly common corrective structures.
Within Super Cycle wave (V), cycle wave III may not be the shortest actionary wave. Because cycle wave III is shorter than cycle wave I, this limits cycle wave V to no longer than equality in length with cycle wave III at 3,477.39. A target is calculated for cycle wave V to end prior to this point.
Cycle wave V must subdivide as a five wave motive structure, either an impulse or an ending diagonal. An impulse is much more common and that will be how it is labelled. A diagonal would be considered if overlapping suggests it.
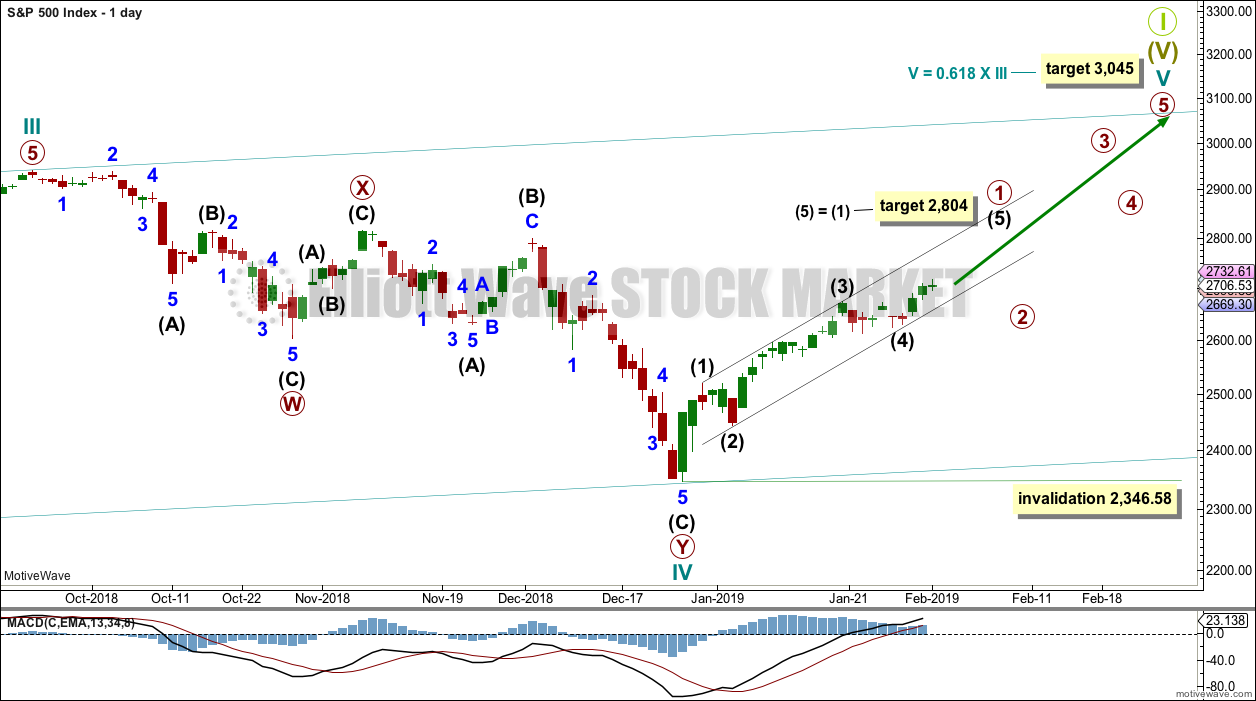
Within the five wave structure for cycle wave V, primary wave 1 may be incomplete. A target is calculated for intermediate wave (5) to reach the most common Fibonacci ratio to intermediate wave (1).
Within cycle wave V, primary wave 2 may not move beyond the start of primary wave 1 below 2,346.58.
Intermediate wave (5) begins at 2,631.05. While price remains within the black Elliott channel and above 2,631.05, assume the trend remains the same. If price breaks below the lower edge of the channel and then makes a new low below the start of intermediate wave (5), then that would indicate primary wave 1 should be over and primary wave 2 should have begun.
MAIN HOURLY CHART
Intermediate wave (4) is now a complete regular contracting triangle ending within the black Elliott channel. The lower edge of this channel may continue to provide support for corrections within intermediate wave (5).
Intermediate wave (5) must subdivide as a five wave motive structure, either an impulse or an ending diagonal. An impulse is much more common, so that shall be how intermediate wave (5) is labelled. An ending diagonal will only be considered if overlapping begins to suggest it.
Within intermediate wave (5), minor wave 1 may now be complete. Minor wave 2 may not move beyond the start of minor wave 1 below 2,631.05. However, it should find strong support at the lower edge of the black Elliott channel if it does continue.
Minor wave 2 may be unfolding as an expanded flat correction. Within the expanded flat, minute wave b is a 1.54 length to minute wave a. This is longer than the common range of 1 to 1.38, but within an allowable limit of up to 2.
At 2,694 minute wave c would reach 1.618 the length of minute wave a. This is fairly close to the 0.236 Fibonacci ratio of minor wave 1 at 2,691, giving a small 3 point target zone for minor wave 2 to end on Monday.
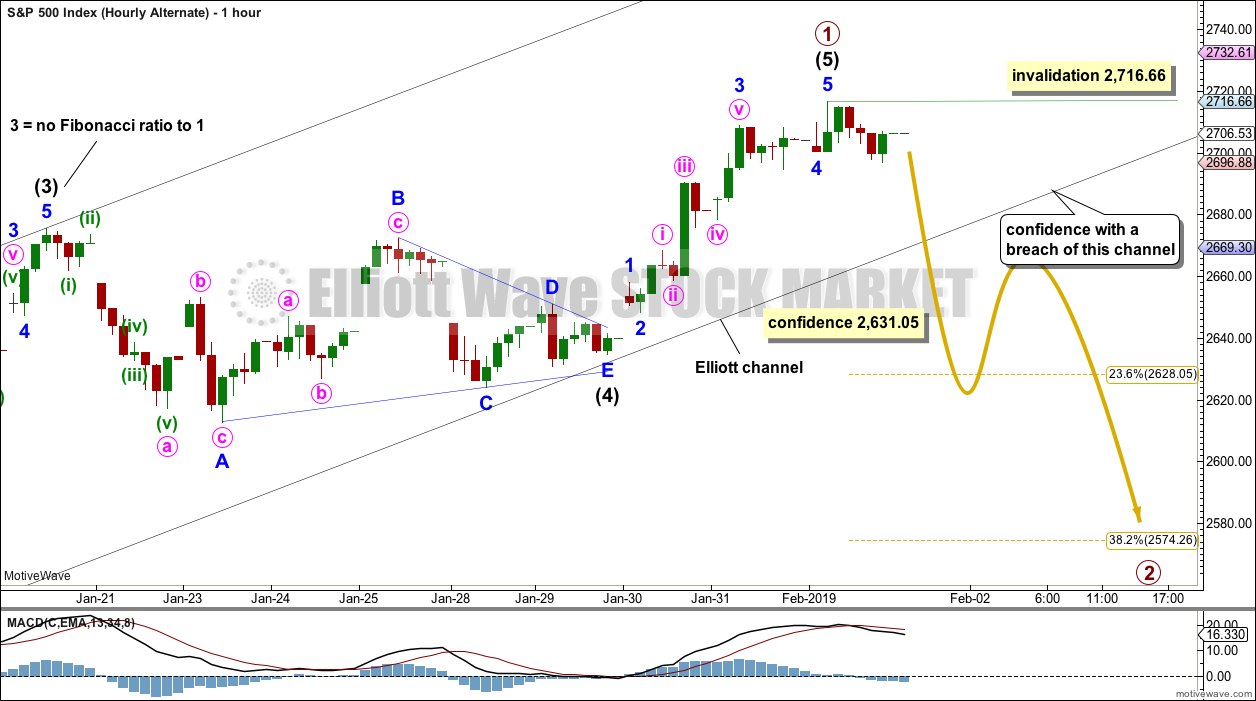
If price breaks below the black channel, then the alternate hourly wave count should be used.
ALTERNATE HOURLY CHART
This wave count now sees the triangle of intermediate wave (4) ending later at 2,641.49. The end of minor wave E would be truncated.
It is possible then that intermediate wave (5) could be over. Within intermediate wave (5), minor wave 4 may have subdivided as a double combination; this fits on the five minute chart.
The first target for primary wave 2 would be the 0.382 Fibonacci ratio of primary wave 1 at 2,574. If price keeps falling through this first target, then the next target at the 0.618 Fibonacci ratio at 2,487 may be used.
Primary wave 2 should be expected to last a few weeks and look like a three wave structure.
This wave count should only be used if it is indicated by a breach of the black channel.
TECHNICAL ANALYSIS
WEEKLY CHART
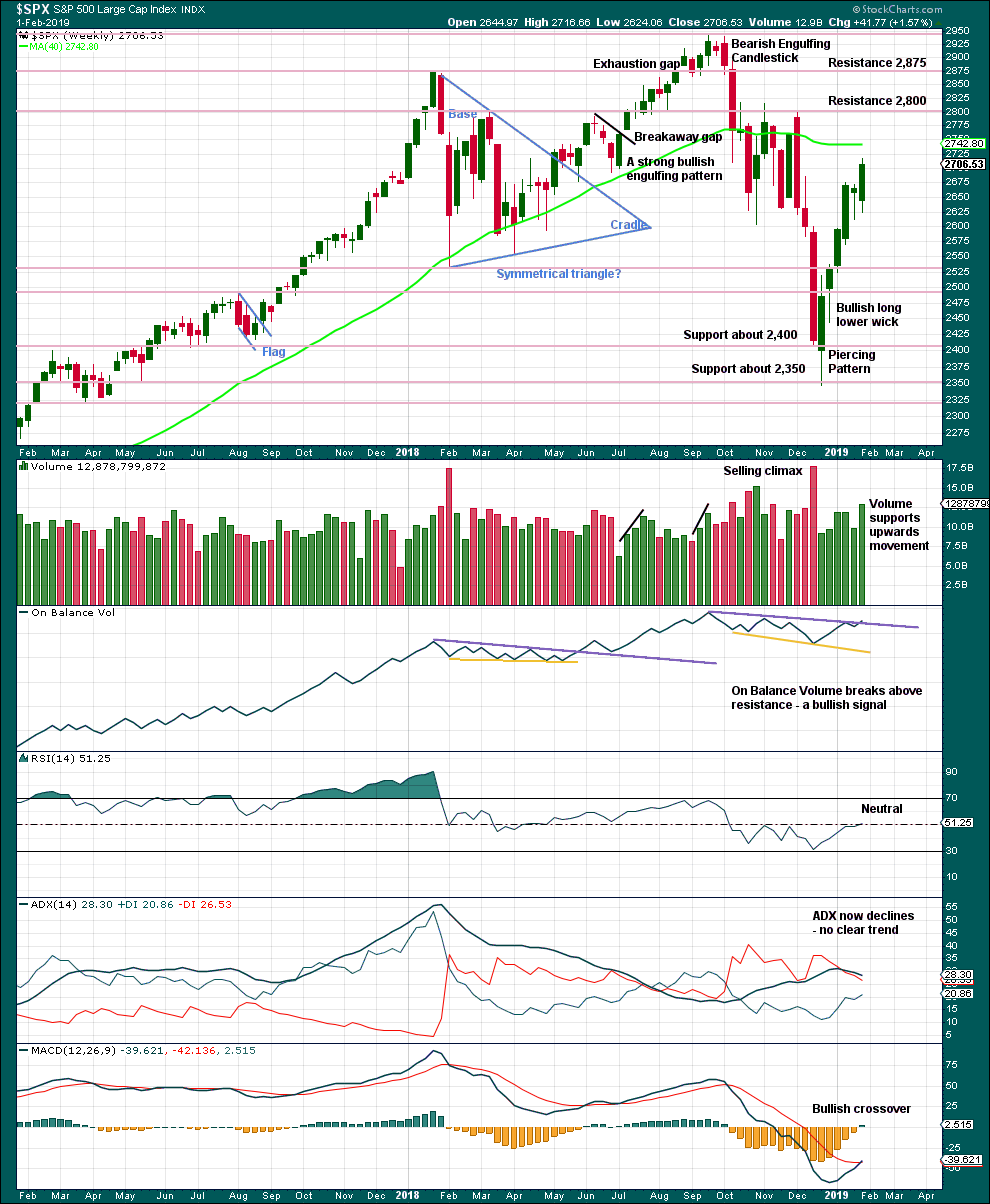
Click chart to enlarge. Chart courtesy of et=”_blank”>StockCharts.com.
From the all time high to the low at the end of December 2018, price moved lower by 20.2% of market value meeting the definition for a bear market.
It should be noted that the large fall in price from May 2011 to October 2011 also met this definition of a bear market, yet it was only a very large pullback within a bull market, which so far has lasted almost 10 years.
Overall, volume supports upwards movement this week. There is plenty of room for price to rise further.
DAILY CHART
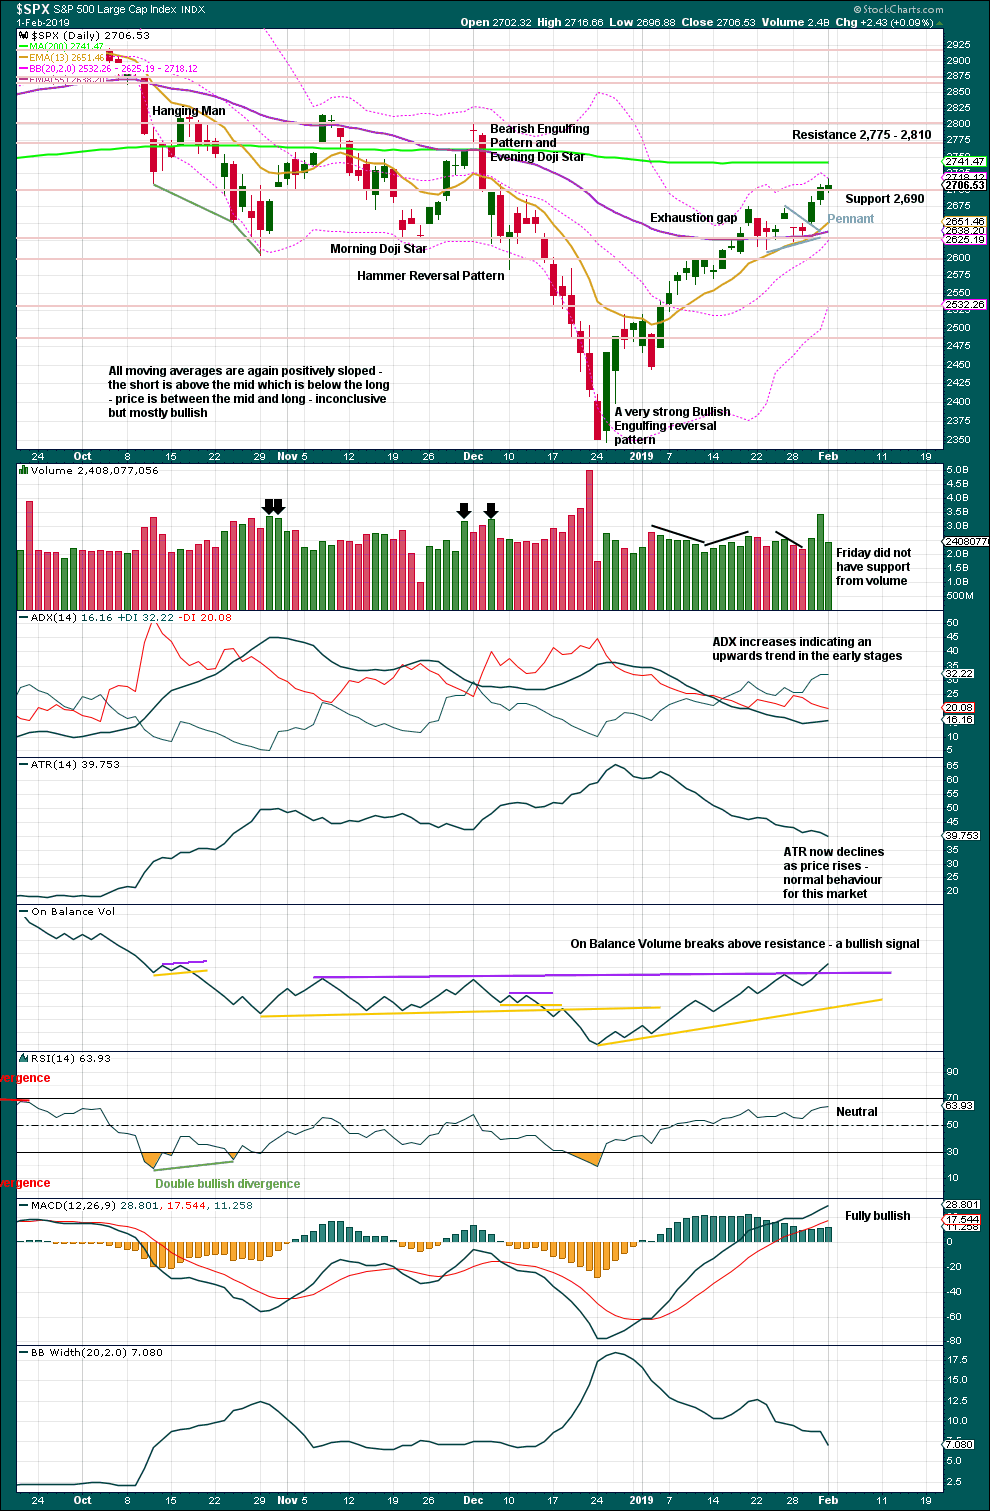
Click chart to enlarge. Chart courtesy of StockCharts.com.
Over a fairly long period of time this ageing bull market has been characterised by upwards movement on light and declining volume and low ATR. For the short to mid term, little concern may be had if price now rises again on declining volume. Current market conditions have allowed for this during a sustained rise in price.
It is also normal for this market to have lower ATR during bullish phases, and strongly increasing ATR during bearish phases. Currently, declining ATR is normal and not of a concern.
Considering the larger picture from the Elliott wave count, some weakness approaching the end of Grand Super Cycle wave I is to be expected.
From Kirkpatrick and Dhalquist, “Technical Analysis” page 152:
“A 90% downside day occurs when on a particular day, the percentage of downside volume exceeds the total of upside and downside volume by 90% and the percentage of downside points exceeds the total of gained points and lost points by 90%. A 90% upside day occurs when both the upside volume and points gained are 90% of their respective totals”…
and “A major reversal is singled when an NPDD is followed by a 90% upside day or two 80% upside days back-to-back”.
The current situation saw two 80% downside days on December 20th and 21st, then a near 90% downside day with 88.97% downside on December 24th. This very heavy selling pressure on three sessions together may be sufficient to exhibit the pressure observed in a 90% downside day.
This has now been followed by two 90% upside days: on December 26th and again on 4th January.
The current situation looks very much like a major low has been found.
The target for upwards movement following the pennant pattern remains at 2,881.
While Thursday had strong support from volume for upwards movement, Friday did not. However, in current market conditions this should not be given much weight.
The bullish signal from On Balance Volume should be given more weight. Overall, this chart supports the idea that upwards movement should continue next week.
BREADTH – AD LINE
WEEKLY CHART
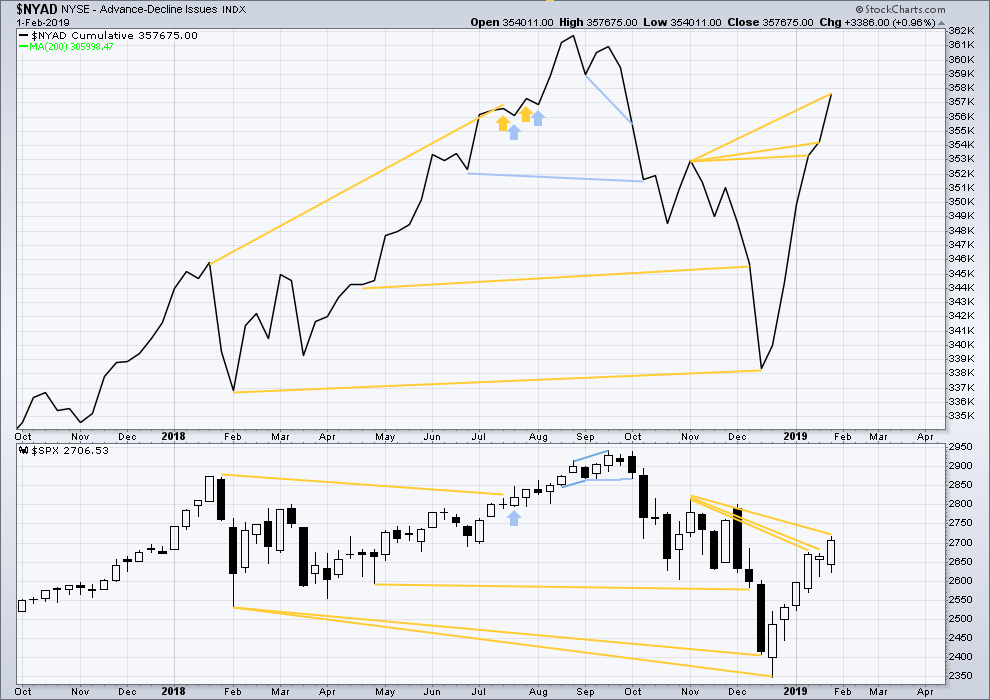
Click chart to enlarge. Chart courtesy of StockCharts.com. So that colour blind members are included, bearish signals
will be noted with blue and bullish signals with yellow.
The AD line has made yet another new high above the prior swing high of the week beginning 5th of November 2018, but price has not. This divergence is bullish for the mid term.
DAILY CHART
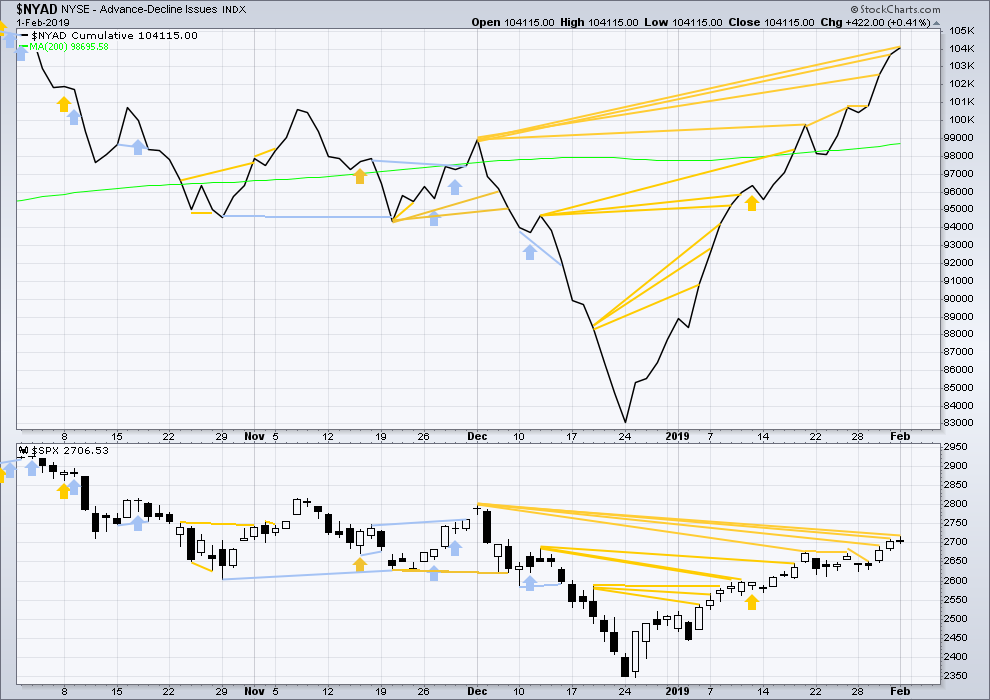
Click chart to enlarge. Chart courtesy of StockCharts.com. So that colour blind members are included, bearish signals
will be noted with blue and bullish signals with yellow.
Breadth should be read as a leading indicator.
There is now a cluster of bullish signals from the AD line. This supports the main Elliott wave count.
Again on Friday, the AD line continues to make new highs above the prior high of the 3rd of December 2018, but price has not yet matched this high. This divergence is bullish for the mid term.
VOLATILITY – INVERTED VIX CHART
WEEKLY CHART
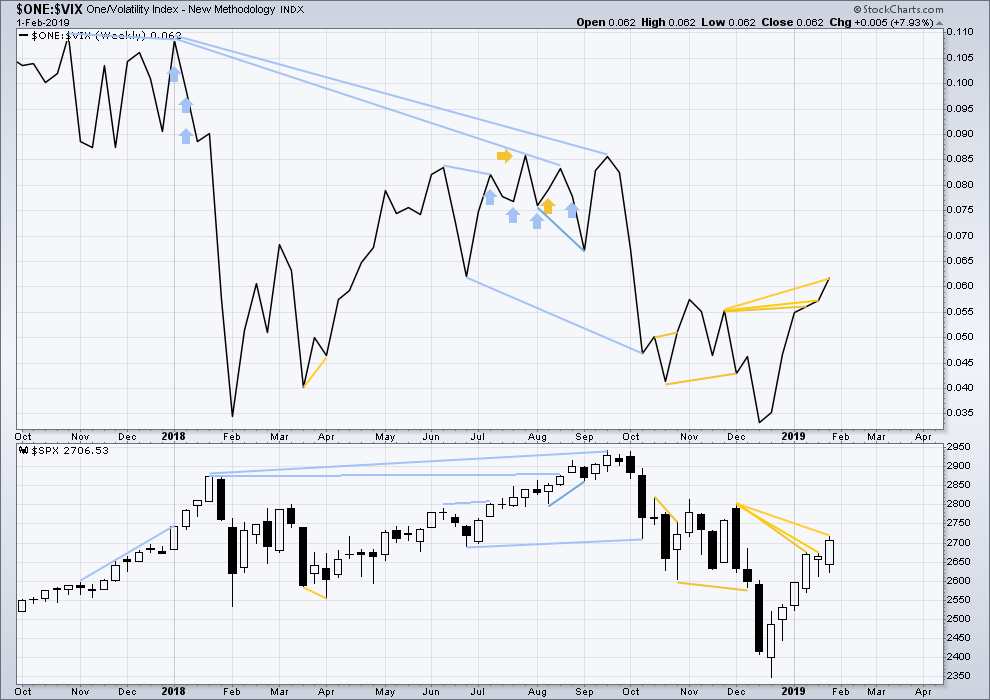
Click chart to enlarge. Chart courtesy of StockCharts.com. So that colour blind members are included, bearish signals
will be noted with blue and bullish signals with yellow.
Again this week, inverted VIX has made another new high above the prior swing high of the weeks beginning 26th of November and 3rd of December 2018, but price has not. This divergence is bullish for the mid term.
DAILY CHART
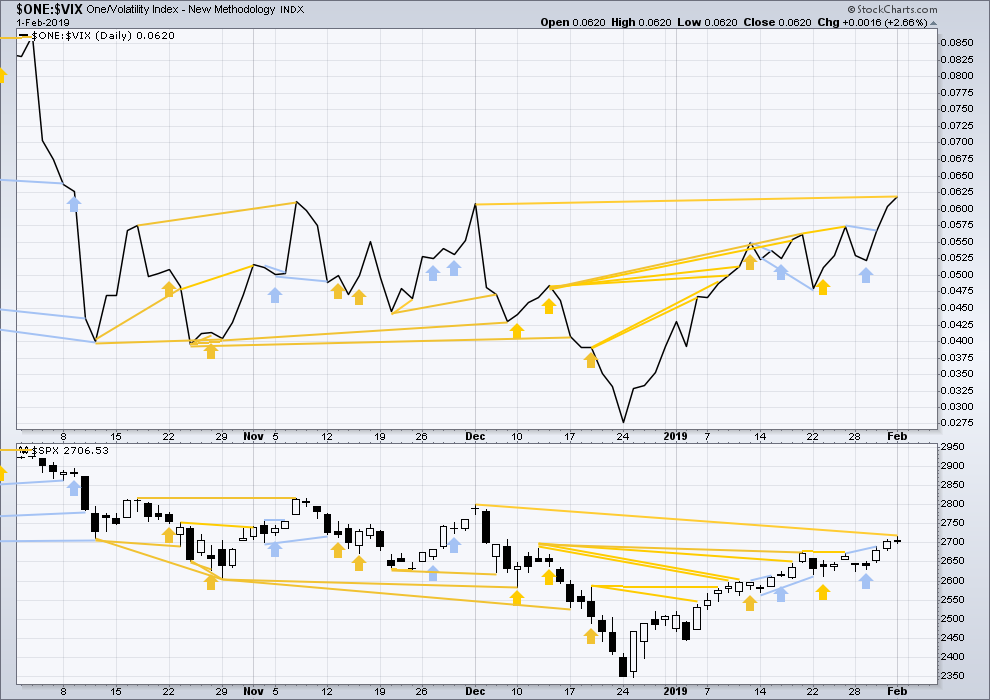
Click chart to enlarge. Chart courtesy of StockCharts.com. So that colour blind members are included, bearish signals
will be noted with blue and bullish signals with yellow.
There is now a cluster of bullish signals from inverted VIX. This supports the main Elliott wave count.
On Friday inverted VIX made a new high above the prior swing high of the 3rd of December, but price has not yet made a corresponding new high. This divergence is bullish for the mid term.
DOW THEORY
Dow Theory confirms a bear market. This does not necessarily mean a bear market at Grand Super Cycle degree though; Dow Theory makes no comment on Elliott wave counts. On the 25th of August 2015 Dow Theory also confirmed a bear market. The Elliott wave count sees that as part of cycle wave II. After Dow Theory confirmation of a bear market in August 2015, price went on to make new all time highs and the bull market continued.
DJIA: 23,344.52 – a close on the 19th of December at 23,284.97 confirms a bear market.
DJT: 9,806.79 – price has closed below this point on the 13th of December.
S&P500: 2,532.69 – a close on the 19th of December at 2,506.96 provides support to a bear market conclusion.
Nasdaq: 6,630.67 – a close on the 19th of December at 6,618.86 provides support to a bear market conclusion.
Published @ 04:00 a.m. EST on February 2, 2019.
—
Careful risk management protects your trading account(s).
Follow my two Golden Rules:
1. Always trade with stops.
2. Risk only 1-5% of equity on any one trade.

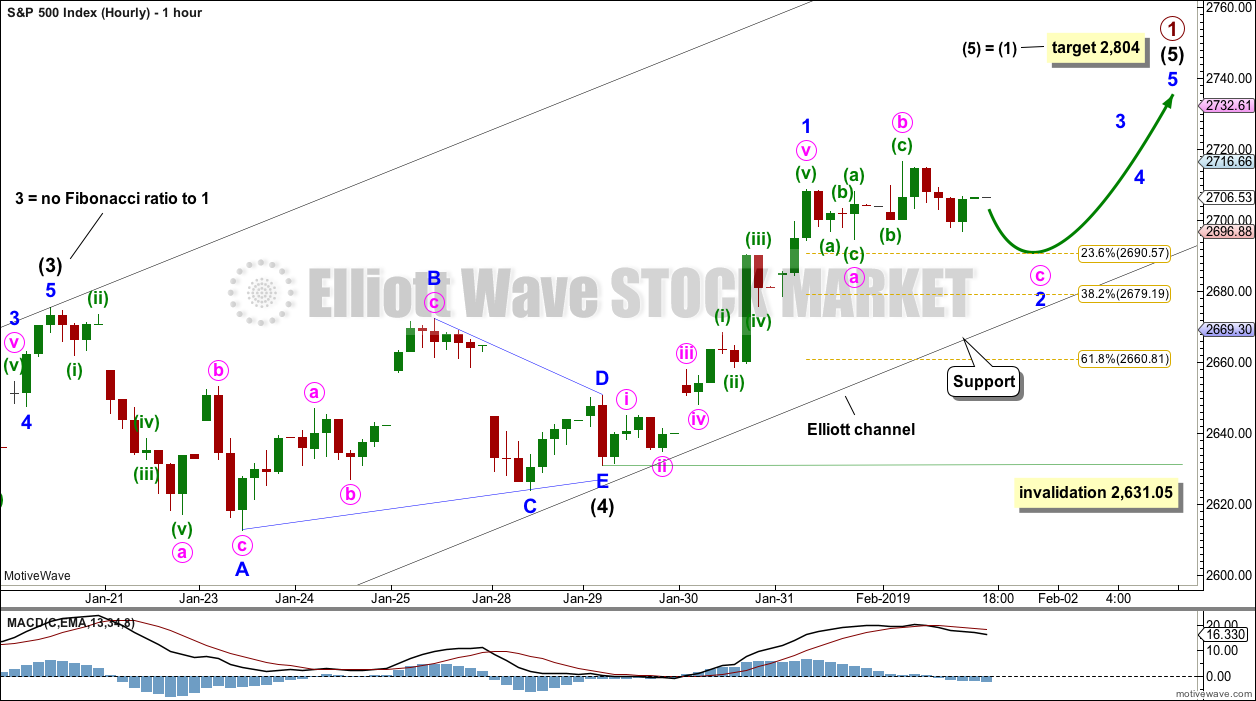
I’ve adjusted the labelling within minor wave 2 on the main hourly wave count. With no downwards movement at the start of this session, and a reasonable high above the end of minor wave 1, it looks like minor 2 is over. It will fit as a double combination.
The invalidation point is moved up.
good, strong bullish signals today on the 15 + 30 minute charts
There are good, strong bullish signals today on the 15 minute and 30 minute charts
But here’s the real headline: “No retracements for entry”. They have very recently blocked the part of the algo that does pullbacks after a signal is given.
Nice breakout today from Doji-ville
(4 hour candles)
Here is an ES chart that’s current as of now. It shows that Doji-fest 2019 is still going on. (4 hour candles) The far right candle is over half way done. It’s 2.5 hours old.
A couple of things to put out there. Thing 1: Over the weekend I tested some different kinds charting software. One of the systems was NinjaTrader. I found that Ninja has great Fib-ware for use on it’s charts. Which was the best feature. The worst feature was their Heikin-Ashi candle generation. Ninja is making and printing Heikin-Ashi candlesticks that are just wrong. Wrong as in, WAY off. So Alert Alert Alert: don’t use NinjaTrader because their data construction is absolutely incorrect!
I have been banging the drum for a few weeks now about my target for this move. It remains unchanged. The target on the ES is modeled at 2860. Since the December 2018 low until now, we have come about ¾ of the way to target. With 25% more to go, we are within 150 ES points of the target.
2860 remains my target for Primary 1 and Intermediate 5, as shown on Lara’s brilliant charting.
V daily. The 3 white lines projected from last Thursday’s low are projections of the prior 3 upswings (late Oct, mid Nov, and late Dec). And note it’s pushed through the 61.8% retrace level of the overall Oct-Dec high-low move. Also, it’s moving up strongly while in a squeeze. This all after earnings a few days ago. I think is a strongly bullish set up.
well…. what do we have here? lets see if we pick up the pace….
the pace may reverse off 2715.
DAL (daily here) is in a big (12 days now) squeeze with upward momentum. Weekly trend is still mildly down, daily trend has moved to neutral, hourly is up. I’m long here.
JPM weekly. Price is stalled at/under overlapped 50% and 61.8% retrace levels.
For fibo turn traders, this is a pretty good short set up. A move below last thursday’s daily wing low at 102.73 might be a good entry trigger. Stop would be just above the daily swing high which is right at the 50%, 105.24.
I like your DAL long Kevin
Interesting article from Bloomberg.
Others might be interested in knowing that the criminal misconduct was far worse than revealed in this article, and many traders in the vol sphere knew it was going on.
It was only after a class-action lawsuit that showed exactly what they were doing and how, that the practice stopped. The CBOE is covering its hiny with that pathetic 1.28 million fine. They knew what was going on and did nothing about it. The perpetrators paid a lot more than that to settle! Too bad about NDAs!
https://www.bloomberg.com/news/articles/2019-02-01/high-frequency-options-firm-fined-by-cboe-in-vix-trading-case
Hiya Verne,
Can I ask you what clues lead you to believe that the top is in last Friday at least for the short term?
Me too … same question as ari … really nice eye Verne … astute call!
Me 3
Hi Ari. 2800 is certainly not out of the question.
My own indicators had 2720 as the red line between immediate bullish and bearish. I am still a bit cautious over the failure to surrender the 2700 pivot on a closing basis Friday.
I think the big question for me is whether we just finished a third or a fifth wave.
As you no doubt noticed, bearish reversal signals have been getting negated with regularity of late, including opening gaps down and several quasi island reversal patterns. The last two interim tops displayed nice clear dojis and early on in the session it appeared we had another one in the making. Kevin also pointed out a confluence of fib re-tracements and overhead resistance that also may prove significant, especially the MAs. We should know come Monday! 🙂
Great bear case and something to watch for… https://northmantrader.com/2019/01/20/coming-soon-retest/
Hi rajmoolie,
Thanks for posting interesting links. The bear case that northmantrader makes is centered on what he sees as a rising wedge. The article came out a few weeks ago and since then that viewpoint has been blown up. I don’t think that there is a rising wedge on the SPX. Check out Lara’s charts. She has illustrated the Elliot channel that the SPX is moving in.
This chart is the SPX daily with his lower anchor points circled.
Once again, thx for the article. I love reading that sort of stuff.
If you move your lower boundary line to include all the lows, you can still see wedging price action. It is a bit more obvious in DJIA.
Another interestining consideration is fib time relationships, which can often be significant. There is a cluster of ten important pror highs and lows between Jan 29 and Feb 19. We had a similar cluster around the early October 2018 top.
The 61.9% retrace of the Sep 21 highs might also be a place for at least a pause. The other side of the argument is clear absence of selling pressure and reclaim of the 2700 round number pivot with sideways consolidation above it. Another session that closes above it would imho be significant for short term direction. A good time to SOH until things a bit clearer…
Thanks for the great views, much appreciated. I see the world through ES colored glasses, so, these comments are based on the ES futures chart … The big 61.8% level was penetrated last week and today we are trading higher than last week’s high.
When it comes to TA on the chart, I have to side stongly with Lara. In our current Primary move, she has found the upper line of resistance and created a parallel to use as the lower trend channel line. Also, the market seems to strongly agree with Lara too!
Thanks Verne. Your insight much appreciated
I was thinking about your price “coiling” and the NASDAQ and SPX do show a steep rising wedge. This in particular is leaning me to the downside. Of course the big question is how far will it rise before it’s time for a correction.
🙂
Here’s my daily view. Fibo cluster right at the highs of Friday (2712-15), and up at the TRIPLE TOP area of 2812-15. Notice taht price is right now in the middle-ish of the big rectangle trading range of the early October to early December period. Another suggestion that IF price pushes up here past 2715 decisively, a move to the top of this range and that next fibo cluster would appear likely.
The two white horizontal lines in the immediate future on this chart show the expected move price levels based on the price of next Friday’s SPX options. Price is very often closing end of week very close to these levels, and knowing this can provide edge.
Great chart Kevin! Always enjoy your comments and charts…