
Upwards movement continues exactly as expected towards the targets.
Summary: The target for more upwards movement is at 2,804 (Elliott wave) or 2,881 (classic analysis).
At about one of these targets a large pullback for a second wave at primary degree may begin.
For the short term, a breach of the black Elliott channel and then a new low below 2,631.05 would indicate a bigger pullback has arrived.
The bigger picture still expects that a low may now be in place. The target is at 3,045 with a limit at 3,477.39.
New updates to this analysis are in bold.
The biggest picture, Grand Super Cycle analysis, is here.
The monthly chart was last published here.
ELLIOTT WAVE COUNT
WEEKLY CHART
Click chart to enlarge.
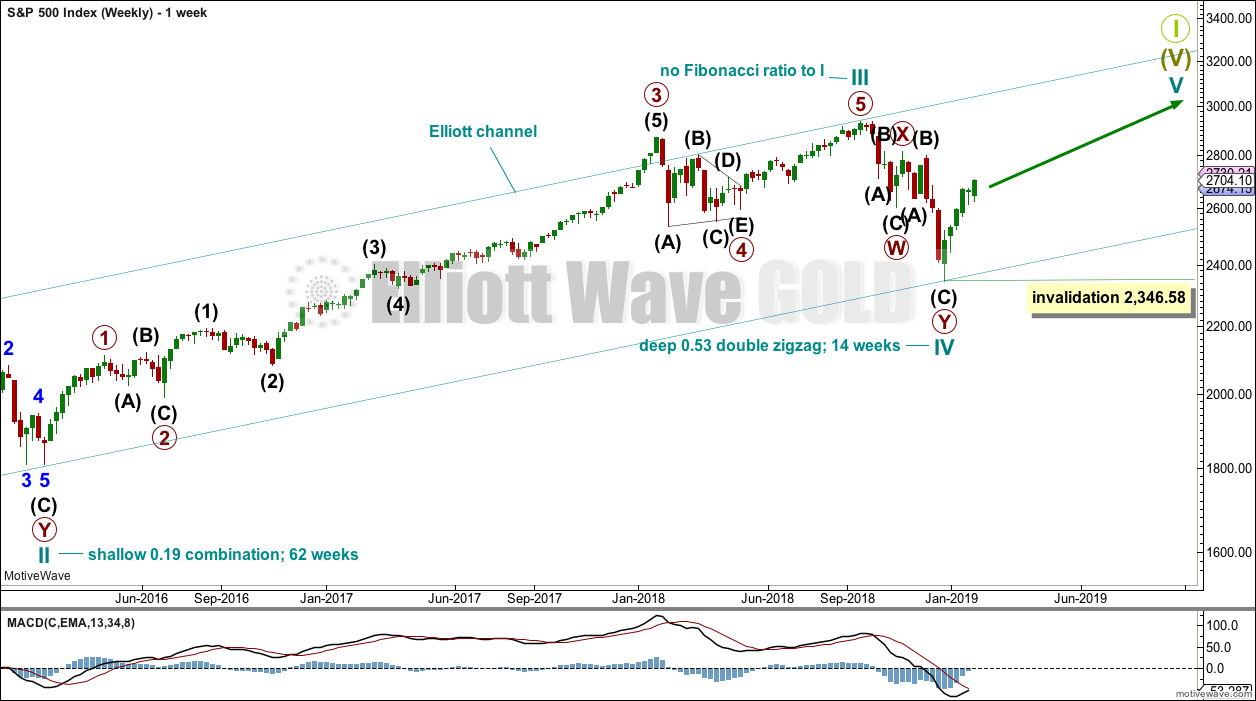
This weekly chart shows all of cycle waves III, IV and V so far.
Cycle wave II fits as a time consuming double combination: flat – X – zigzag. Combinations tend to be more time consuming corrective structures than zigzags. Cycle wave IV has completed as a multiple zigzag that should be expected to be more brief than cycle wave II.
Cycle wave IV may have ended at the lower edge of the Elliott channel.
Within cycle wave V, no second wave correction may move beyond the start of its first wave below 2,346.58.
Although both cycle waves II and IV are labelled W-X-Y, they are different corrective structures. There are two broad groups of Elliott wave corrective structures: the zigzag family, which are sharp corrections, and all the rest, which are sideways corrections. Multiple zigzags belong to the zigzag family and combinations belong to the sideways family. There is perfect alternation between the possible double zigzag of cycle wave IV and the combination of cycle wave II.
Although there is gross disproportion between the duration of cycle waves II and IV, the size of cycle wave IV in terms of price makes these two corrections look like they should be labelled at the same degree. Proportion is a function of either or both of price and time.
Draw the Elliott channel about Super Cycle wave (V) with the first trend line from the end of cycle wave I (at 2,079.46 on the week beginning 30th November 2014) to the high of cycle wave III, then place a parallel copy on the low of cycle wave II. Cycle wave V may find resistance about the upper edge.
DAILY CHART
Click chart to enlarge.
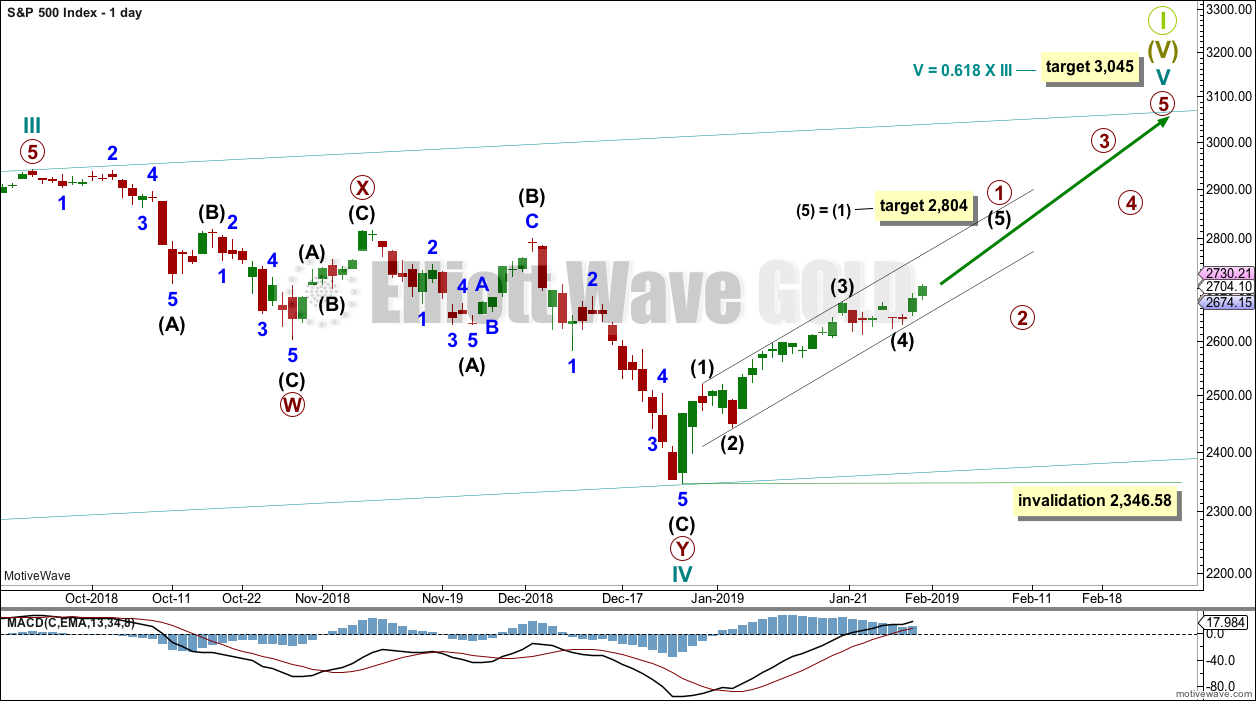
The daily chart will focus on the structure of cycle waves IV and V.
Cycle wave IV now looks like a complete double zigzag. This provides perfect alternation with the combination of cycle wave II. Double zigzags are fairly common corrective structures.
Within Super Cycle wave (V), cycle wave III may not be the shortest actionary wave. Because cycle wave III is shorter than cycle wave I, this limits cycle wave V to no longer than equality in length with cycle wave III at 3,477.39. A target is calculated for cycle wave V to end prior to this point.
Cycle wave V must subdivide as a five wave motive structure, either an impulse or an ending diagonal. An impulse is much more common and that will be how it is labelled. A diagonal would be considered if overlapping suggests it.
Within the five wave structure for cycle wave V, primary wave 1 may be incomplete. A target is calculated for intermediate wave (5) to reach the most common Fibonacci ratio to intermediate wave (1).
Within cycle wave V, primary wave 2 may not move beyond the start of primary wave 1 below 2,346.58.
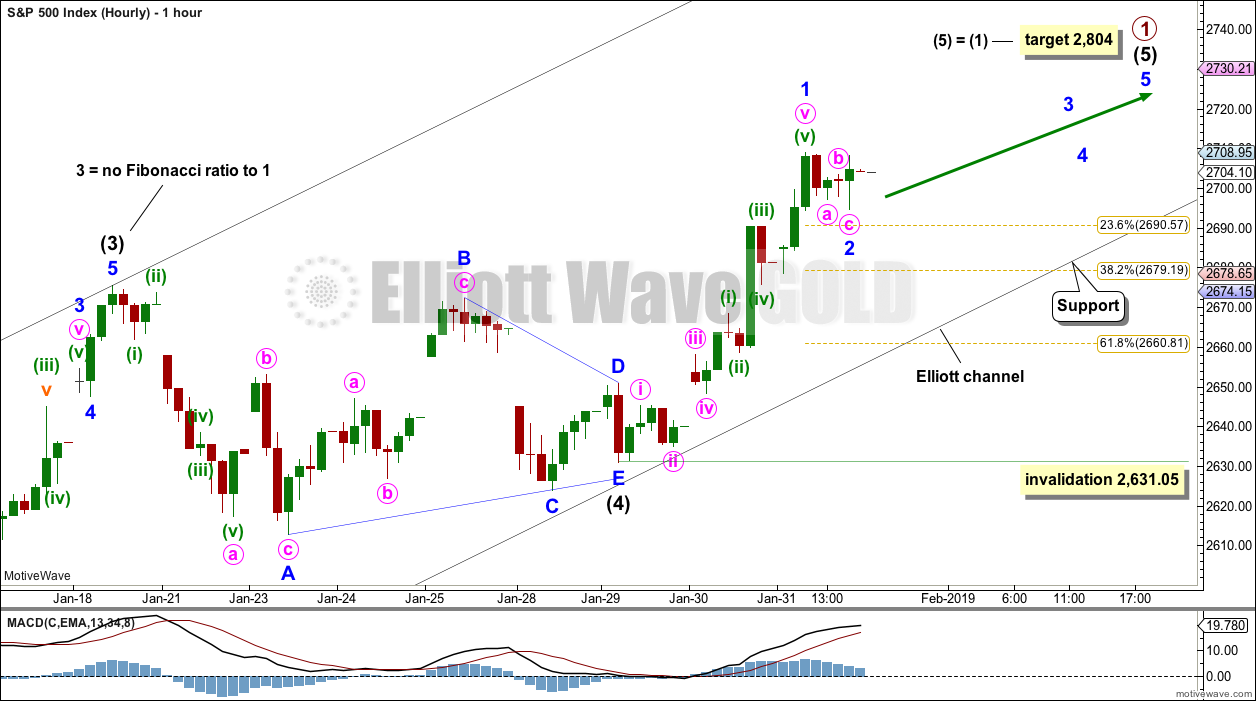
Two hourly charts are provided today. The main hourly chart has good support from classic technical analysis. The alternate hourly chart should only be used if downwards movement breaks below the lower edge of the black Elliott channel.
MAIN HOURLY CHART
Click chart to enlarge.
Intermediate wave (4) is now a complete regular contracting triangle ending within the black Elliott channel. The lower edge of this channel may continue to provide support for corrections within intermediate wave (5).
Intermediate wave (5) must subdivide as a five wave motive structure, either an impulse or an ending diagonal. An impulse is much more common, so that shall be how intermediate wave (5) is labelled. An ending diagonal will only be considered if overlapping begins to suggest it.
Within intermediate wave (5), minor wave 1 may now be complete. If it continues lower, then minor wave 2 may not move beyond the start of minor wave 1 below 2,631.05. However, it should find strong support at the lower edge of the black Elliott channel if it does continue.
If price breaks below the black channel, then the alternate hourly wave count should be used.
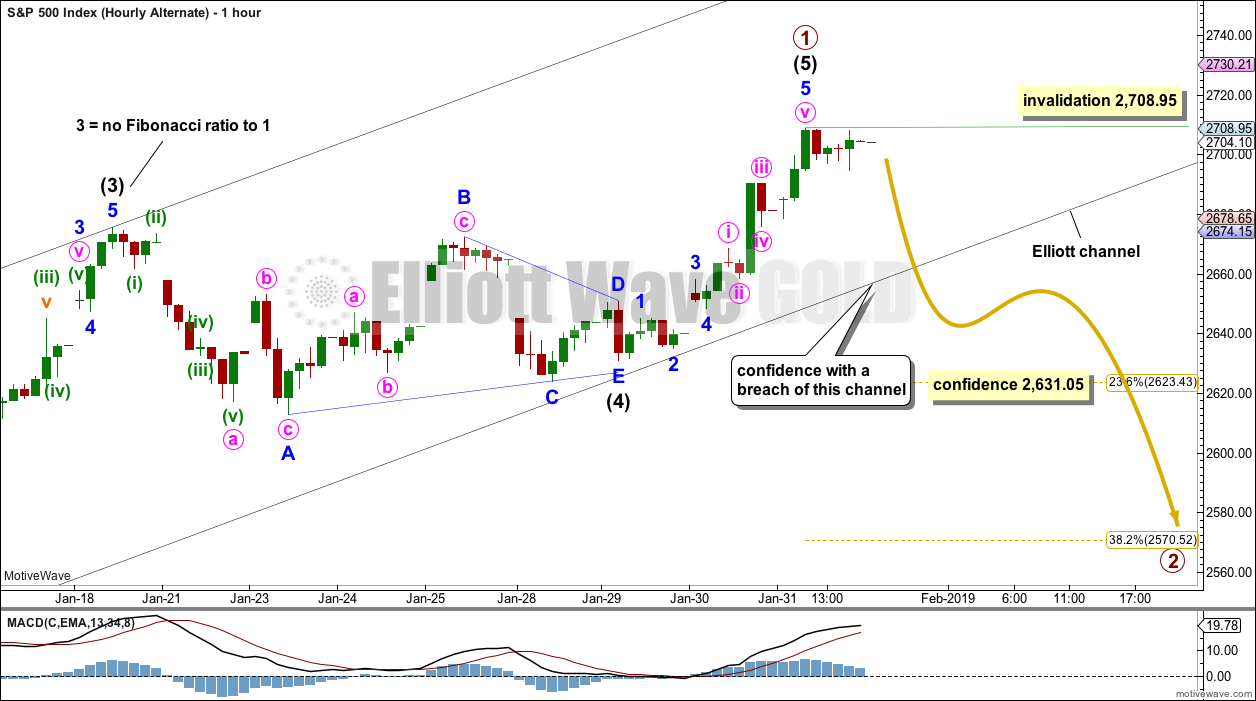
ALTERNATE HOURLY CHART
Click chart to enlarge.
If the degree of labelling within intermediate wave (5) is moved up one degree, then it is possible to see primary wave 1 as a complete five wave impulse.
The first target for primary wave 2 would be the 0.382 Fibonacci ratio of primary wave 1 at 2,570.52. Second wave corrections for this market are not always deep; intermediate wave (2) within primary wave 1 was relatively shallow at only 0.44 of intermediate wave (1).
If price reaches down to the 0.382 Fibonacci ratio and the structure of primary wave 2 is incomplete or if price keeps falling, then the next target would be the 0.618 Fibonacci ratio at 2,485.01.
A movement at primary degree should begin with a five wave structure. Within that wave 2 may not move beyond the start of wave 1 above 2,708.95.
Primary wave 2 may not move beyond the start of primary wave 1 below 2,346.58.
TECHNICAL ANALYSIS
WEEKLY CHART
Click chart to enlarge. Chart courtesy of et=”_blank”>StockCharts.com.
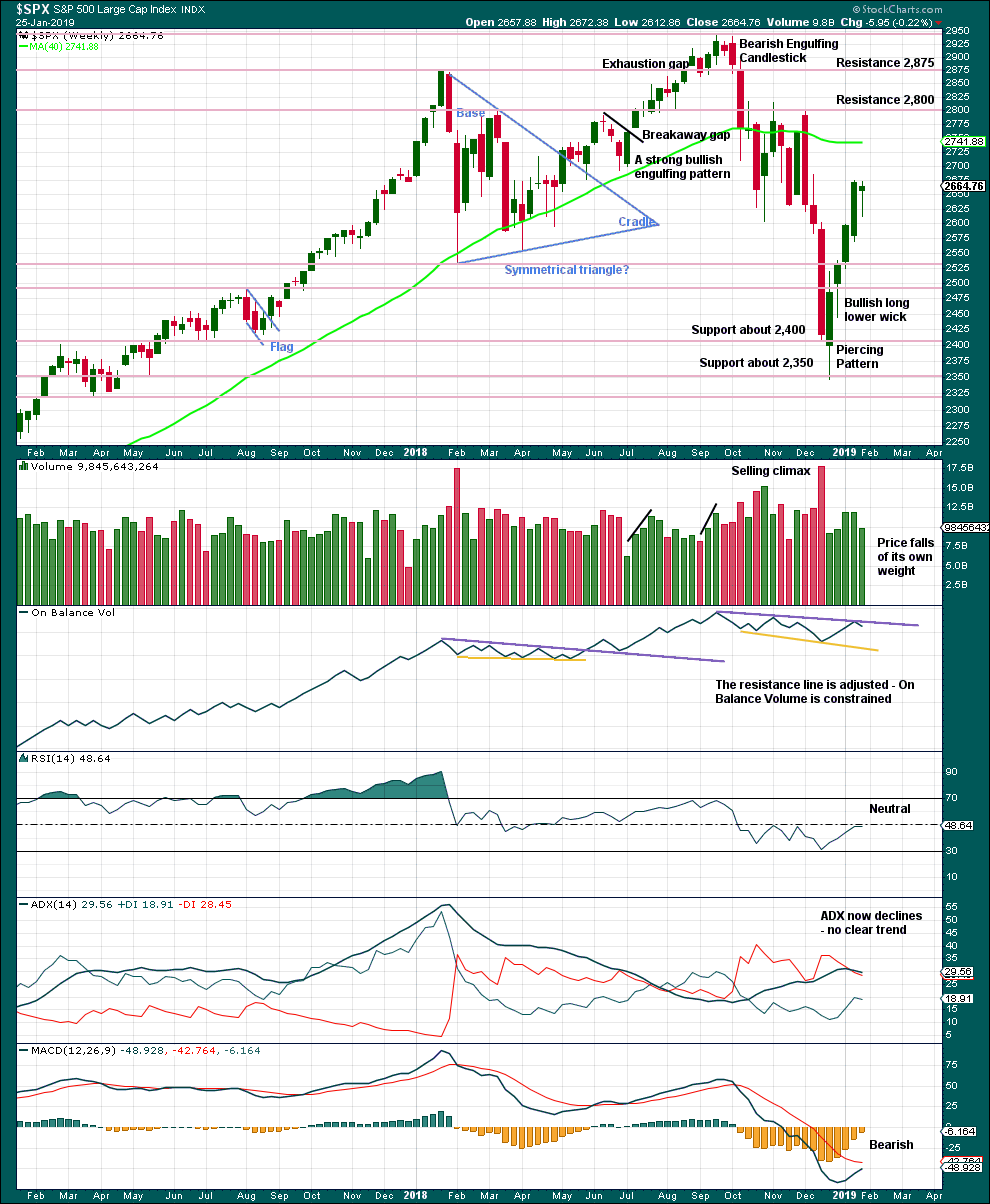
From the all time high to the low at the end of December 2018, price moved lower by 20.2% of market value meeting the definition for a bear market.
It should be noted that the large fall in price from May 2011 to October 2011 also met this definition of a bear market, yet it was only a very large pullback within a bull market, which so far has lasted almost 10 years.
The last weekly candlestick may complete a Hanging Man, which is a bearish reversal pattern, but the bullish implications of the long lower wick on a Hanging Man requires bearish confirmation. A Hanging Man reversal pattern is essentially a two candlestick pattern.
DAILY CHART
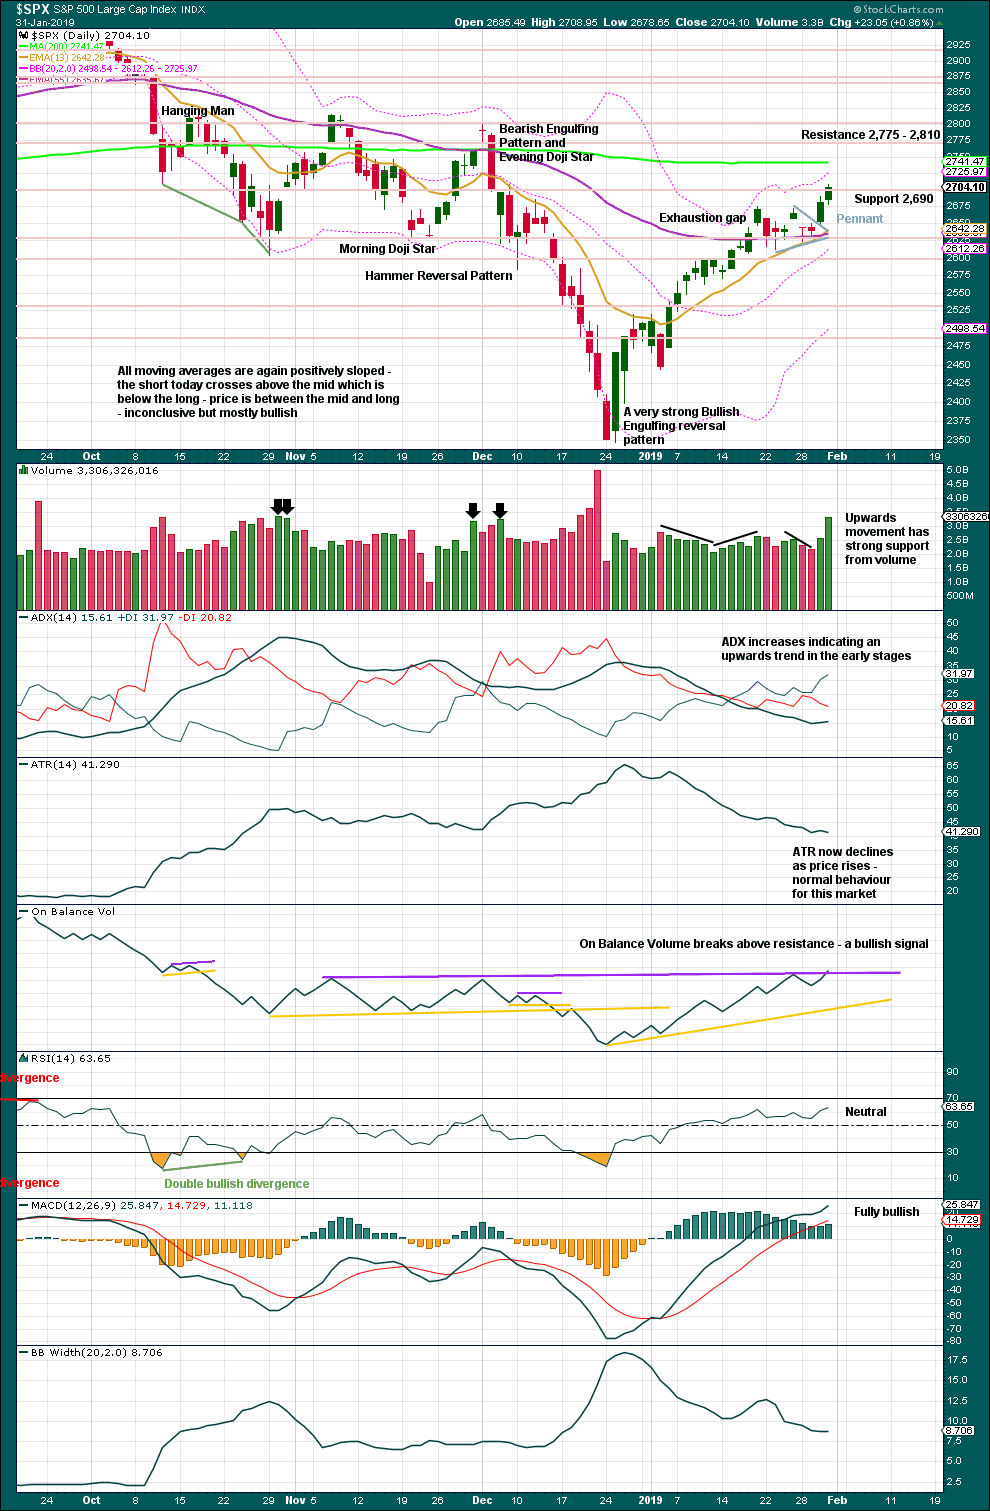
Click chart to enlarge. Chart courtesy of StockCharts.com.
Over a fairly long period of time this ageing bull market has been characterised by upwards movement on light and declining volume and low ATR. For the short to mid term, little concern may be had if price now rises again on declining volume. Current market conditions have allowed for this during a sustained rise in price.
It is also normal for this market to have lower ATR during bullish phases, and strongly increasing ATR during bearish phases. Currently, declining ATR is normal and not of a concern.
Considering the larger picture from the Elliott wave count, some weakness approaching the end of Grand Super Cycle wave I is to be expected.
From Kirkpatrick and Dhalquist, “Technical Analysis” page 152:
“A 90% downside day occurs when on a particular day, the percentage of downside volume exceeds the total of upside and downside volume by 90% and the percentage of downside points exceeds the total of gained points and lost points by 90%. A 90% upside day occurs when both the upside volume and points gained are 90% of their respective totals”…
and “A major reversal is singled when an NPDD is followed by a 90% upside day or two 80% upside days back-to-back”.
The current situation saw two 80% downside days on December 20th and 21st, then a near 90% downside day with 88.97% downside on December 24th. This very heavy selling pressure on three sessions together may be sufficient to exhibit the pressure observed in a 90% downside day.
This has now been followed by two 90% upside days: on December 26th and again on 4th January.
The current situation looks very much like a major low has been found.
The target for upwards movement following the pennant pattern remains at 2,881. While volume today strongly supports upwards movement, up volume today was only 64% of total up / down volume which suggests some weakness developing.
BREADTH – AD LINE
WEEKLY CHART
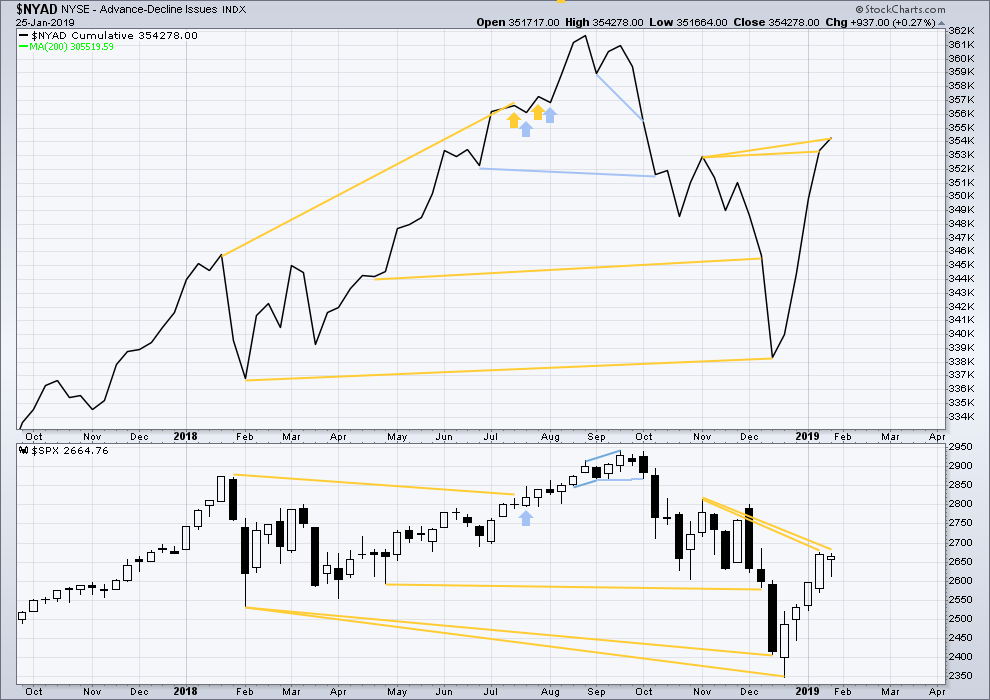
Click chart to enlarge. Chart courtesy of StockCharts.com. So that colour blind members are included, bearish signals
will be noted with blue and bullish signals with yellow.
The AD line has made another new high above the prior swing high of the week beginning 5th of November 2018, but price has not. This divergence is bullish for the mid term.
DAILY CHART
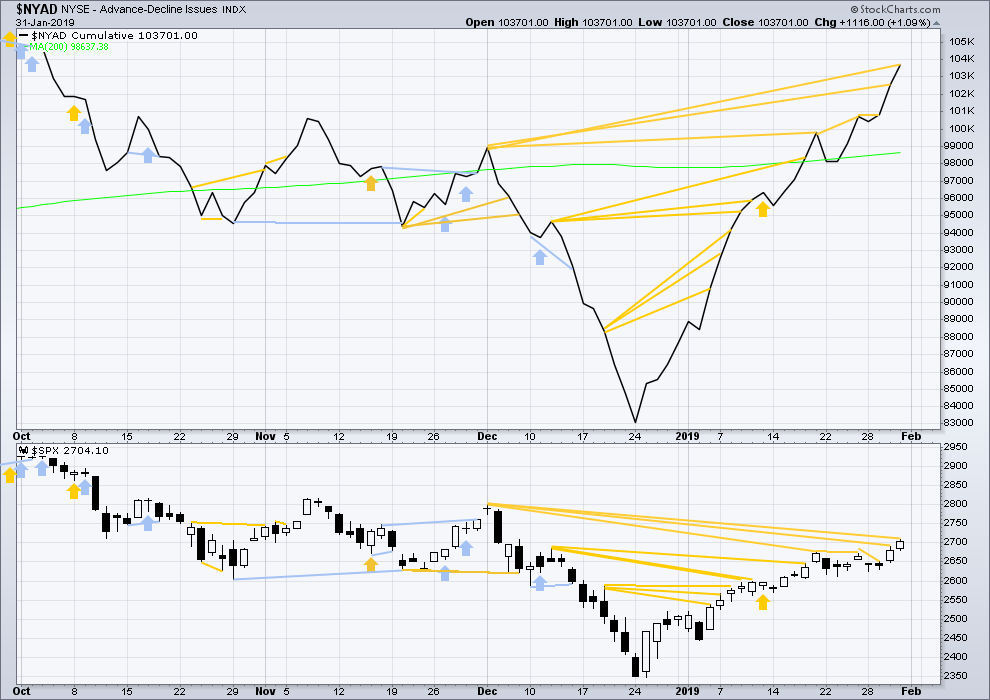
Click chart to enlarge. Chart courtesy of StockCharts.com. So that colour blind members are included, bearish signals
will be noted with blue and bullish signals with yellow.
Breadth should be read as a leading indicator.
There is now a cluster of bullish signals from the AD line. This supports the main Elliott wave count.
The AD line continues to make new highs above the prior high of the 3rd of December 2018, but price has not yet matched this high. This divergence is bullish for the mid term.
VOLATILITY – INVERTED VIX CHART
WEEKLY CHART
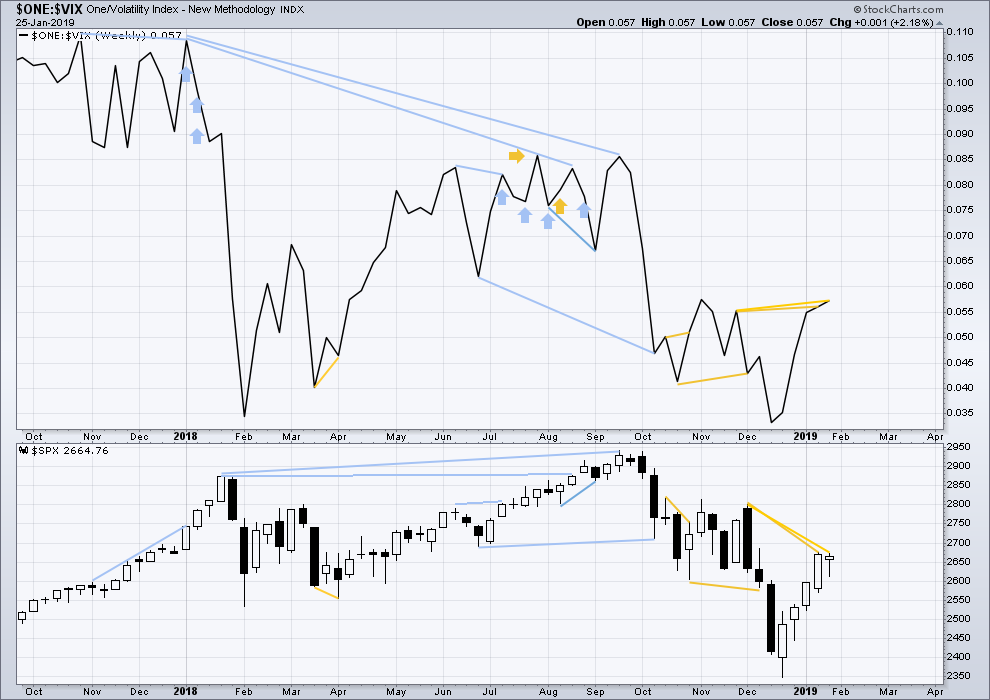
Click chart to enlarge. Chart courtesy of StockCharts.com. So that colour blind members are included, bearish signals
will be noted with blue and bullish signals with yellow.
Inverted VIX has made another new high above the prior swing high of the weeks beginning 26th of November and 3rd of December 2018, but price has not. This divergence is bullish for the mid term.
DAILY CHART
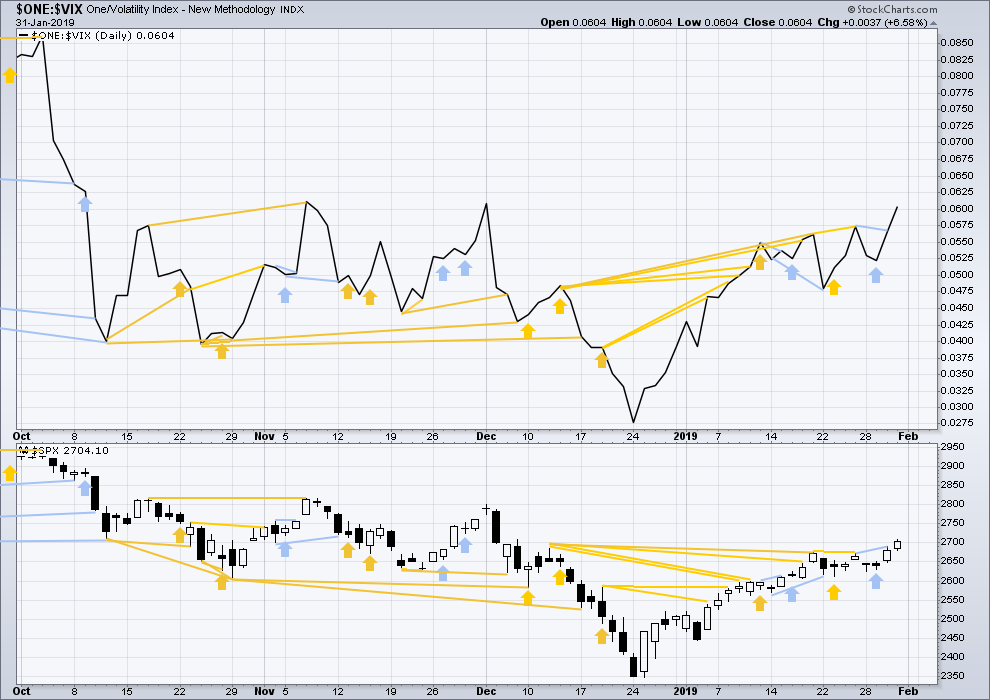
Click chart to enlarge. Chart courtesy of StockCharts.com. So that colour blind members are included, bearish signals
will be noted with blue and bullish signals with yellow.
There is now a cluster of bullish signals from inverted VIX. This supports the main Elliott wave count.
Short term bearish divergence noted in last analysis has now been followed by upwards movement. It is considered to have failed. There is no new divergence today.
DOW THEORY
Dow Theory confirms a bear market. This does not necessarily mean a bear market at Grand Super Cycle degree though; Dow Theory makes no comment on Elliott wave counts. On the 25th of August 2015 Dow Theory also confirmed a bear market. The Elliott wave count sees that as part of cycle wave II. After Dow Theory confirmation of a bear market in August 2015, price went on to make new all time highs and the bull market continued.
DJIA: 23,344.52 – a close on the 19th of December at 23,284.97 confirms a bear market.
DJT: 9,806.79 – price has closed below this point on the 13th of December.
S&P500: 2,532.69 – a close on the 19th of December at 2,506.96 provides support to a bear market conclusion.
Nasdaq: 6,630.67 – a close on the 19th of December at 6,618.86 provides support to a bear market conclusion.
Published @ 07:11 p.m. EST.
—
Careful risk management protects your trading account(s).
Follow my two Golden Rules:
1. Always trade with stops.
2. Risk only 1-5% of equity on any one trade.
Something weird is going on. Unusual, not true to form. Yesterday’s rally was signaled but there was no retracement for a long entry. It just tore off and kept going like a homesick angel.
Today’s 12 o’clock sell off was not signaled on any timeframe.
Today was a completely sideways day. The 3 hour candlestick chart shows this. But that is no excuse for a no-signal 20 point move.
These 2 things have me scratching my head.
There was a reversal signal thrown in at the end of the session. It is shown in the gold oval.
And – PS – the 2730 resistance level is still up there
–
FWIW, I am with Verne on this one in that I think the Alternate Hourly count is the one which will soon pan out. We may yet tag the underside of the 200 day ma. But I do not think it will remain there very long. Of course I may be quite wrong. The main count is the main count for very good reasons. But as of now, I remain 100% in cash at all accounts, short term and long term.
Main hourly chart updated:
Minor 2 may now be an expanded flat.
At 2,693.59 minute c would = 1.618 X minute a. This is close to the 0.236 Fibonacci ratio of minor wave 1 at 2,690.57 giving a target zone of 2,690 – 2,693.
Thereafter minor 3 upwards should exhibit some increase in momentum.
I am suspicious that Intermediate 4 ended at around 3pm on the 29th as opposed to 11am. This would change the count for minor 1 to the high of today instead of the high yesterday.
It would still see the current sideways movement minor wave 2 though. To see it as part of minor wave 1 still, the proportion doesn’t look right. No matter how you draw a channel about minor wave 1 it’s now been breached by sideways movement.
IF this is the B wave of a flat correction, THEN 2717: c = 0.618 a
but I always forget the limit how long the B can extend compared to the A…
Wave b is usually between 100 and 138%
There is no rule stating a limit. B waves are most commonly 1 – 1.38 X wave A, but they can be longer.
This one may be 1.54 X wave A. That’s okay.
There is a convention within EW that when a potential B wave reaches 2 X wave A, the idea should be discarded based upon very low probability.
I have seen a very few B waves within expanded flats that were longer than 2 X wave A, but it is rare.
Gold (this is GLD weekly) is awfully close to the 78.6% retrace level of the 2018 high to low (125.6), and that level is going to be significant either way: a break and price is probably going the 100% at 129.5 (at least). A turn and dropping back to 118 is highly possible.
here’s kind of a cool thing happening with today’s 4 hour candles … 16 hours of spinning tops/ uncertainty candles
the candle on the right that’s popping up is just 20 minutes old and won’t be finalized until 4 PM today
Nice chart! thanks…
And same to Kevin as always…
Hey Peter,
here’s one …
good signal on the 5 minute chart shown in the gold oval
the retracement candles failed to make a reversal signal … candle # 2 in the blue box is a fail … so the trend is still up and the retracement candles are just doing the expected pullback for a long entry
today’s target is ES 2730
FWIW … there is a nice resistance level today at ES 2730
First at 2712-15, a 61.8% and 78.6% overlapped. Breaking those would be a strong indicator of substantially higher prices coming. IMO.
Here’s why. SPX daily. The next fractal turn levels are up around 2815 (two overlapped fibo’s again). Lots of room to run here!
Not happening. Interim top just ahead…
Look at bearish divergences…
Maaaaaybe Wilbur!! I don’t consider the fibo resistance at 2715 broken yet, just scribbled on, and it is absolutely a natural place for an interim high.
Attempt #2 getting turned away…
Hear me now, and believe me later…trade it!! 🙂
I’m listening to you.
But I trade the market action. And so far, it is indicating (but not yet confirming) your outlook. Let’s see what the next hour or three brings…
Caution always wise.
Look for gravestone doji to hold, and SPX to surrender 2700 on close for confirmation…. 🙂
I sold a bunch of vxx 34-32-50 put spreads for next week
Along with the s and p 273-275 call spreads for Wednesday
I hope your right
I see 2737 as a major top If it gets there an am ready to go long or short those strikes
Good to see you posting Verne!
I miss your posts…
Post more often Mister… your insight is much appreciated 🙂
Missed you guys as well.
Very busy these days with new venture with Bryan.
Will try and stop in more often… 🙂
Hi Verne, how low are you gonna go?
That is a great question. I am not sure…it could be lower than some expect, depending on how sharp the move down from the 200 pivot.
VIX should give some clues with the size and shape of the next few candles…
Thank you for that alternate with a nice “trigger” (the channel line) that is well above the triangle swing lows. That’s really valuable. Just in case!
You’re welcome 🙂