Last analysis identified a small pennant pattern and expected an upwards breakout. This is exactly what has happened.
Targets are calculated using an Elliott wave count with Fibonacci ratios, and the flag pole of the pennant.
Summary: A small pennant pattern has now been followed by an upwards breakout, which has support from volume. The target for more upwards movement is now at 2,804 (Elliott wave) or 2,881 (classic analysis).
At about one of these targets a large pullback for a second wave at primary degree may begin.
The bigger picture still expects that a low may now be in place. The target is at 3,045 with a limit at 3,477.39.
New updates to this analysis are in bold.
The biggest picture, Grand Super Cycle analysis, is here.
The monthly chart was last published here.
ELLIOTT WAVE COUNT
WEEKLY CHART
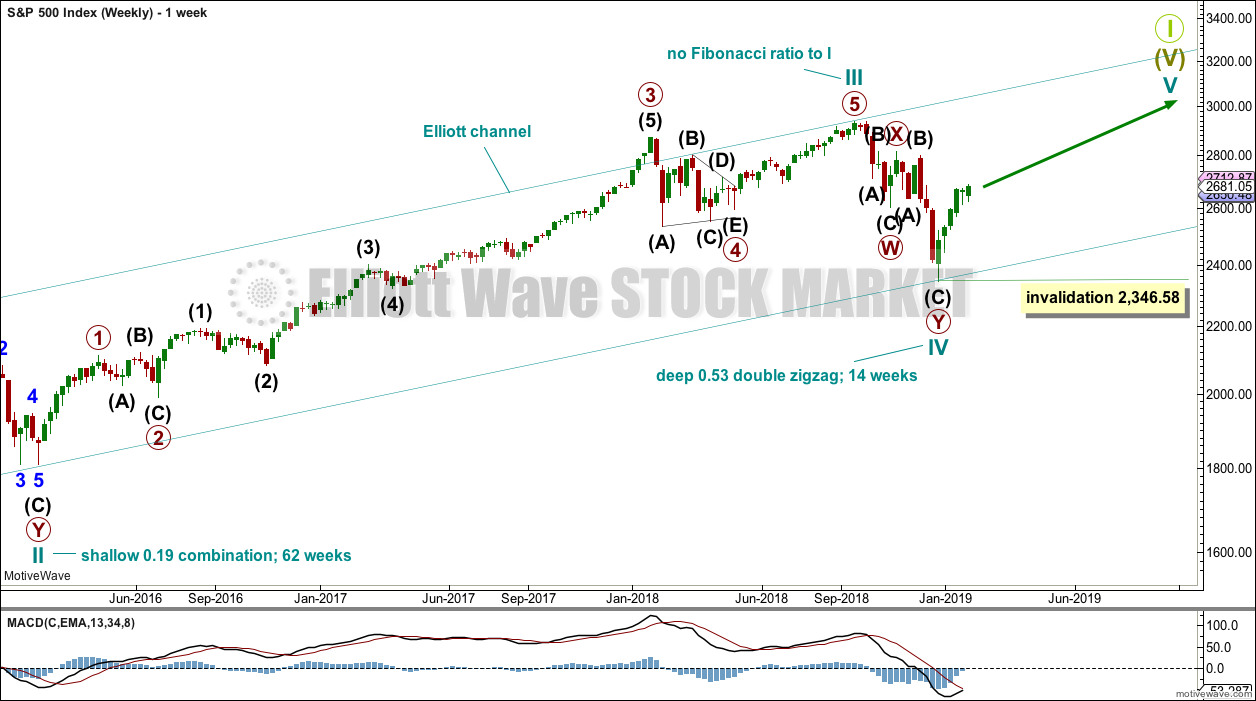
This weekly chart shows all of cycle waves III, IV and V so far.
Cycle wave II fits as a time consuming double combination: flat – X – zigzag. Combinations tend to be more time consuming corrective structures than zigzags. Cycle wave IV has completed as a multiple zigzag that should be expected to be more brief than cycle wave II.
Cycle wave IV may have ended at the lower edge of the Elliott channel.
Within cycle wave V, no second wave correction may move beyond the start of its first wave below 2,346.58.
Although both cycle waves II and IV are labelled W-X-Y, they are different corrective structures. There are two broad groups of Elliott wave corrective structures: the zigzag family, which are sharp corrections, and all the rest, which are sideways corrections. Multiple zigzags belong to the zigzag family and combinations belong to the sideways family. There is perfect alternation between the possible double zigzag of cycle wave IV and the combination of cycle wave II.
Although there is gross disproportion between the duration of cycle waves II and IV, the size of cycle wave IV in terms of price makes these two corrections look like they should be labelled at the same degree. Proportion is a function of either or both of price and time.
Draw the Elliott channel about Super Cycle wave (V) with the first trend line from the end of cycle wave I (at 2,079.46 on the week beginning 30th November 2014) to the high of cycle wave III, then place a parallel copy on the low of cycle wave II. Cycle wave V may find resistance about the upper edge.
DAILY CHART
The daily chart will focus on the structure of cycle waves IV and V.
Cycle wave IV now looks like a complete double zigzag. This provides perfect alternation with the combination of cycle wave II. Double zigzags are fairly common corrective structures.
Within Super Cycle wave (V), cycle wave III may not be the shortest actionary wave. Because cycle wave III is shorter than cycle wave I, this limits cycle wave V to no longer than equality in length with cycle wave III at 3,477.39. A target is calculated for cycle wave V to end prior to this point.
Cycle wave V must subdivide as a five wave motive structure, either an impulse or an ending diagonal. An impulse is much more common and that will be how it is labelled. A diagonal would be considered if overlapping suggests it.
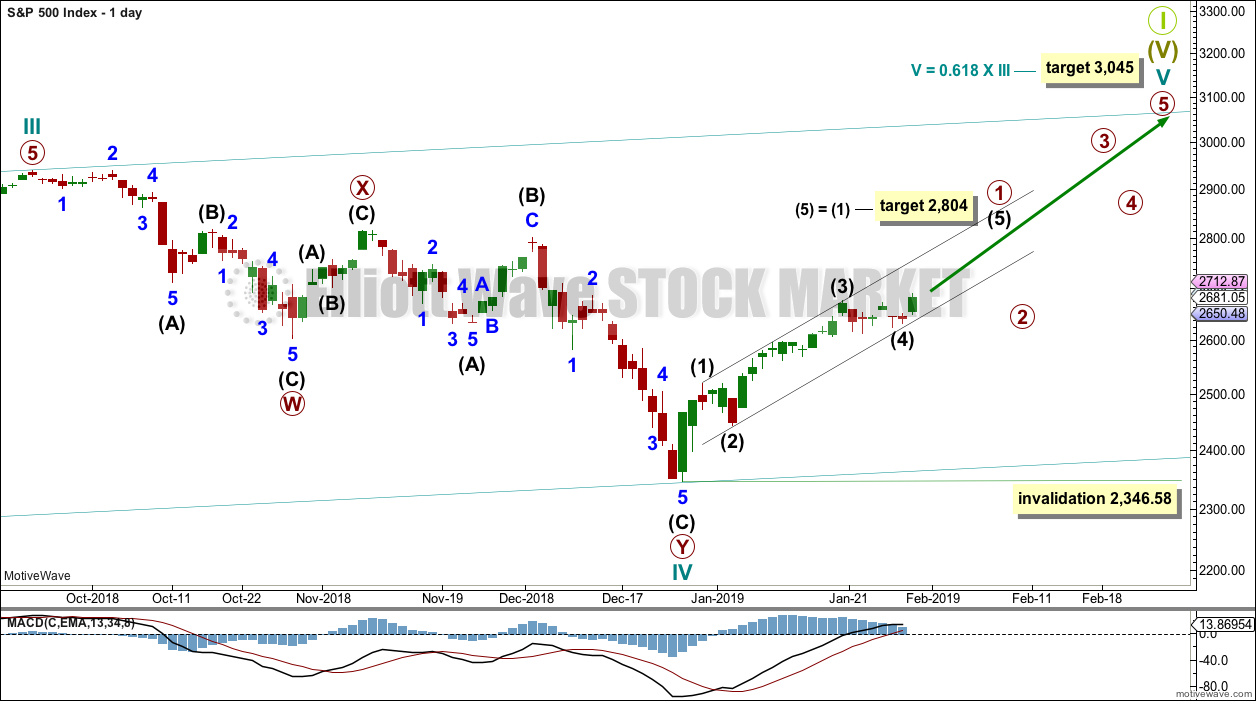
Within the five wave structure for cycle wave V, primary wave 1 may be incomplete. A target is calculated for intermediate wave (5) to reach the most common Fibonacci ratio to intermediate wave (1).
Within cycle wave V, primary wave 2 may not move beyond the start of primary wave 1 below 2,346.58.
The alternate wave count that looked at the possibility that primary wave 1 may have been over at the last high and primary wave 2 may be underway is discarded today. Upwards movement today has strength and support from volume. This does not look like a B or X wave within primary wave 2.
Only one hourly chart remains.
HOURLY CHART
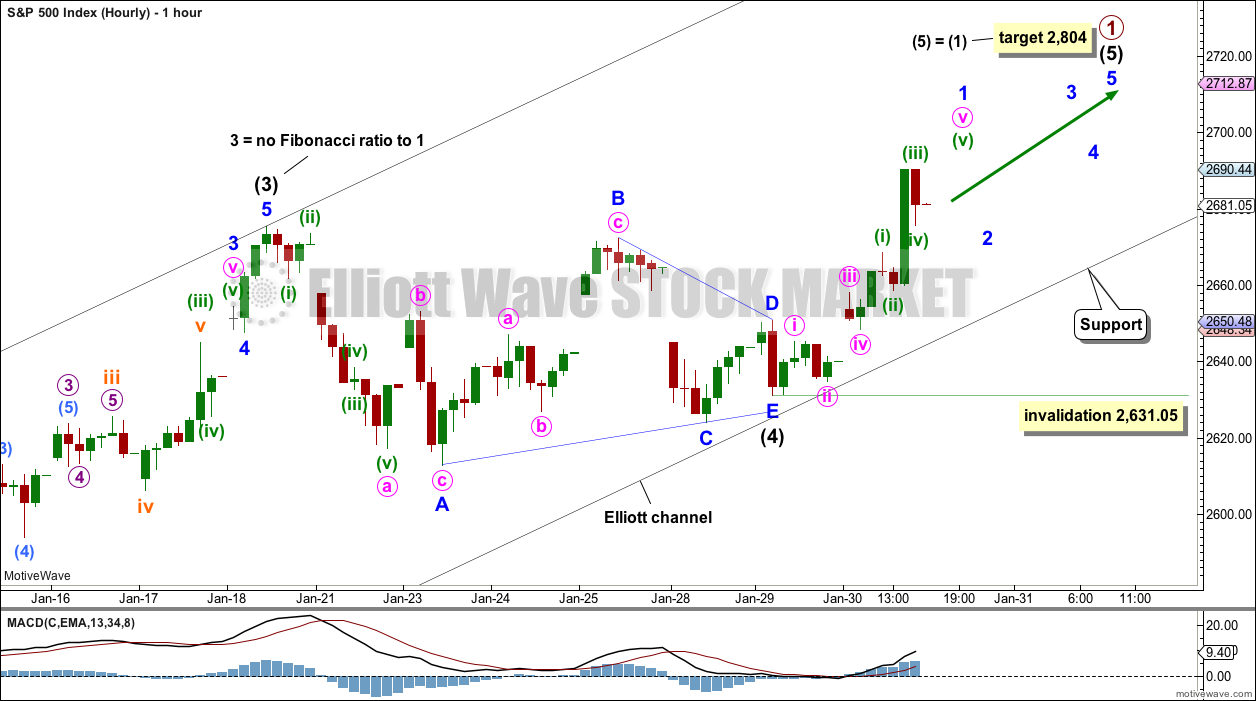
Intermediate wave (4) is now a complete regular contracting triangle ending within the black Elliott channel. The lower edge of this channel may continue to provide support for corrections within intermediate wave (5).
Intermediate wave (5) must subdivide as a five wave motive structure, either an impulse or an ending diagonal. An impulse is much more common, so that shall be how intermediate wave (5) is labelled. An ending diagonal will only be considered if overlapping begins to suggest it.
Within intermediate wave (5), minor wave 1 may be incomplete. However, there is more than one valid way to label upwards movement today. This labelling is the most conservative idea, leaving the invalidation point at the start of minor wave 1. Minor wave 2 may not move beyond the start of minor wave 1 below 2,631.05.
TECHNICAL ANALYSIS
WEEKLY CHART
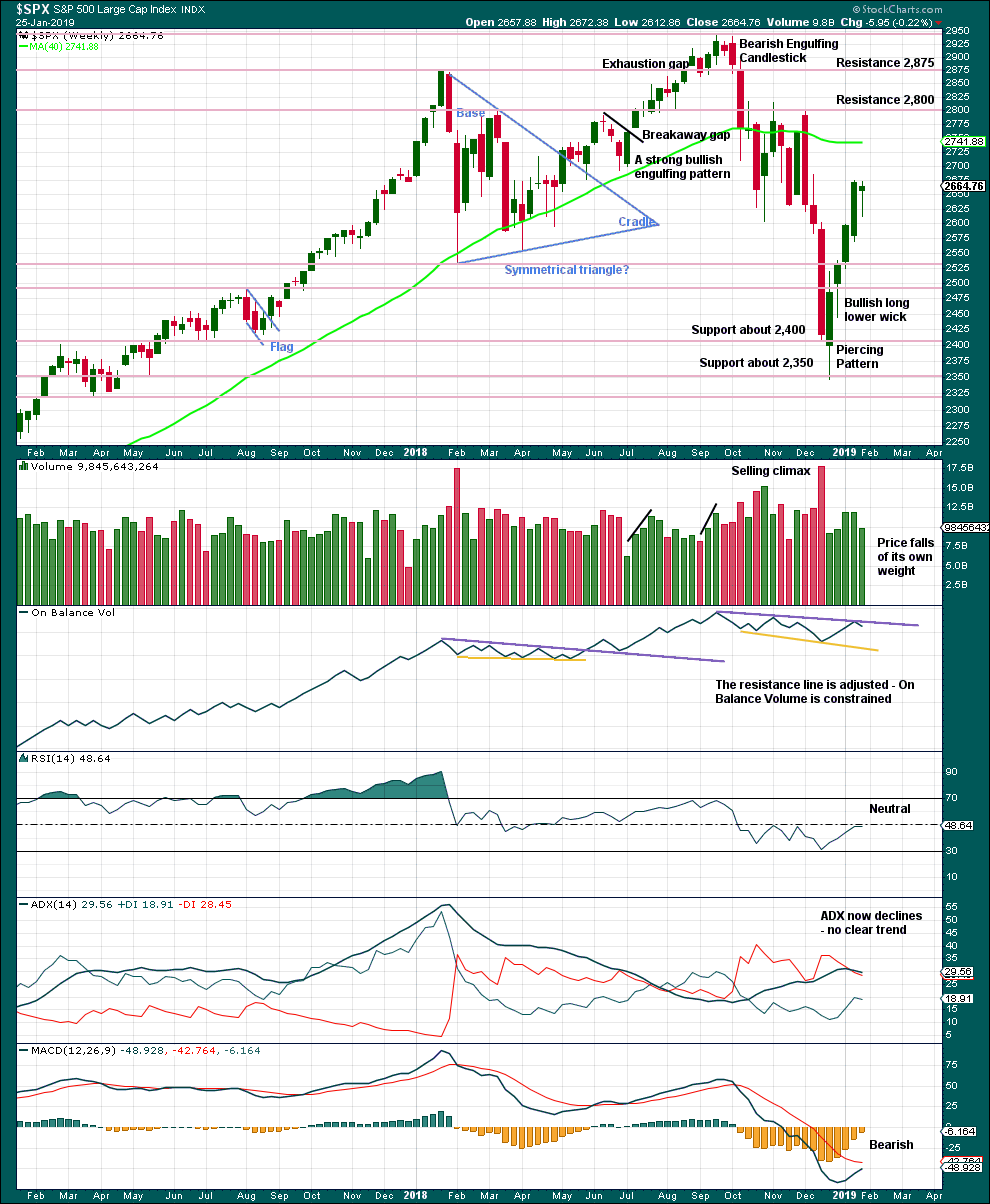
Click chart to enlarge. Chart courtesy of et=”_blank”>StockCharts.com.
From the all time high to the low at the end of December 2018, price moved lower by 20.2% of market value meeting the definition for a bear market.
It should be noted that the large fall in price from May 2011 to October 2011 also met this definition of a bear market, yet it was only a very large pullback within a bull market, which so far has lasted almost 10 years.
The last weekly candlestick may complete a Hanging Man, which is a bearish reversal pattern, but the bullish implications of the long lower wick on a Hanging Man requires bearish confirmation. A Hanging Man reversal pattern is essentially a two candlestick pattern.
DAILY CHART
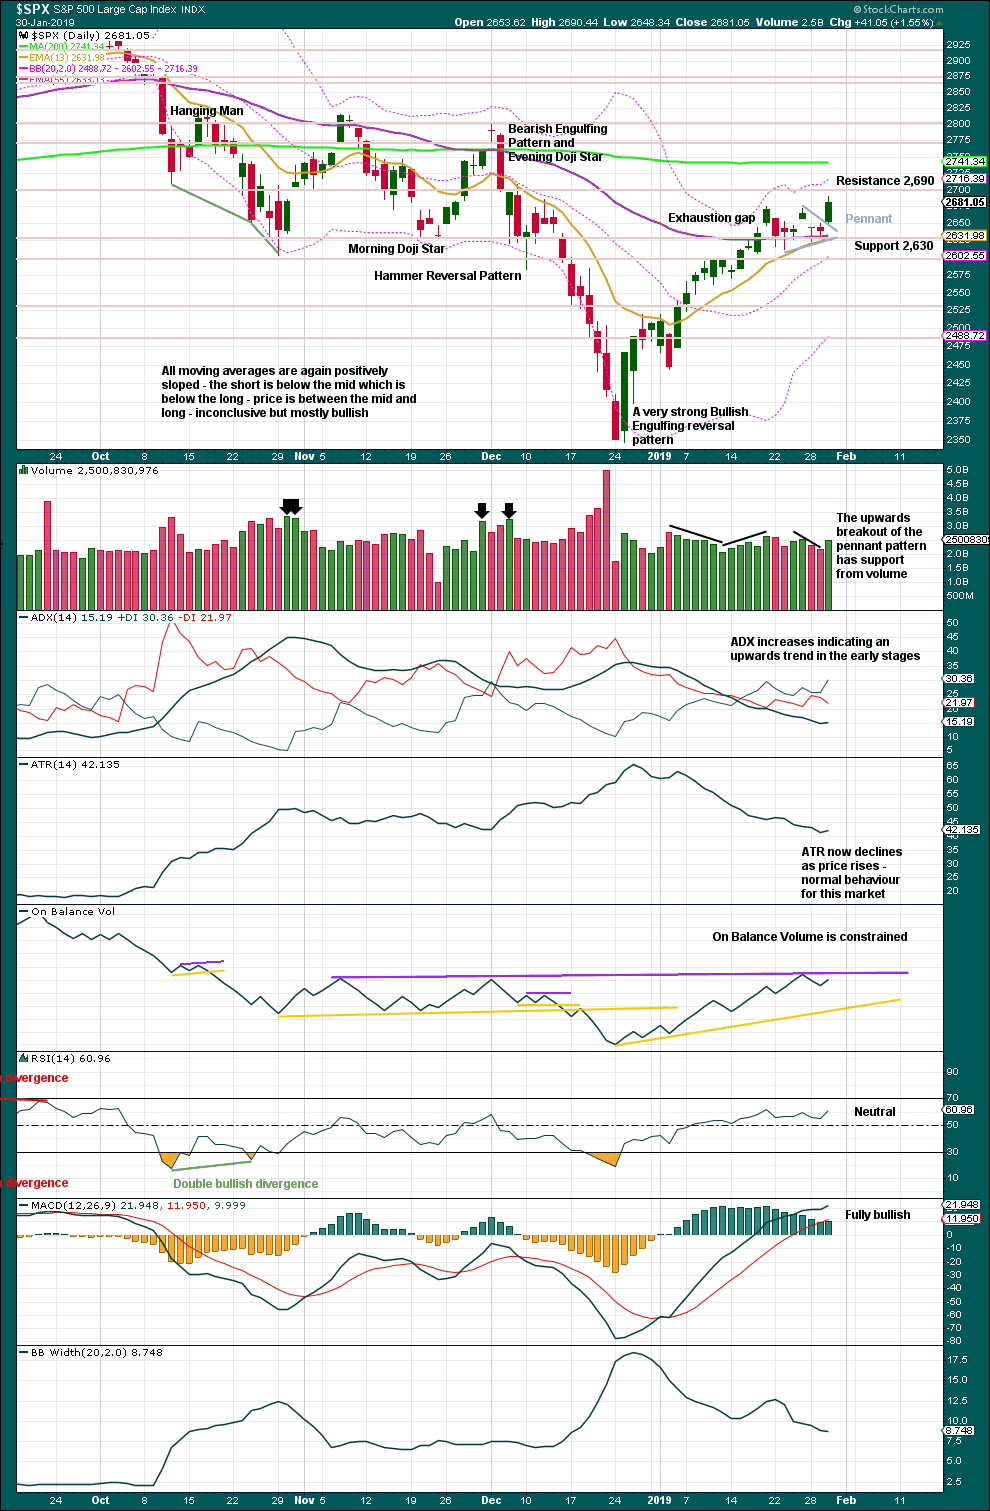
Click chart to enlarge. Chart courtesy of StockCharts.com.
Over a fairly long period of time this ageing bull market has been characterised by upwards movement on light and declining volume and low ATR. For the short to mid term, little concern may be had if price now rises again on declining volume. Current market conditions have allowed for this during a sustained rise in price.
It is also normal for this market to have lower ATR during bullish phases, and strongly increasing ATR during bearish phases. Currently, declining ATR is normal and not of a concern.
Considering the larger picture from the Elliott wave count, some weakness approaching the end of Grand Super Cycle wave I is to be expected.
From Kirkpatrick and Dhalquist, “Technical Analysis” page 152:
“A 90% downside day occurs when on a particular day, the percentage of downside volume exceeds the total of upside and downside volume by 90% and the percentage of downside points exceeds the total of gained points and lost points by 90%. A 90% upside day occurs when both the upside volume and points gained are 90% of their respective totals”…
and “A major reversal is singled when an NPDD is followed by a 90% upside day or two 80% upside days back-to-back”.
The current situation saw two 80% downside days on December 20th and 21st, then a near 90% downside day with 88.97% downside on December 24th. This very heavy selling pressure on three sessions together may be sufficient to exhibit the pressure observed in a 90% downside day.
This has now been followed by two 90% upside days: on December 26th and again on 4th January.
The current situation looks very much like a major low has been found.
The breakout from the pennant pattern is bullish. The target remains at 2,881.
BREADTH – AD LINE
WEEKLY CHART
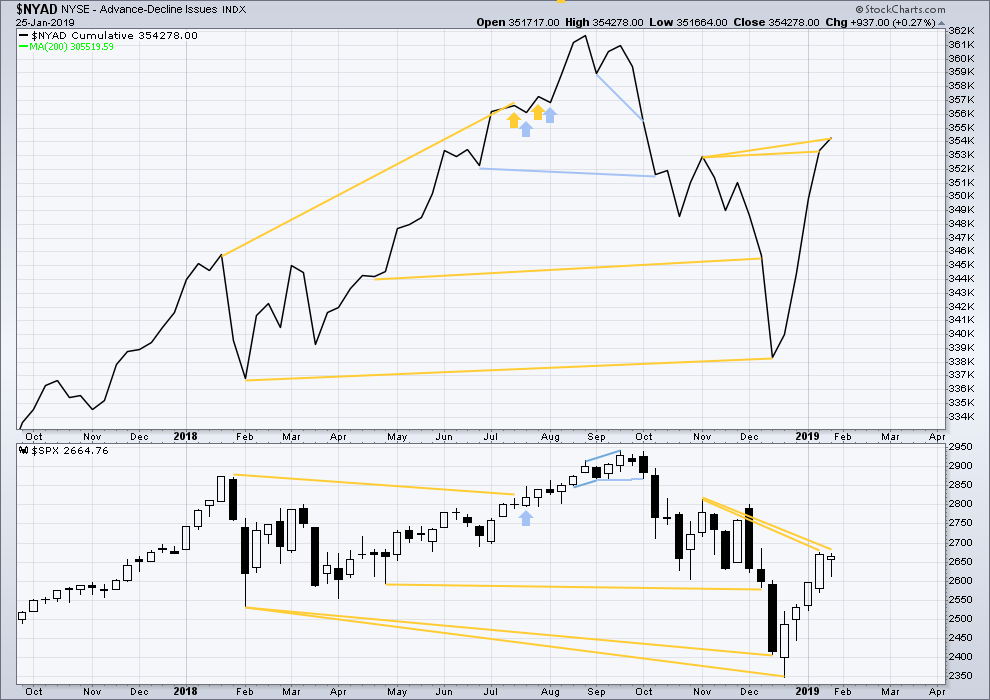
Click chart to enlarge. Chart courtesy of StockCharts.com. So that colour blind members are included, bearish signals
will be noted with blue and bullish signals with yellow.
The AD line has made another new high above the prior swing high of the week beginning 5th of November 2018, but price has not. This divergence is bullish for the mid term.
DAILY CHART
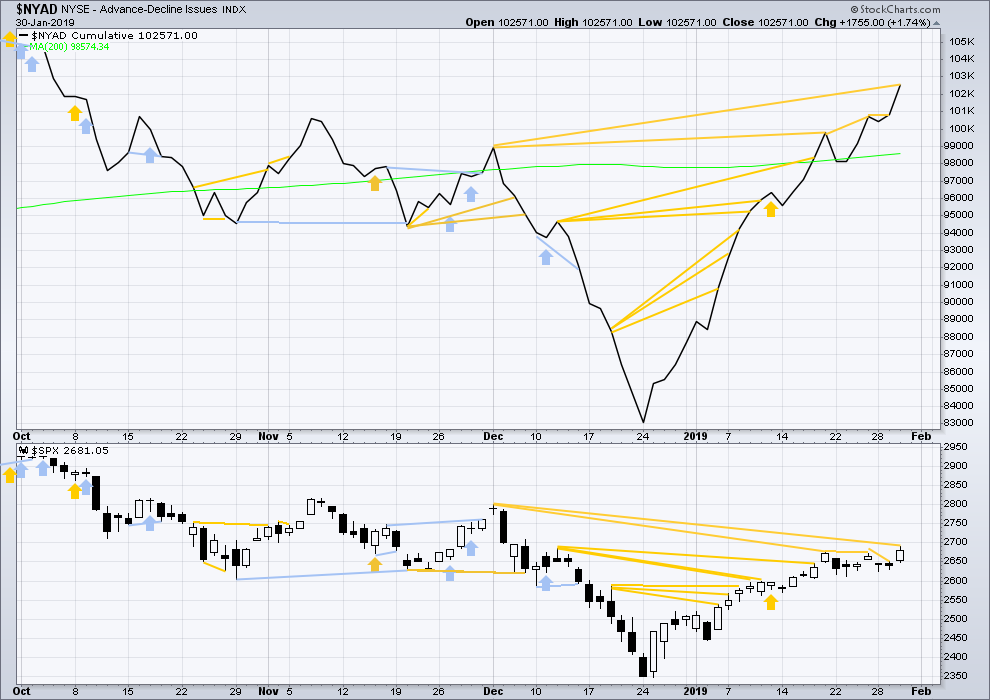
Click chart to enlarge. Chart courtesy of StockCharts.com. So that colour blind members are included, bearish signals
will be noted with blue and bullish signals with yellow.
Breadth should be read as a leading indicator.
There is now a cluster of bullish signals from the AD line. This supports the main Elliott wave count.
The AD line has made another new high above the prior high of the 3rd of December 2018, but price has not yet matched this high. This divergence is bullish for the mid term.
VOLATILITY – INVERTED VIX CHART
WEEKLY CHART
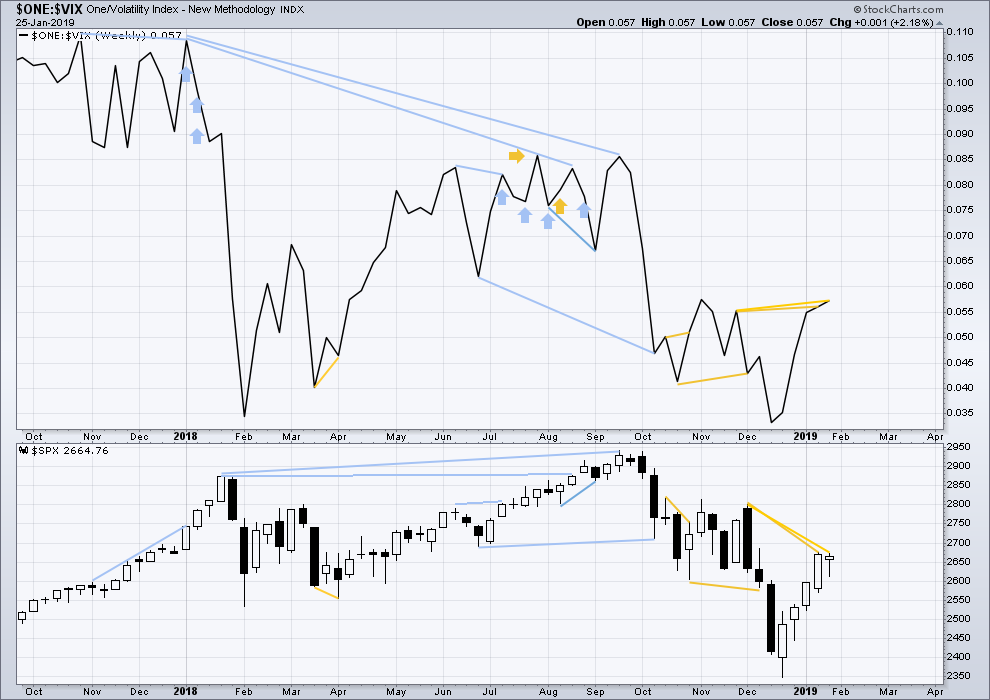
Click chart to enlarge. Chart courtesy of StockCharts.com. So that colour blind members are included, bearish signals
will be noted with blue and bullish signals with yellow.
Inverted VIX has made another new high above the prior swing high of the weeks beginning 26th of November and 3rd of December 2018, but price has not. This divergence is bullish for the mid term.
DAILY CHART
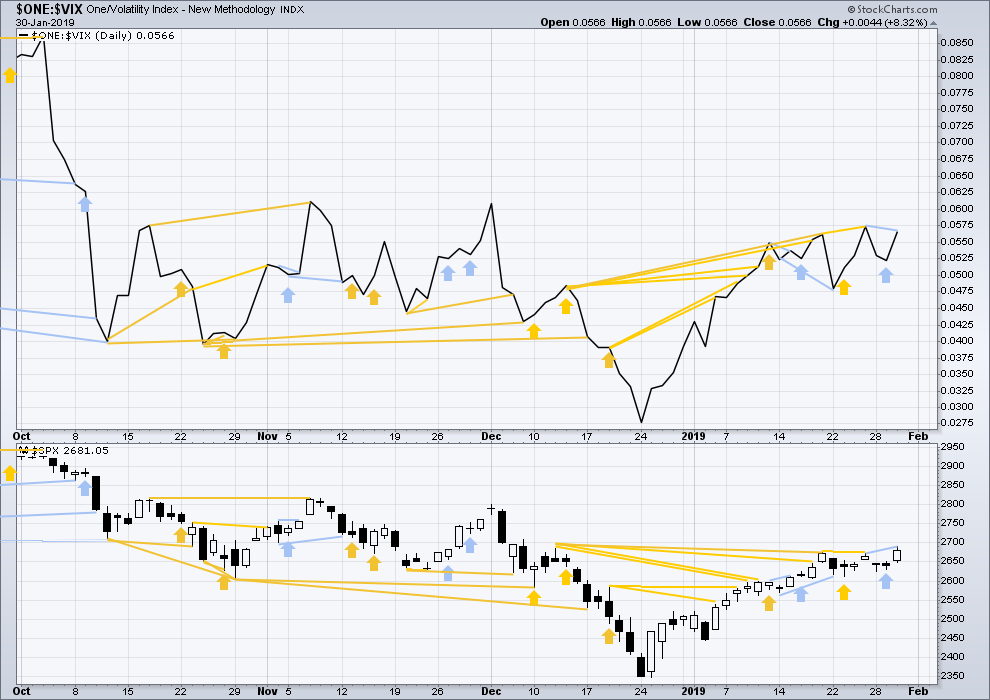
Click chart to enlarge. Chart courtesy of StockCharts.com. So that colour blind members are included, bearish signals
will be noted with blue and bullish signals with yellow.
There is now a cluster of bullish signals from inverted VIX. This supports the main Elliott wave count.
Price has made a new high above the prior high of the 25th of January, but inverted VIX has not made a corresponding new high. This divergence is bearish for the short term.
Less weight today will be given to inverted VIX though; it is not as reliable as the AD line, and this divergence is more short term.
DOW THEORY
Dow Theory confirms a bear market. This does not necessarily mean a bear market at Grand Super Cycle degree though; Dow Theory makes no comment on Elliott wave counts. On the 25th of August 2015 Dow Theory also confirmed a bear market. The Elliott wave count sees that as part of cycle wave II. After Dow Theory confirmation of a bear market in August 2015, price went on to make new all time highs and the bull market continued.
DJIA: 23,344.52 – a close on the 19th of December at 23,284.97 confirms a bear market.
DJT: 9,806.79 – price has closed below this point on the 13th of December.
S&P500: 2,532.69 – a close on the 19th of December at 2,506.96 provides support to a bear market conclusion.
Nasdaq: 6,630.67 – a close on the 19th of December at 6,618.86 provides support to a bear market conclusion.
Published @ 08:57 p.m. EST.
—
Careful risk management protects your trading account(s).
Follow my two Golden Rules:
1. Always trade with stops.
2. Risk only 1-5% of equity on any one trade.

There’s strong support from volume for upwards movement today, and a bullish signal from On Balance Volume. This supports the Elliott wave count.
Hourly chart updated:
Minor 2 could be over. Or it could move lower. It does not necessarily have to be deep. But if it is it should find support at the lower edge of the black channel.
If members are waiting for minor 2 to be deep, it may not happen.
Important to keep in mind that while a lot more intermediate 5 up is expected…all the requirements for a primary 1 up are met, and a PRIMARY 2 DOWN could start up anytime. Just sayin’…
If price makes a new low below 2,631.05 then I’d make the call for primary 2 to have arrived.
If today’s upwards day shows strength I’d then have more confidence that primary 1 will continue higher.
Any one interested in breaking down the count on the $COT 1 month chart for a newb? This is daily bar- my counts dont make sense to me.
*doesn’t
I don’t do EW counts on individual equities anymore. They just don’t have enough volume for any reliability in EW analysis.
I really like AAL to the short side here. This is daily bars. The hourly is in a multi-hour squeeze with momentum down. The trend line shown offers a high quality very close by stop point. I bought ITM April puts myself. (I buy a ways out to minimize premium decay costs.)
well I scored on the EEMs (a double, sold half and will let the rest ride) so thanks for that, and I just grabbed some AAL puts too
yea, EEM tagged a 38% fibo and not a bad place to take profit IMO. I did too. G’luck with the AAL.
Symmetry in the market is awesome (symmetry = the tendency of price moves to be the same length). I projected the move from the 1/18 to 1/19 low to high off the recent triangle low, and it projected to 2709. The high before the turn the market is in now…2708.96. Perfect. And symmetry tends to operate at all time frames.
Just a bit higher….I think…
August 11 and Dec 3 had nice clear dojis…we should probably expect another one… 🙂
Forty days and 40 nights
ok….. what am looking for here?
Did I get it right this time CM?
Peter is this a 10 min chart ?
5
I don’t know much about this signal, but I will say this: it’s going to be valid A LOT MORE OFTEN when the signal is in line the current and/or next time frame higher trend. I believe the initial description of it (which proved quite accurate that time) was indeed such. Here, you are looking at a pullback in a major uptrend. IMO that makes any such signal quite weak. Perhaps better to wait for the signal that reinitiates the primary trend (up in this case), and go long with that. My $0.02.
Hey Peter,
The rules that I use are my own made-up rules based on my observations. I think that the algos are using these signals but there really is no right or wrong.
This chart shows this little piece of the trading day that you are looking at. In my rules, the 5-minute candle signal requires 4 candles. Since the candles are Heikin-Ashi they each have a specific relationship to its previous candle. For ease of discussion let’s refer to them as candles 1 through 4, from left to right.
Candle # 1 meets my criteria. Its real body is inside of the previous candle’s real body. And candle # 1’s range covers the real body of the previous candle’s real body. Each of these criteria is a deal killer. You must have them both for candle one to be valid.
Candles 2, 3, & 4 need to have certain criteria. What we’re looking for in these candles is: Flat bottom, and A lower low than the previous candle’s low. I’m talking about the range being lower.
Candle # 2 has a requirement that it closes below candle # 1’s range.
Looking at this group of 4 candles # 2 is invalid because it does not have a flat bottom and does not close below candle # 1’s range. So, this signal would be dismissed here as an invalid signal.
Candle # 3 is also invalid because its range does not make a lower low.
— Of course, if the signal is going up, you need higher highs and higher closes —
At this point we know that a reversal of trend is not being signaled. The blue line on the chart is today’s R1 pivot point level. So, the point of this move was just a pullback to R1.
Maybe this move up has quit. The second half of today’s session has been suspiciously sideways. But then again, it’s the last day of January…
One last thing, these rules apply to 5, 10, 15, 20, and 30 minute charts. On 1, 2, 3, 4, and 8 hour charts the criteria is somewhat “relaxed” and not as specific with the requirements. For this reason I will make trade entries and exits based on the shorter duration timeframes.
This is just a wide angle view of the channel that Lara has already pointed out for us.
(the 40 days and 40 nights chart)
wow, I am so bad at sequencing comments
if/when 2700 goes, 2712-14 is an area of overlapped fibo’s that probably generates resistance if not a short term turn back down.
I wait for these kinds of points in time, where the EW clarity is high and the backing technical analysis is strongly supportive. And I go a lot larger than normal.
RUT is running again today as well (chart shows daily, hourly, 5 minute, 1 minute, clockwise from top right). I really like RUT as a primary day trading vehicle (using IWM options, while I position trade SPX using SPY/SPX options). If you look at 1, 5, and hourly bars, you can see that RUT (being 2000 stocks deep) is extremely “smooth” (trendy) at low time frames compared to the other smaller depth averages. I just use my trend indicators at the 1 and 5 minute level and it works surprisingly well. It’s about as simple as “get in when the 1 minute goes strong up” and “get out when the 1 minute turns down” (down = orange or red). You can add on filters from there but…that simple works!
Once again we are seeing the value of the Zweig Breadth Thrust which gave a bull rally signal in late December / early January. Have a great day all.
Rodney, good stuff! I enjoyed learning more about this. The Ciovacco weekly was a terrific resource, thx. I will incorporate the ZBT into my scan.
Wow ….. amazing charting.
Why, thank you very much Peter.
Yes Lara
And thank you for the quick transition to a new count the past two days …
It was very helpful in adjusting positions
This is a fabulous forum…. with everyone involved … it really gives a lot of data points and perspectives to work with
I agree with regards to the forum. It takes the participation of everyone here to make it work. So thanks for your posts.