
Another small range day remains tightly constrained between support and resistance.
A developing pattern suggests the direction for a breakout. Targets may be calculated using an Elliott wave count, Fibonacci ratios and classic analysis.
Summary: A small pennant pattern may be unfolding, which may also be an Elliott wave triangle. The target for more upwards movement is now at 2,809 (Elliott wave) or 2,881 (classic analysis).
At about one of these targets a large pullback for a second wave at primary degree may begin.
The bigger picture still expects that a low may now be in place. The target is at 3,045 with a limit at 3,477.39.
New updates to this analysis are in bold.
The biggest picture, Grand Super Cycle analysis, is here.
The monthly chart was last published here.
ELLIOTT WAVE COUNT
WEEKLY CHART
Click chart to enlarge.
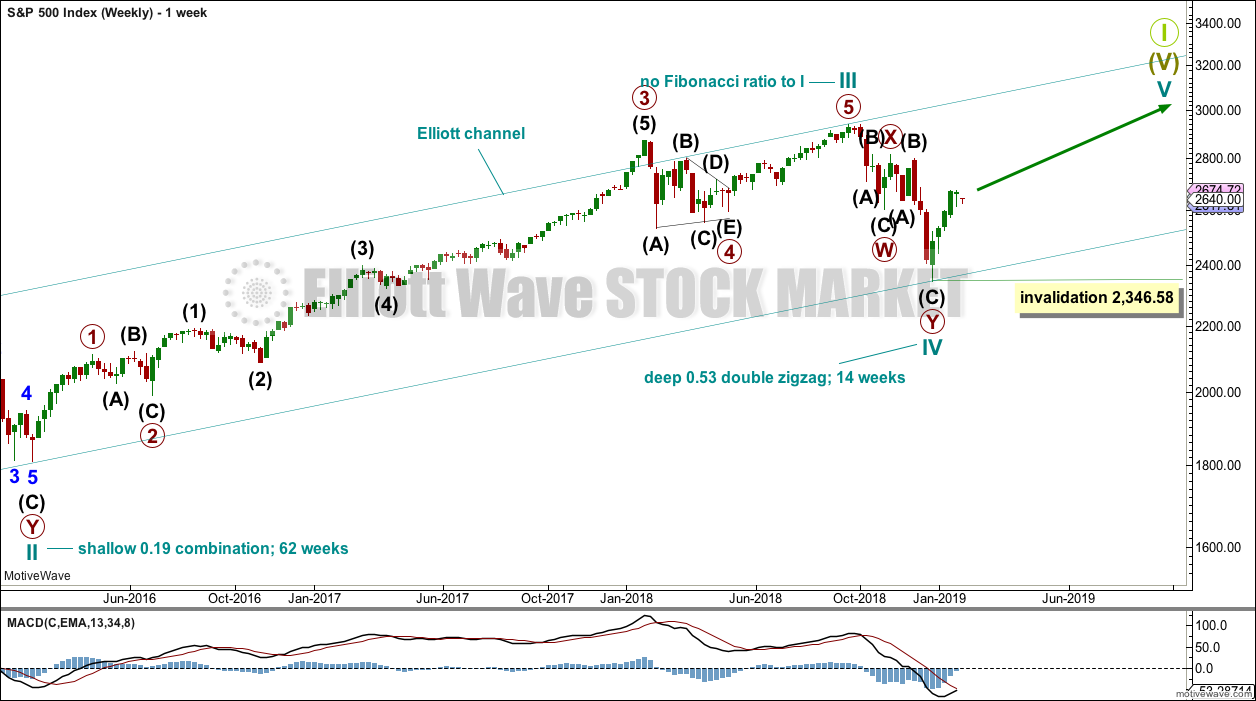
This weekly chart shows all of cycle waves III, IV and V so far.
Cycle wave II fits as a time consuming double combination: flat – X – zigzag. Combinations tend to be more time consuming corrective structures than zigzags. Cycle wave IV has completed as a multiple zigzag that should be expected to be more brief than cycle wave II.
Cycle wave IV may have ended at the lower edge of the Elliott channel.
Within cycle wave V, no second wave correction may move beyond the start of its first wave below 2,346.58.
Although both cycle waves II and IV are labelled W-X-Y, they are different corrective structures. There are two broad groups of Elliott wave corrective structures: the zigzag family, which are sharp corrections, and all the rest, which are sideways corrections. Multiple zigzags belong to the zigzag family and combinations belong to the sideways family. There is perfect alternation between the possible double zigzag of cycle wave IV and the combination of cycle wave II.
Although there is gross disproportion between the duration of cycle waves II and IV, the size of cycle wave IV in terms of price makes these two corrections look like they should be labelled at the same degree. Proportion is a function of either or both of price and time.
Draw the Elliott channel about Super Cycle wave (V) with the first trend line from the end of cycle wave I (at 2,079.46 on the week beginning 30th November 2014) to the high of cycle wave III, then place a parallel copy on the low of cycle wave II. Cycle wave V may find resistance about the upper edge.
DAILY CHART
Click chart to enlarge.
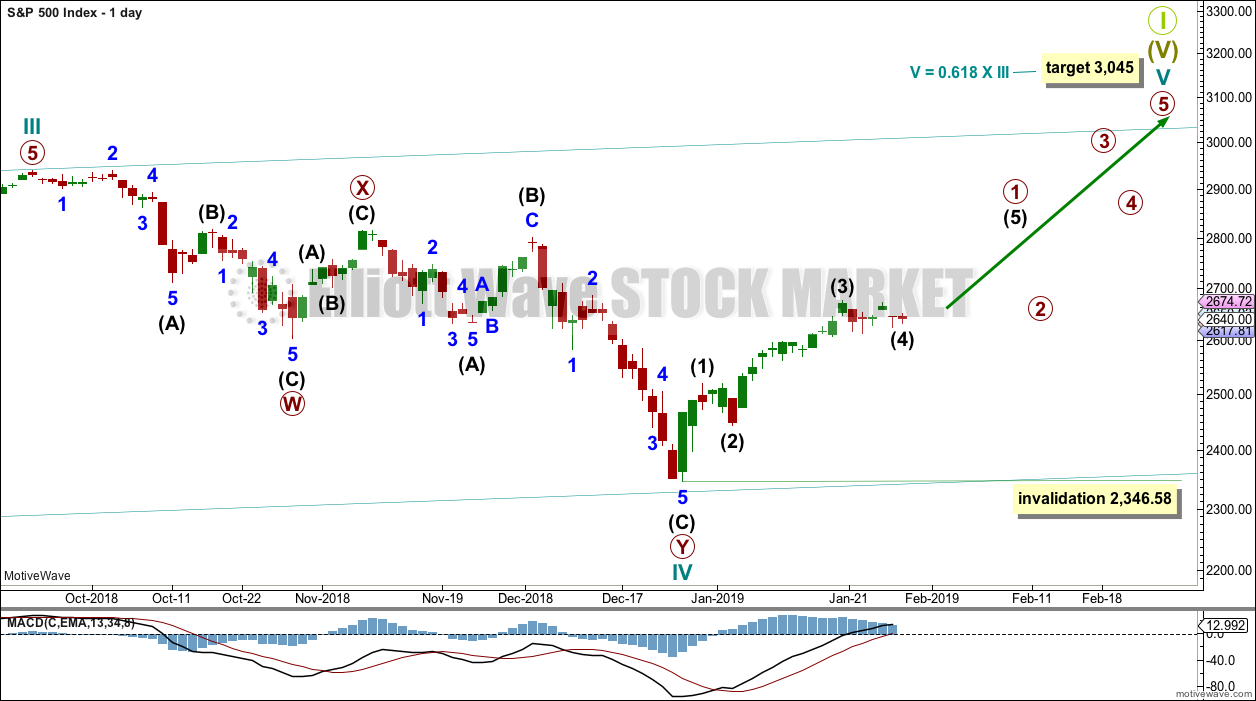
The daily chart will focus on the structure of cycle waves IV and V.
Cycle wave IV now looks like a complete double zigzag. This provides perfect alternation with the combination of cycle wave II. Double zigzags are fairly common corrective structures.
Within Super Cycle wave (V), cycle wave III may not be the shortest actionary wave. Because cycle wave III is shorter than cycle wave I, this limits cycle wave V to no longer than equality in length with cycle wave III at 3,477.39. A target is calculated for cycle wave V to end prior to this point.
Cycle wave V must subdivide as a five wave motive structure, either an impulse or an ending diagonal. An impulse is much more common and that will be how it is labelled. A diagonal would be considered if overlapping suggests it.
Within the five wave structure for cycle wave V, primary wave 1 may be incomplete. Today the degree of labelling within cycle wave V is moved up one degree and the unfolding impulse now labelled primary wave 1 is relabelled. A small fourth wave triangle may be completing, which is labelled now intermediate wave (4).
Within cycle wave V, no second wave correction may move beyond the start of its first wave below 2,346.58.
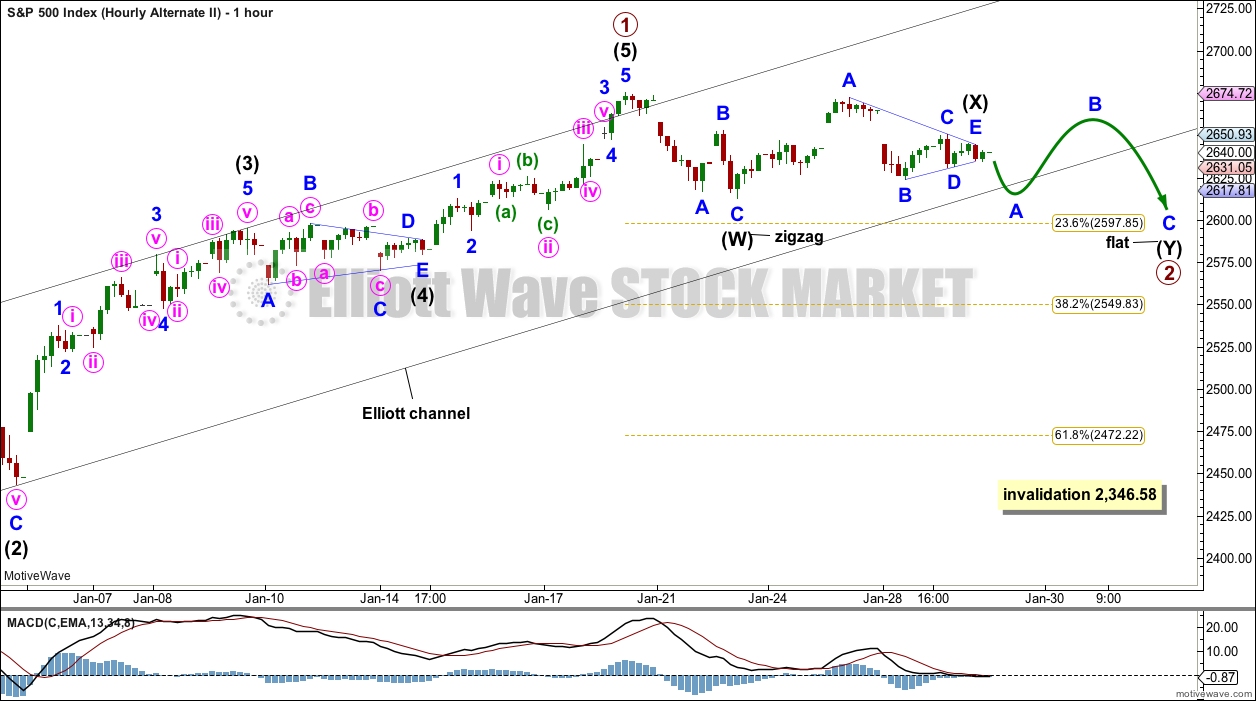
MAIN HOURLY CHART
Click chart to enlarge.
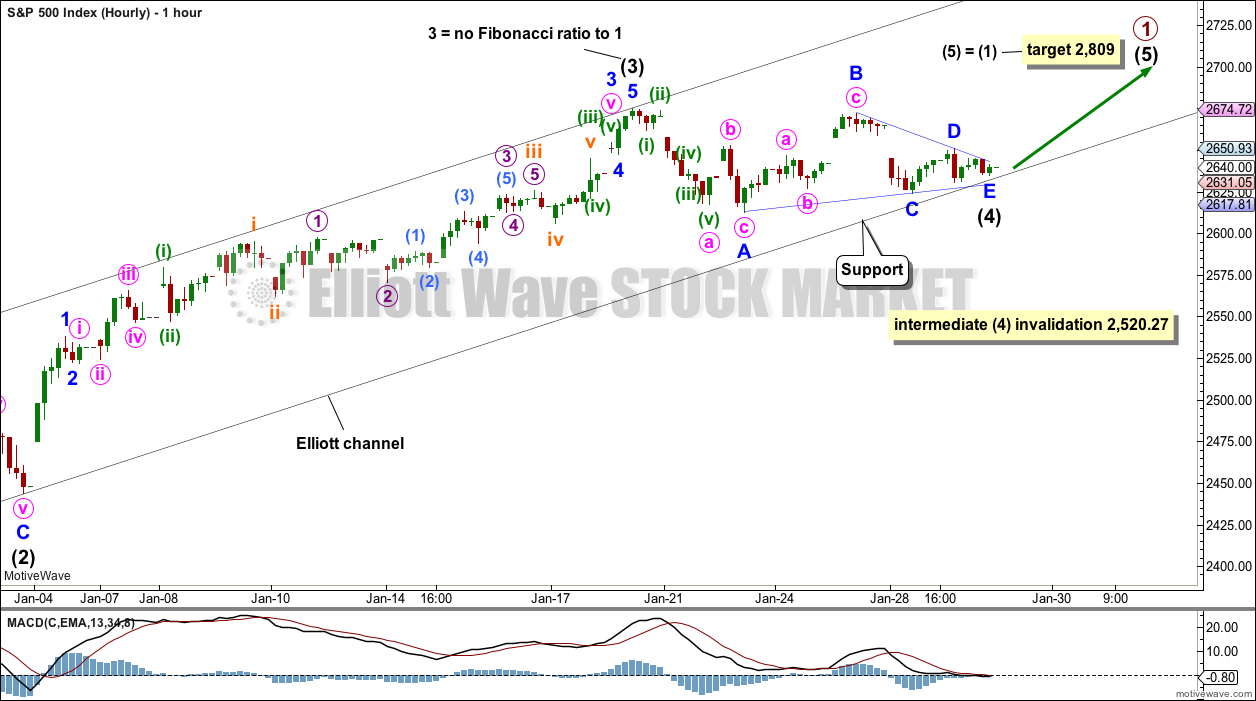
This was an alternate wave count. Sideways movement of the last six sessions and developing underlying strength now suggest it may be more likely.
The triangle is labelled intermediate wave (4). It may be either a regular contracting triangle or regular barrier triangle; a regular contracting triangle is more common.
Within a contracting triangle, minor wave C may not move beyond the end of minor wave A below 2,612.86.
Within a barrier triangle, minor wave C may not move beyond the end of minor wave A below 2,612.86.
Within a contracting triangle, minor wave D may not move beyond the end of minor wave B above 2,672.38.
Within a barrier triangle, minor wave D should end about the same level as minor wave B at 2,672.38, so that the B-D trend line looks essentially flat. In practice minor wave D may end slightly above 2,672.38 and this wave count would remain valid. This rule is subjective.
This wave count may see intermediate wave (4) end within the black Elliott channel.
FIRST ALTERNATE HOURLY CHART
Click chart to enlarge.
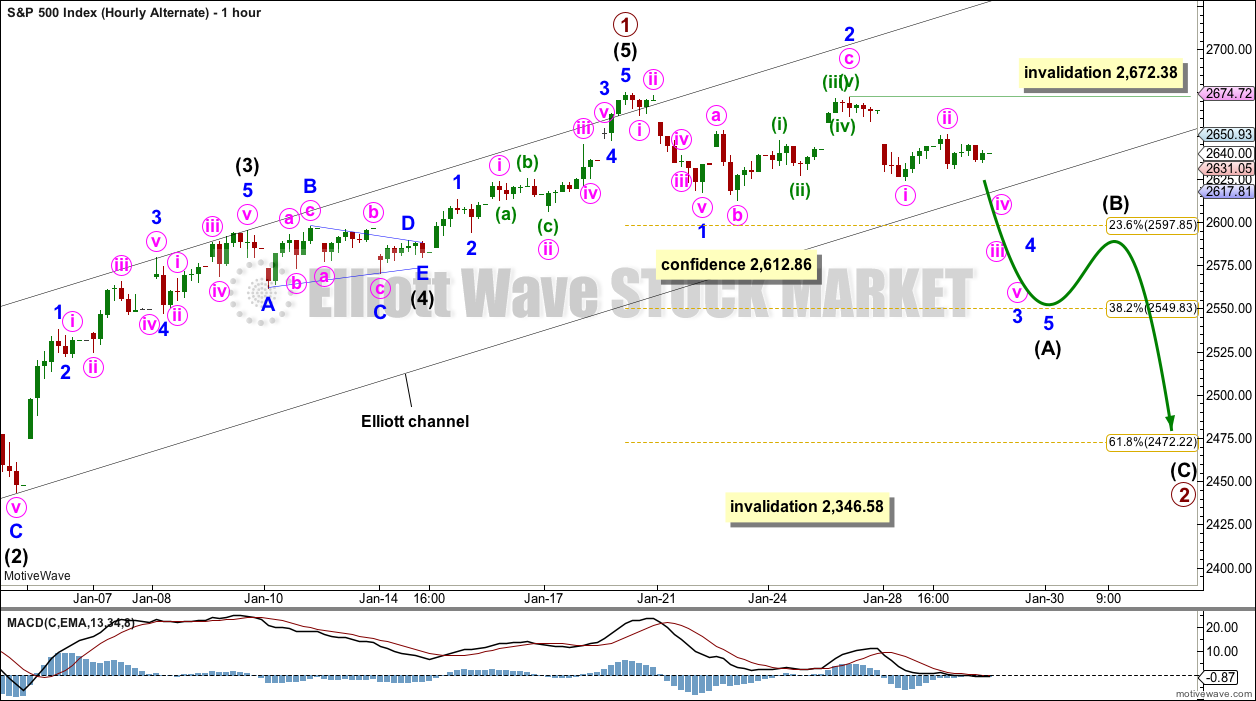
Primary wave 1 may be a complete impulse.
There is perfect alternation between a shallow 0.42 zigzag for intermediate wave (2) and a much more shallow 0.10 triangle for intermediate wave (4). intermediate wave (2) lasted 27 hours and intermediate wave (4) lasted 25 hours; their proportion is close to perfect in terms of time.
This wave count agrees with MACD. The strongest momentum is within intermediate wave (3). Intermediate wave (5) shows slightly weaker momentum.
This alternate hourly chart considers a zigzag for primary wave 2. Intermediate wave (A) within a zigzag must subdivide as a five wave structure; intermediate wave (A) may be an incomplete impulse. Within intermediate wave (A), minor waves 1 and 2 may be complete. Minor wave 3 should now exhibit an increase in downwards momentum.
Minor wave 3 may only subdivide as an impulse. Within minor wave 3, minute wave ii may not move beyond the start of minute wave i above 2,672.38.
The most common structure for a second wave correction is a zigzag.
SECOND ALTERNATE HOURLY CHART
Click chart to enlarge.
This wave count considers a combination for primary wave 2.
If primary wave 2 is unfolding as a combination, then the first structure within a double may be a complete zigzag labelled intermediate wave (W).
The double may be joined by a complete corrective structure in the opposite direction; intermediate wave (X) may be a complete triangle.
Intermediate wave (Y) must unfold as a flat correction. Within intermediate wave (Y), minor wave B may make a new high above the start of minor wave A.
This wave count expects more sideways movement for about a week before the upwards trend resumes.
TECHNICAL ANALYSIS
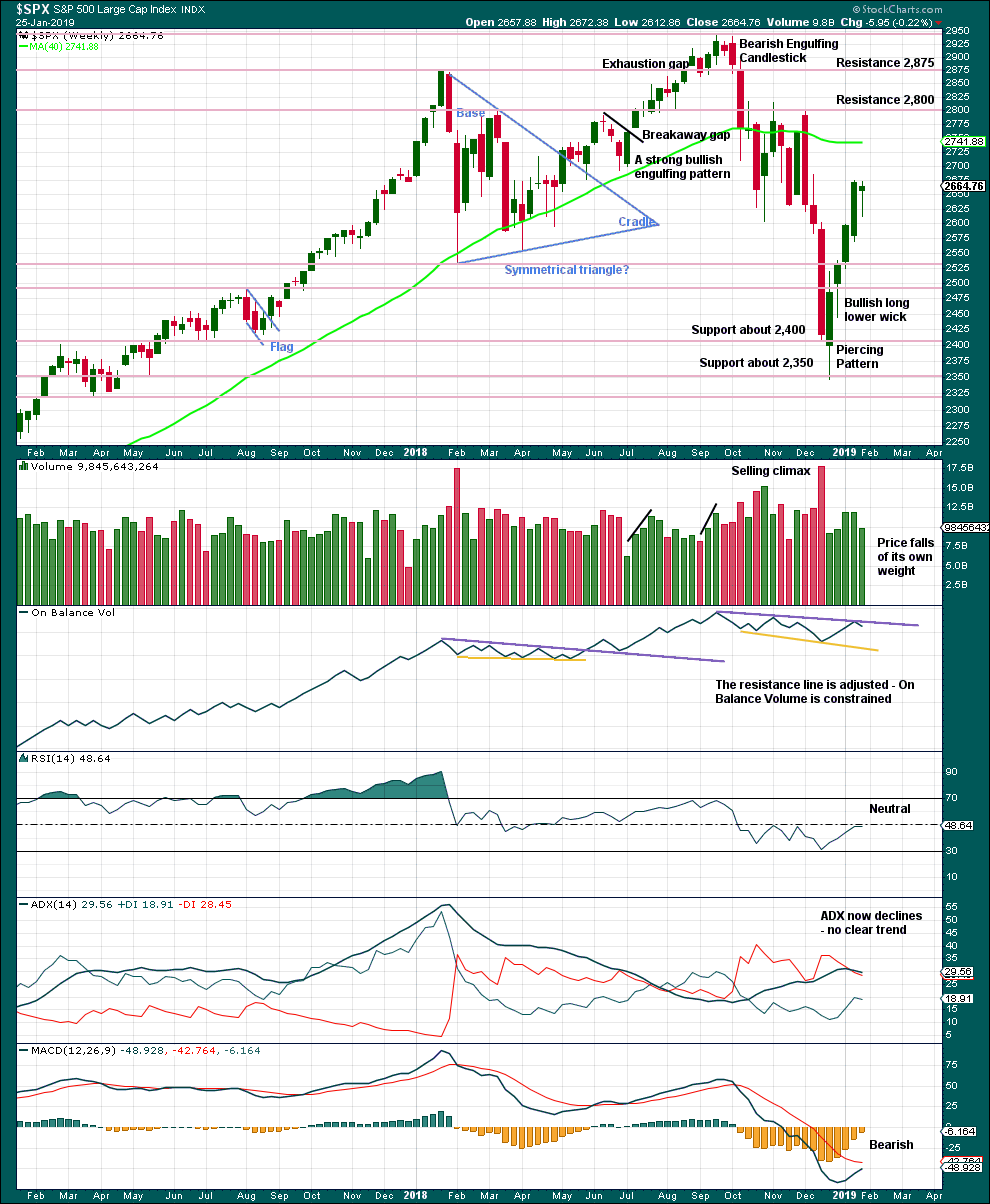
WEEKLY CHART
Click chart to enlarge. Chart courtesy of et=”_blank”>StockCharts.com.
From the all time high to the low at the end of December 2018, price moved lower by 20.2% of market value meeting the definition for a bear market.
It should be noted that the large fall in price from May 2011 to October 2011 also met this definition of a bear market, yet it was only a very large pullback within a bull market, which so far has lasted almost 10 years.
The last weekly candlestick may complete a Hanging Man, which is a bearish reversal pattern, but the bullish implications of the long lower wick on a Hanging Man requires bearish confirmation. A Hanging Man reversal pattern is essentially a two candlestick pattern.
DAILY CHART
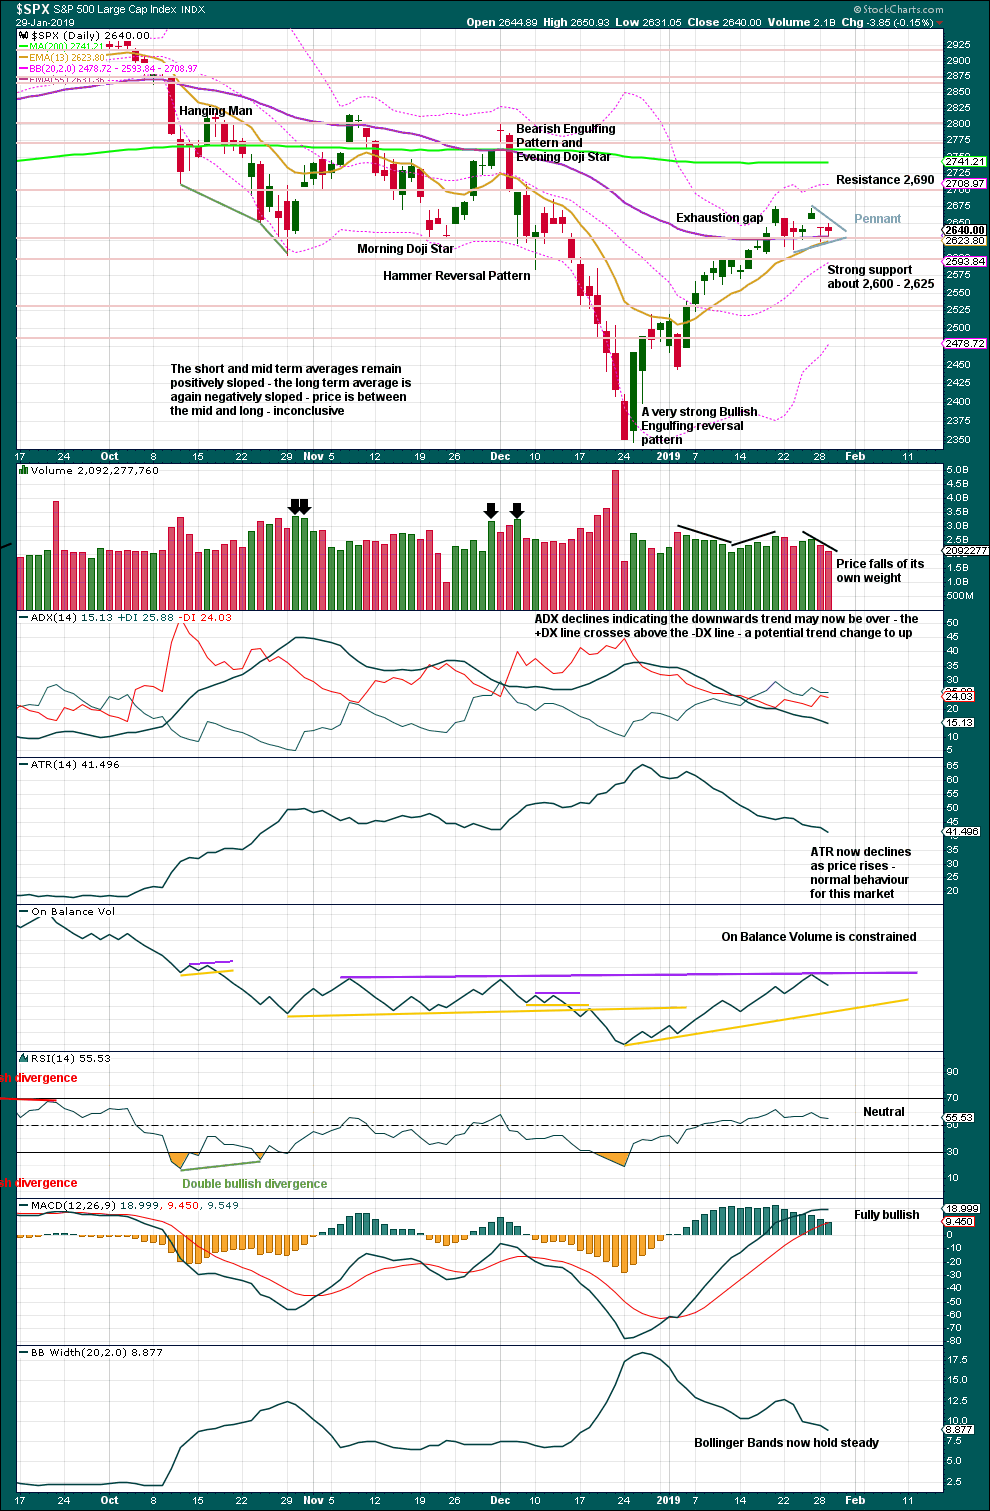
Click chart to enlarge. Chart courtesy of StockCharts.com.
Over a fairly long period of time this ageing bull market has been characterised by upwards movement on light and declining volume and low ATR. For the short to mid term, little concern may be had if price now rises again on declining volume. Current market conditions have allowed for this during a sustained rise in price.
It is also normal for this market to have lower ATR during bullish phases, and strongly increasing ATR during bearish phases. Currently, declining ATR is normal and not of a concern.
Considering the larger picture from the Elliott wave count, some weakness approaching the end of Grand Super Cycle wave I is to be expected.
From Kirkpatrick and Dhalquist, “Technical Analysis” page 152:
“A 90% downside day occurs when on a particular day, the percentage of downside volume exceeds the total of upside and downside volume by 90% and the percentage of downside points exceeds the total of gained points and lost points by 90%. A 90% upside day occurs when both the upside volume and points gained are 90% of their respective totals”…
and “A major reversal is singled when an NPDD is followed by a 90% upside day or two 80% upside days back-to-back”.
The current situation saw two 80% downside days on December 20th and 21st, then a near 90% downside day with 88.97% downside on December 24th. This very heavy selling pressure on three sessions together may be sufficient to exhibit the pressure observed in a 90% downside day.
This has now been followed by two 90% upside days: on December 26th and again on 4th January.
The current situation looks very much like a major low has been found.
Sideways movement of the last six sessions now looks like it may be a small pennant pattern unfolding. The best pennants and flags complete within 15 sessions. A target using the flag pole beginning on the 3rd of January is calculated at 2,881.
The purple resistance line for On Balance Volume is adjusted to now sit on the last apex.
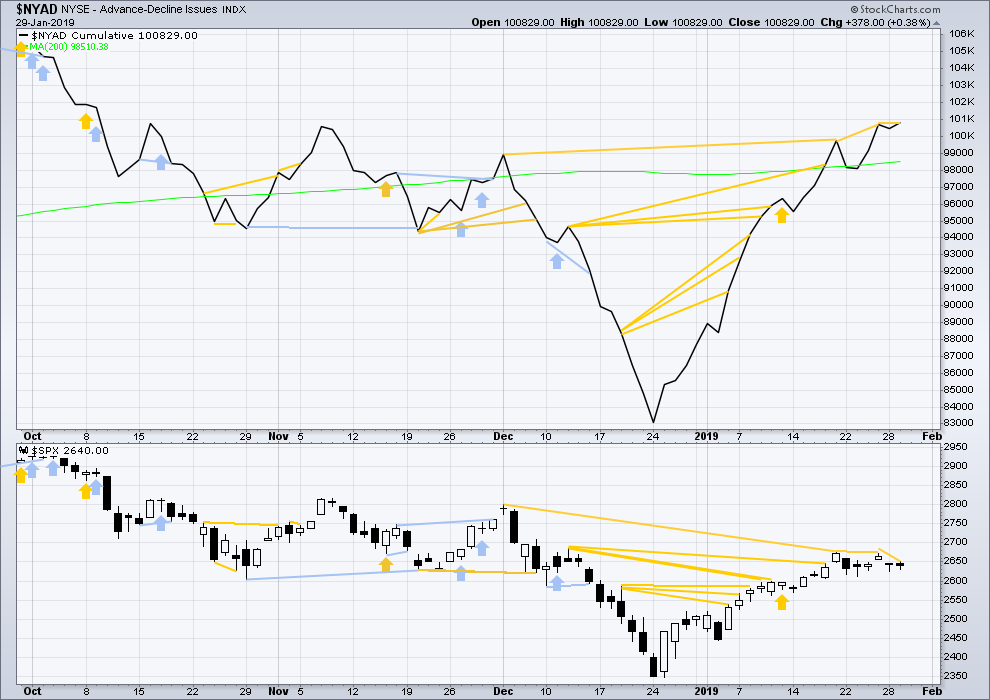
BREADTH – AD LINE
WEEKLY CHART
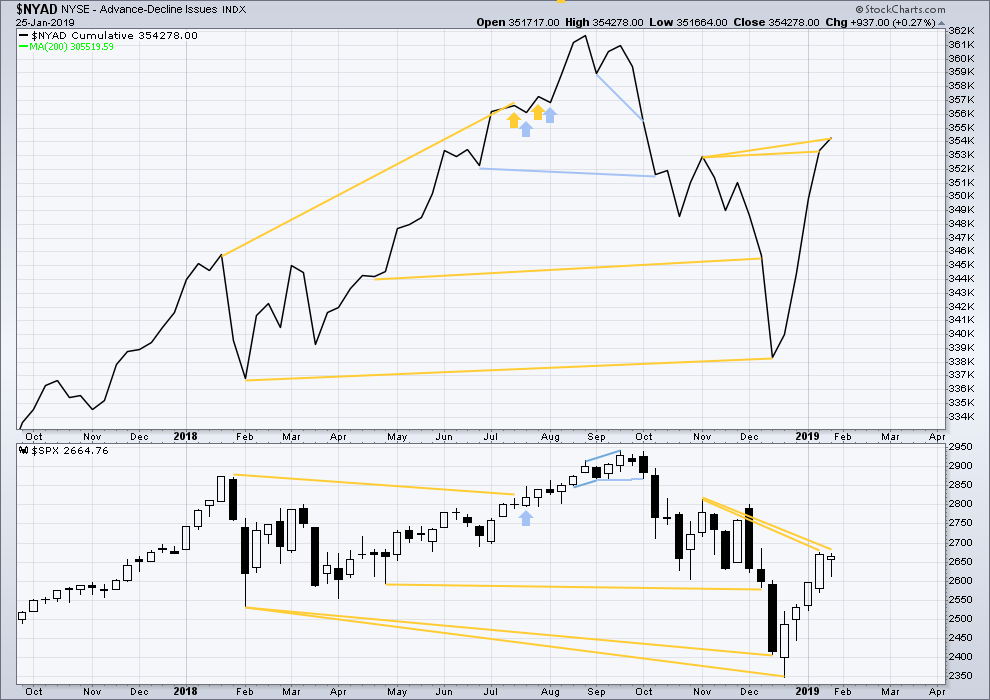
Click chart to enlarge. Chart courtesy of StockCharts.com. So that colour blind members are included, bearish signals
will be noted with blue and bullish signals with yellow.
The AD line has made another new high above the prior swing high of the week beginning 5th of November 2018, but price has not. This divergence is bullish for the mid term.
DAILY CHART
Click chart to enlarge. Chart courtesy of StockCharts.com. So that colour blind members are included, bearish signals
will be noted with blue and bullish signals with yellow.
Breadth should be read as a leading indicator.
There is now a cluster of bullish signals from the AD line. This supports the main Elliott wave count.
Today the AD line has made a new high above the prior high two sessions ago, but price has not. This divergence is bullish for the short term and supports the new main hourly wave count.
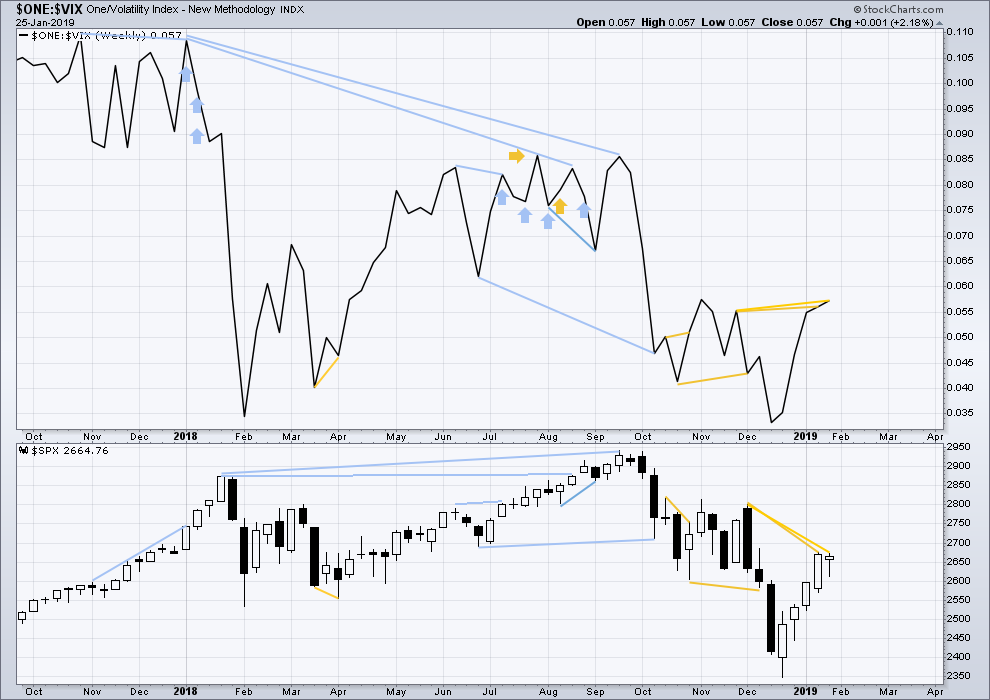
VOLATILITY – INVERTED VIX CHART
WEEKLY CHART
Click chart to enlarge. Chart courtesy of StockCharts.com. So that colour blind members are included, bearish signals
will be noted with blue and bullish signals with yellow.
Inverted VIX has made another new high above the prior swing high of the weeks beginning 26th of November and 3rd of December 2018, but price has not. This divergence is bullish for the mid term.
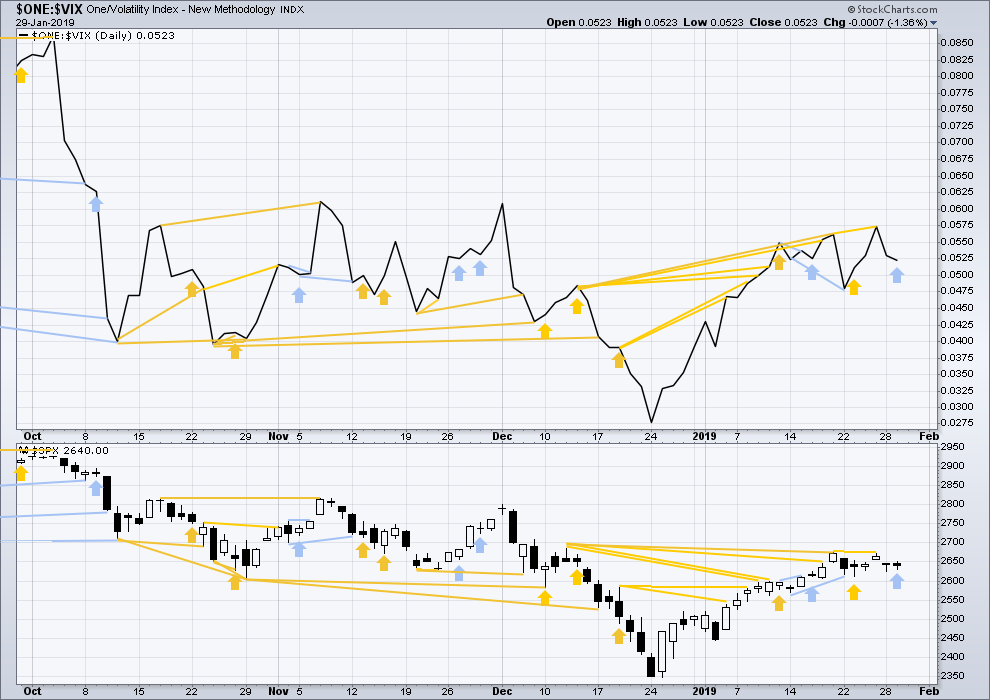
DAILY CHART
Click chart to enlarge. Chart courtesy of StockCharts.com. So that colour blind members are included, bearish signals
will be noted with blue and bullish signals with yellow.
There is now a cluster of bullish signals from inverted VIX. This supports the main Elliott wave count.
Today price moved higher, but the balance of volume was downwards and the candlestick closed red. Inverted VIX moved lower. There is bearish divergence today, but it is considered weak and will not be given weight in this analysis.
DOW THEORY
Dow Theory confirms a bear market. This does not necessarily mean a bear market at Grand Super Cycle degree though; Dow Theory makes no comment on Elliott wave counts. On the 25th of August 2015 Dow Theory also confirmed a bear market. The Elliott wave count sees that as part of cycle wave II. After Dow Theory confirmation of a bear market in August 2015, price went on to make new all time highs and the bull market continued.
DJIA: 23,344.52 – a close on the 19th of December at 23,284.97 confirms a bear market.
DJT: 9,806.79 – price has closed below this point on the 13th of December.
S&P500: 2,532.69 – a close on the 19th of December at 2,506.96 provides support to a bear market conclusion.
Nasdaq: 6,630.67 – a close on the 19th of December at 6,618.86 provides support to a bear market conclusion.
Published @ 09:25 p.m. EST.
—
Careful risk management protects your trading account(s).
Follow my two Golden Rules:
1. Always trade with stops.
2. Risk only 1-5% of equity on any one trade.
Lara says above: “Sideways movement of the last six sessions now looks like it may be a small pennant pattern unfolding. The best pennants and flags complete within 15 sessions. A target using the flag pole beginning on the 3rd of January is calculated at 2,881.”
A good long entry point might be when price retraces to the top line of the pennant.
Thoughts?
Looks like we started minor 1 of intermediate 5, so maybe minor 2 will retrace to top of the trend line as you’ve drawn…
The market was up early today on BA and Apple earnings, went higher after Fed announcement. FB blew past earnings, so its hard to see tomorrow as a down day when FAANG stocks are going up… and Amazon is next…
Its hard for me to tell where Minor 2 may start, but as Kevin mentioned below it maybe 2712-14 area…
Maybe this was their target du jour
Updated main hourly chart:
This wave count looks right. The target remains the same. The invalidation point is moved up. Now the structure of intermediate (5) needs to complete as a five wave motive structure, most likely an impulse. I’ll only consider the less common ending diagonal of overlapping begins to suggest it.
The first alternate is invalidated.
The second alternate looks wrong. I’ll try and see if primary 2 could be labelled differently, but if this upwards movement has support from volume and shows strength then the idea of primary 2 continuing should be discarded.
Great charting Lara!
It was stunning how many folk, who should have known better, completely missed that triangle. 🙂
That would be me, Verne. See my confession below.
I wish I could blame the extreme cold here in Minneapolis (-27F this morning/-50F wind chill). But I can’t, as the queen and I are nice and cozy inside the castle.
-60 W/C in Chicago!
Thanks Verne!
Hey Verne
It would appear you are a seasoned volatility trader
I noticed something with the VXX maturation yesterday
The vxx etn that matures basically consisted of the 2 front month vix futures contracts
Gradually selling the front month to the second month
It’s weighting in each would correspond to the % drops invested in each
So as the contracts rolled day by day .. the weighting would increase to the seasons month until it was 100% in that month and it would start the roll again
I was told that vxxb would be the same product
But it behaved vastly different today on its first day standing alone
It sold off today as if it was weighted almost exclusively in the front month February vix futures contract
Wheras if it was weighted and worked like vxx
It would be about 25% February and 75% March
Which would have meant a sell off around 3.5% vs 5% ( basically the fed futures % loss)
So it would appear it is not the same product at all.. but is weaighted much different .. making it a much different product
I am going to be inquiring with Barclays tomorrow morning..
But thought I’d ask you and you seem to be well connected with options traders and understand volatility
So wanted to get your feedback
Thought food maybe. It looks like they’re using this fib. Possible fib extension target overhead to complete this move?
Bored and waiting on 2 o’clock to arrive.
2668-2670 is key for me today. The confluence of the (broader) triangle structure (still suspicious this is a D wave up), and the long term down trend line from the ATH back the in dim times. Breaking up and through that would be hugely bullish for the short term. Then there’s massive resistance at 2700-2720, a high potential area for completion of wave v of this motive wave up off the Dec low.
My best guess; price peaks at 2670 today on the fed announcement, then sells back of today/tomorrow to form an E wave…and maybe Friday/Monday there’s a break to the upside? I dunno…just waiting for the market to show it’s hand here. I’m guessing there’s a ton of money being made if options expire Friday in this general range, so the big will likely keep it right about here overall.
I agree w/ Kevin. Here’s the same chart…
At this point, it’s just about a complete nominal triangle, as the D wave completed, and an E down is forming now (which can be and often is a “shorty”).
I’m flat, waiting to see what the 2pm fireworks brings. My best guess: some crazy oscillations, then strong up and out of this. But I’m going into it flat, because it’s just too darn uncertain IMO.
Okay, out of the triangle (Lara’s structure was right on) and into some degree of v wave up. Where’s it going to end? First possible spot would be a shorty around 2712-14 (two overlapped fibo), then if v = i that projects to just under two more overlapped fibos around 2812-14. I’m long….
I agree too. It sure seems to have the right look at the moment.
But I remind myself of Lara’s frequent comment that just when you’re positive you’re looking at a triangle, it can suddenly morph into something else.
Confession… I ignored Lara’s main wave count, expecting that we’d see larger D&E waves to form. A sweet trade opportunity lost. Lesson learned.
The 20 week MA seems to signal a sell off. Does anyone have a comment…
I’m still a fan of this scenario…
I could see that happening. The pundents will blame the fed meeting but it’s just over bought. I suspect we see pop and drop tomorrow.
It’s had some nice recent containment. From my view, during the last year it has been punctured too many times to be seen as reliable.