
Price has essentially moved sideways for Monday’s session, which is what the Elliott wave count expected.
Summary: The first large correction within cycle wave V may have arrived. It may be labelled either intermediate wave (1) or primary wave 1. Classic technical analysis at this stage favours a shallow sideways consolidation; the target would be about 2,550. But it may also be a sharp pullback; the target would be about 2,472.
The bigger picture still expects that a low may now be in place. The target is at 3,045 with a limit at 3,477.39.
New updates to this analysis are in bold.
The biggest picture, Grand Super Cycle analysis, is here.
The monthly chart was last published here.
ELLIOTT WAVE COUNT
WEEKLY CHART
Click chart to enlarge.
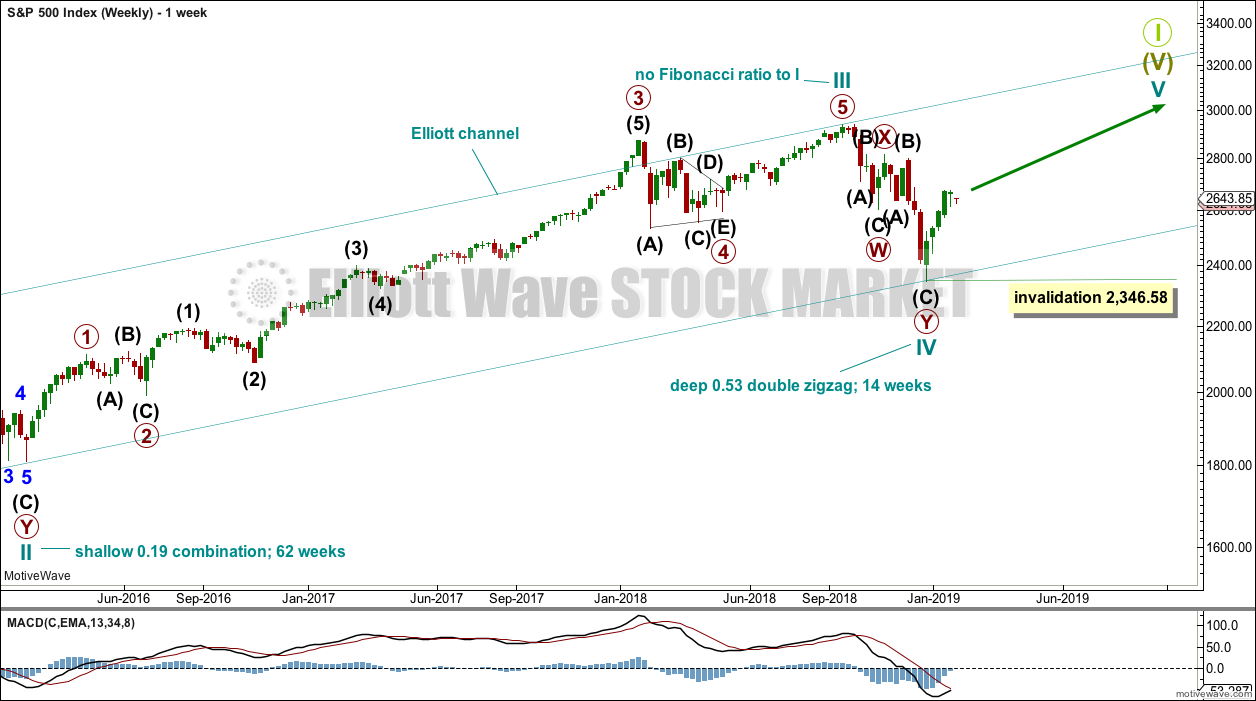
This weekly chart shows all of cycle waves III, IV and V so far.
Cycle wave II fits as a time consuming double combination: flat – X – zigzag. Combinations tend to be more time consuming corrective structures than zigzags. Cycle wave IV has completed as a multiple zigzag that should be expected to be more brief than cycle wave II.
Cycle wave IV may have ended at the lower edge of the Elliott channel.
Within cycle wave V, no second wave correction may move beyond the start of its first wave below 2,346.58.
Although both cycle waves II and IV are labelled W-X-Y, they are different corrective structures. There are two broad groups of Elliott wave corrective structures: the zigzag family, which are sharp corrections, and all the rest, which are sideways corrections. Multiple zigzags belong to the zigzag family and combinations belong to the sideways family. There is perfect alternation between the possible double zigzag of cycle wave IV and the combination of cycle wave II.
Although there is gross disproportion between the duration of cycle waves II and IV, the size of cycle wave IV in terms of price makes these two corrections look like they should be labelled at the same degree. Proportion is a function of either or both of price and time.
Draw the Elliott channel about Super Cycle wave (V) with the first trend line from the end of cycle wave I (at 2,079.46 on the week beginning 30th November 2014) to the high of cycle wave III, then place a parallel copy on the low of cycle wave II. Cycle wave V may find resistance about the upper edge.
DAILY CHART
Click chart to enlarge.
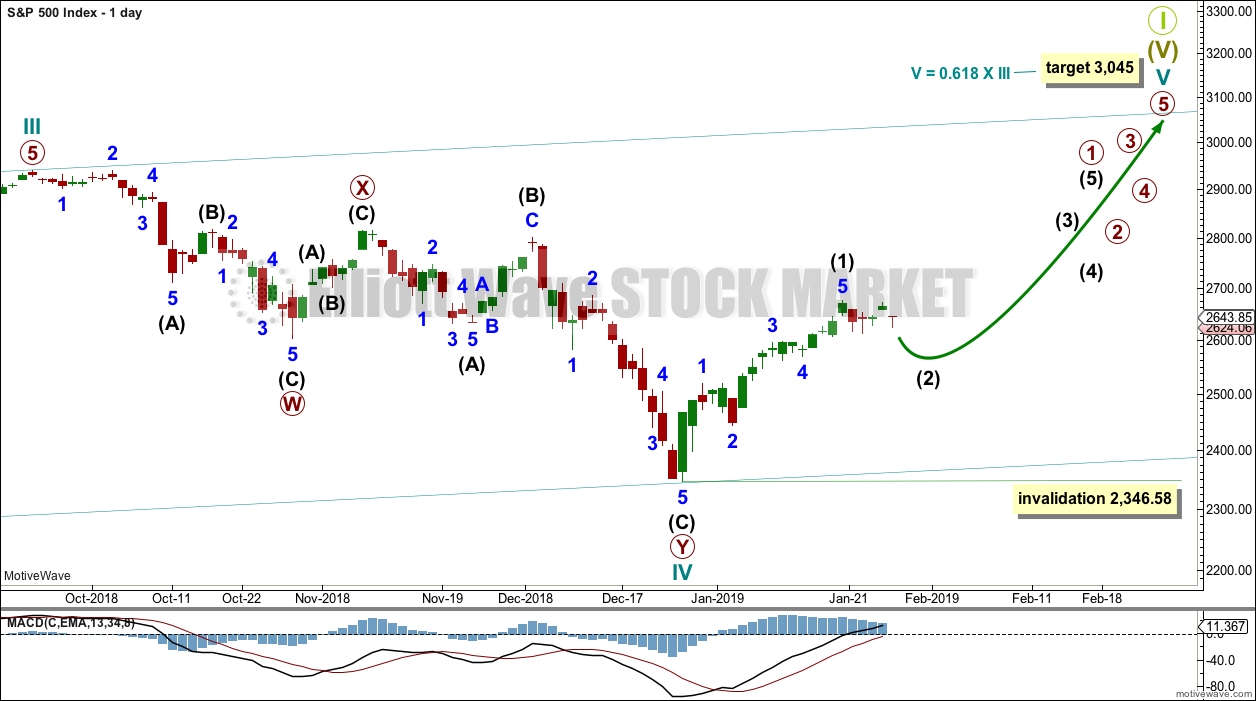
The daily chart will focus on the structure of cycle waves IV and V.
Cycle wave IV now looks like a complete double zigzag. This provides perfect alternation with the combination of cycle wave II. Double zigzags are fairly common corrective structures.
Within Super Cycle wave (V), cycle wave III may not be the shortest actionary wave. Because cycle wave III is shorter than cycle wave I, this limits cycle wave V to no longer than equality in length with cycle wave III at 3,477.39. A target is calculated for cycle wave V to end prior to this point.
Cycle wave V must subdivide as a five wave motive structure, either an impulse or an ending diagonal. An impulse is much more common and that will be how it is labelled. A diagonal would be considered if overlapping suggests it.
Within the five wave structure for cycle wave V, primary wave 1 may be incomplete. Within primary wave 1, intermediate wave (1) may now be complete. The degree of labelling within cycle wave V may need to be adjusted as it unfolds further. At this stage, an adjustment may be to move the degree of labelling within cycle wave V up one degree; it is possible that it could be primary wave 1 now complete.
Within cycle wave V, no second wave correction may move beyond the start of its first wave below 2,346.58.
Intermediate wave (2) now looks like it may unfold as a sideways correction. It may find a low about the 0.382 Fibonacci ratio of intermediate wave (1) at 2,550. It may continue sideways with choppy overlapping movement for another very few weeks.
MAIN HOURLY CHART
Click chart to enlarge.
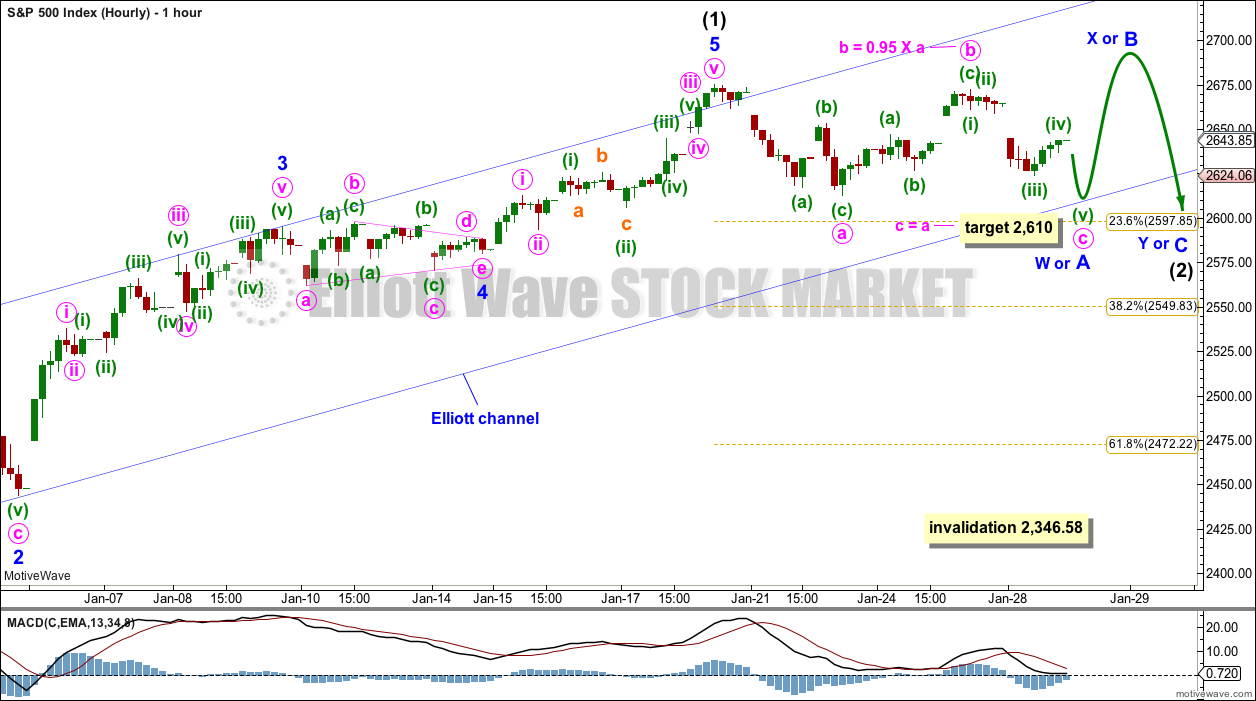
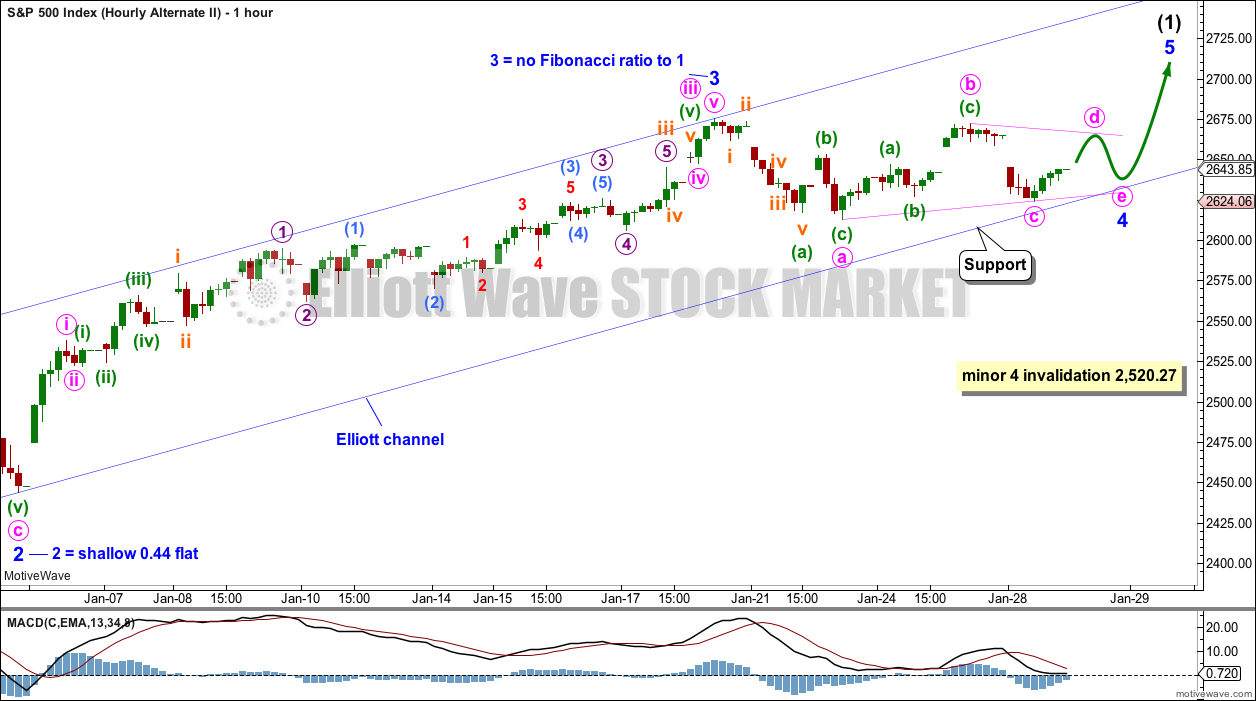
Intermediate wave (1) may be a complete impulse.
There is perfect alternation between a shallow 0.42 zigzag for minor wave 2 and a much more shallow 0.10 triangle for minor wave 4. Minor wave 2 lasted 27 hours and minor wave 4 lasted 25 hours; their proportion is close to perfect in terms of time.
This wave count agrees with MACD. The strongest momentum is within minor wave 3. Minor wave 5 shows slightly weaker momentum.
This wave count considers a flat correction or combination for intermediate wave (2).
If intermediate wave (2) is unfolding as a flat correction, then within it the first wave of minor wave A may itself be unfolding as a regular flat correction. A target is calculated for minute wave c to end. Minute wave c would be extremely likely to make at least a slight new low below the end of minute wave a at 2,612.86 to avoid a truncation.
When minor wave A may be complete, then minor wave B must retrace a minimum 0.9 length of minor wave A, and minor wave B may make a new high above the start of minor wave A at 2,675.47 as in an expanded flat.
If intermediate wave (2) is unfolding as a combination, then the first structure within a double may be an unfolding flat correction labelled minor wave W. When minor wave W may be complete, then minor wave X would most likely be a zigzag and may make a new high above the start of minor wave W at 2,675.47. There would be no minimum requirement for minor wave X. Thereafter, minor wave Y may end about the same level as minor wave W.
Both a flat or combination allows for a new high above 2,675.47 as part of intermediate wave (2). There is no upper invalidation point for this reason. Both of minor waves B or X within a flat or combination should exhibit weakness; if a new high is seen, it should come with weak volume and momentum for this wave count.
FIRST ALTERNATE HOURLY CHART
Click chart to enlarge.
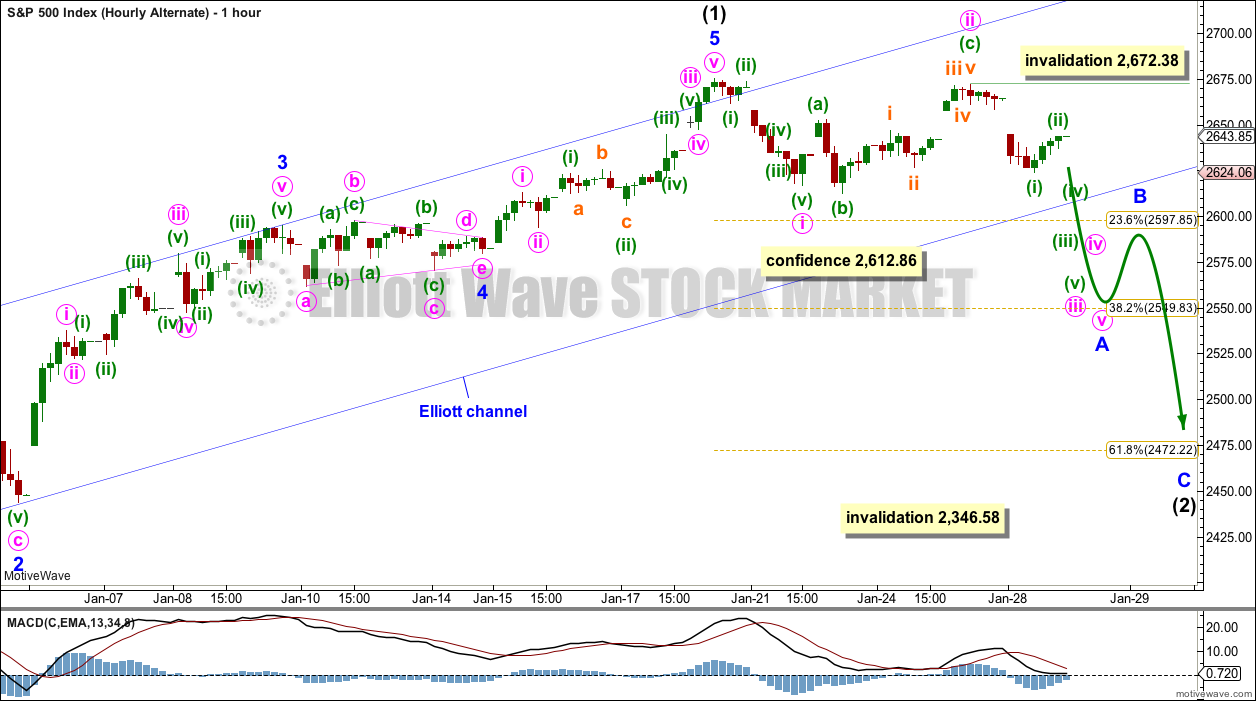
This alternate hourly chart considers a zigzag for intermediate wave (2). Minor wave A within a zigzag must subdivide as a five wave structure; minor wave A may be an incomplete impulse. Within minor wave A, minute waves i and ii may be complete. Minute wave iii should now exhibit an increase in downwards momentum. Today’s downwards movement does show some increase in downwards momentum, offering just a little support to this alternate wave count.
Minute wave iii may only subdivide as an impulse. Within minute wave iii, minuette wave (ii) may not move beyond the start of minuette wave (i) above 2,672.38.
The most common structure for a second wave correction is a zigzag.
SECOND ALTERNATE HOURLY CHART
Click chart to enlarge.
It is possible that minor wave 3 was over at the last high. This wave count ignores what looks like a triangle and on higher time frames minor wave 3 looks like a three wave structure.
This wave count is changed today to consider a continuation of minor wave 4 as a triangle. The triangle may be either a regular contracting triangle or regular barrier triangle; a regular contracting triangle is more common.
Within a contracting triangle, minute wave c may not move beyond the end of minute wave a below 2,612.86.
Within a barrier triangle, minute wave c may not move beyond the end of minute wave a below 2,612.86.
Within a contracting triangle, minute wave d may not move beyond the end of minute wave b above 2,672.38.
Within a barrier triangle, minute wave d should end about the same level as minute wave b at 2,672.38, so that the b-d trend line looks essentially flat. In practice minute wave d may end slightly above 2,672.38 and this wave count would remain valid. This rule is subjective.
This wave count may see minor wave 4 end within the blue Elliott channel.
TECHNICAL ANALYSIS
WEEKLY CHART
Click chart to enlarge. Chart courtesy of et=”_blank”>StockCharts.com.
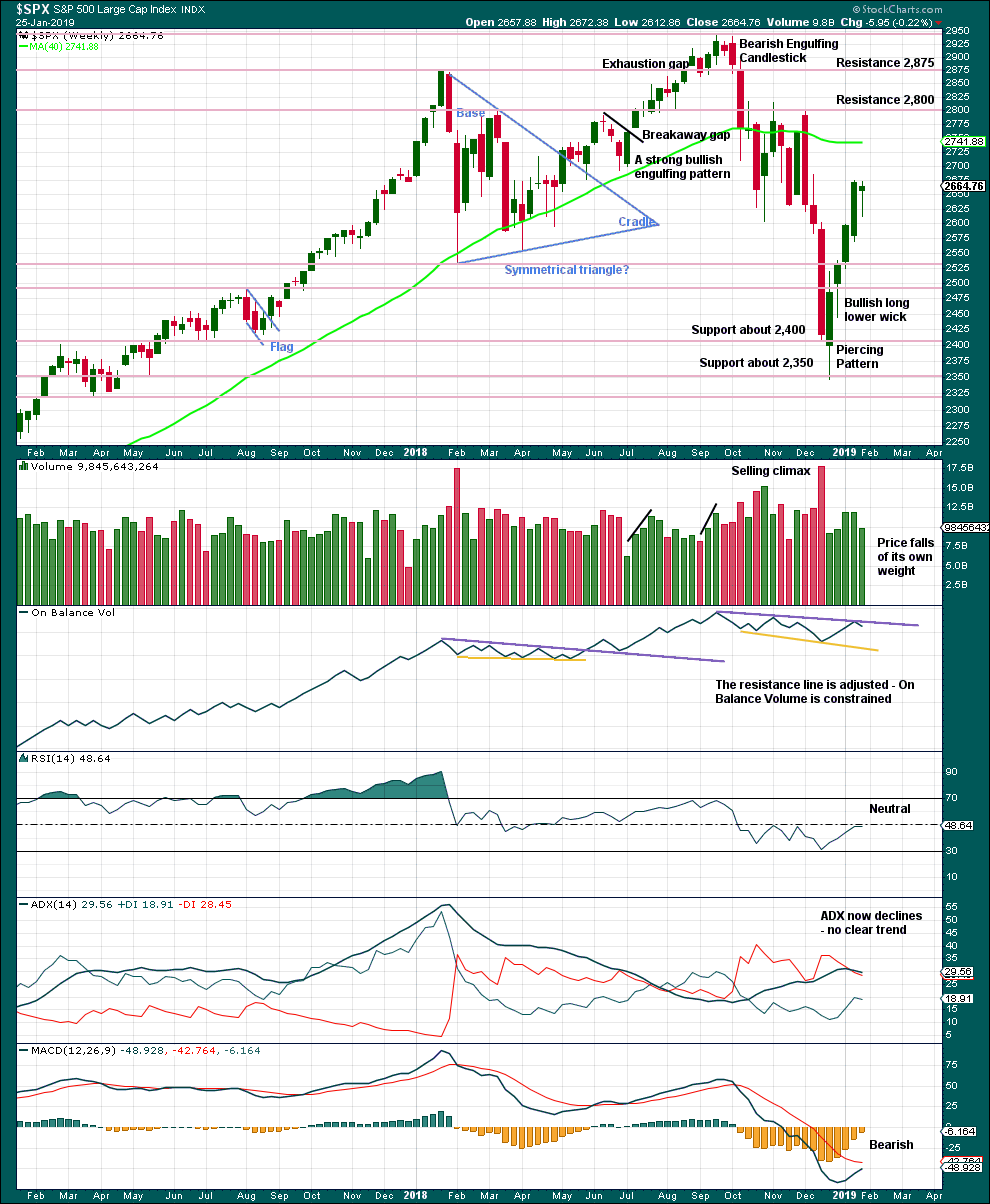
From the all time high to the low at the end of December 2018, price moved lower by 20.2% of market value meeting the definition for a bear market.
It should be noted that the large fall in price from May 2011 to October 2011 also met this definition of a bear market, yet it was only a very large pullback within a bull market, which so far has lasted almost 10 years.
The last weekly candlestick may complete a Hanging Man, which is a bearish reversal pattern, but the bullish implications of the long lower wick on a Hanging Man requires bearish confirmation. A Hanging Man reversal pattern is essentially a two candlestick pattern.
DAILY CHART
Click chart to enlarge. Chart courtesy of StockCharts.com.
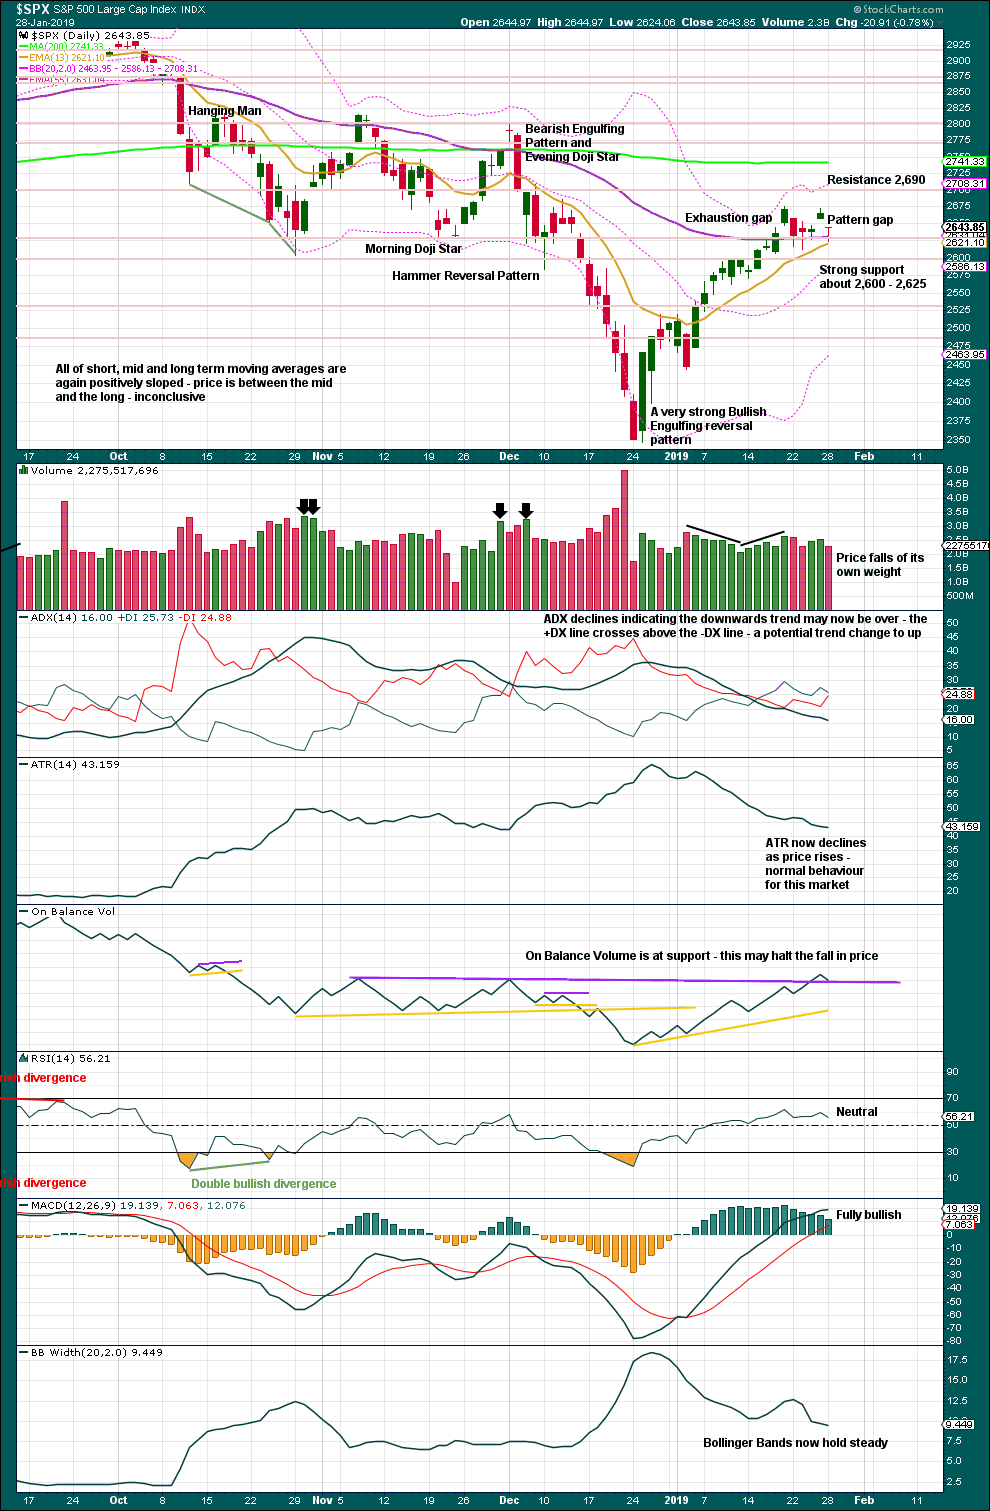
Over a fairly long period of time this ageing bull market has been characterised by upwards movement on light and declining volume and low ATR. For the short to mid term, little concern may be had if price now rises again on declining volume. Current market conditions have allowed for this during a sustained rise in price.
It is also normal for this market to have lower ATR during bullish phases, and strongly increasing ATR during bearish phases. Currently, declining ATR is normal and not of a concern.
Considering the larger picture from the Elliott wave count, some weakness approaching the end of Grand Super Cycle wave I is to be expected.
From Kirkpatrick and Dhalquist, “Technical Analysis” page 152:
“A 90% downside day occurs when on a particular day, the percentage of downside volume exceeds the total of upside and downside volume by 90% and the percentage of downside points exceeds the total of gained points and lost points by 90%. A 90% upside day occurs when both the upside volume and points gained are 90% of their respective totals”…
and “A major reversal is singled when an NPDD is followed by a 90% upside day or two 80% upside days back-to-back”.
The current situation saw two 80% downside days on December 20th and 21st, then a near 90% downside day with 88.97% downside on December 24th. This very heavy selling pressure on three sessions very close together may be sufficient to exhibit the pressure observed in a 90% downside day.
This has now been followed by two 90% upside days: on December 26th and again on 4th January.
The current situation looks very much like a major low has been found.
This session completes a Dragonfly doji, but it may not be read as a bullish reversal signal because this does not come after a downwards movement. The last five sessions look like a consolidation within an ongoing upwards trend, so far.
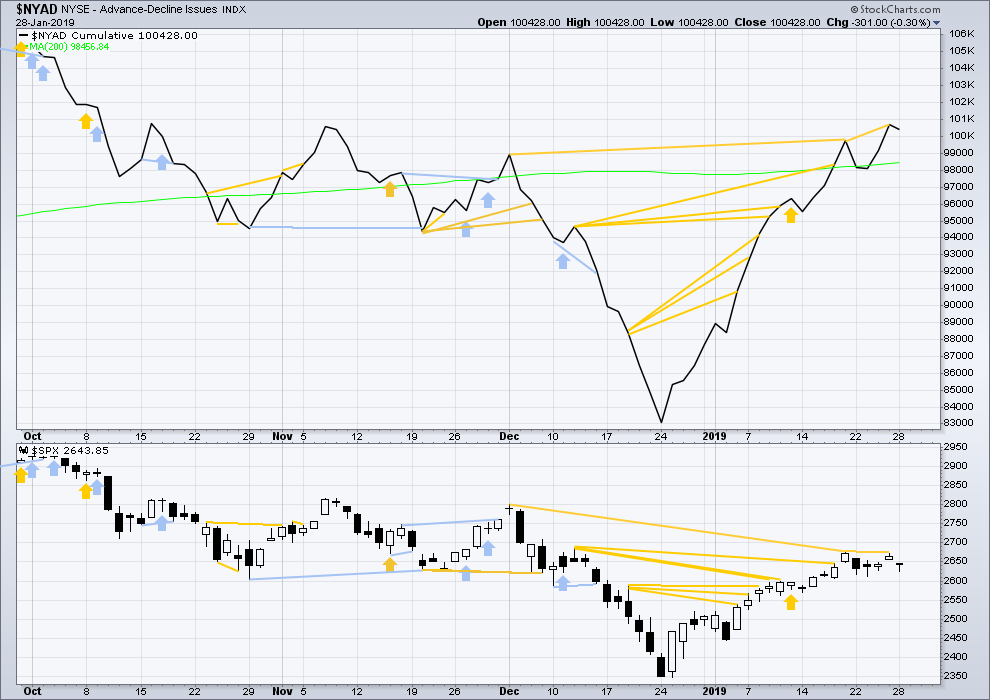
BREADTH – AD LINE
WEEKLY CHART
Click chart to enlarge. Chart courtesy of StockCharts.com. So that colour blind members are included, bearish signals
will be noted with blue and bullish signals with yellow.
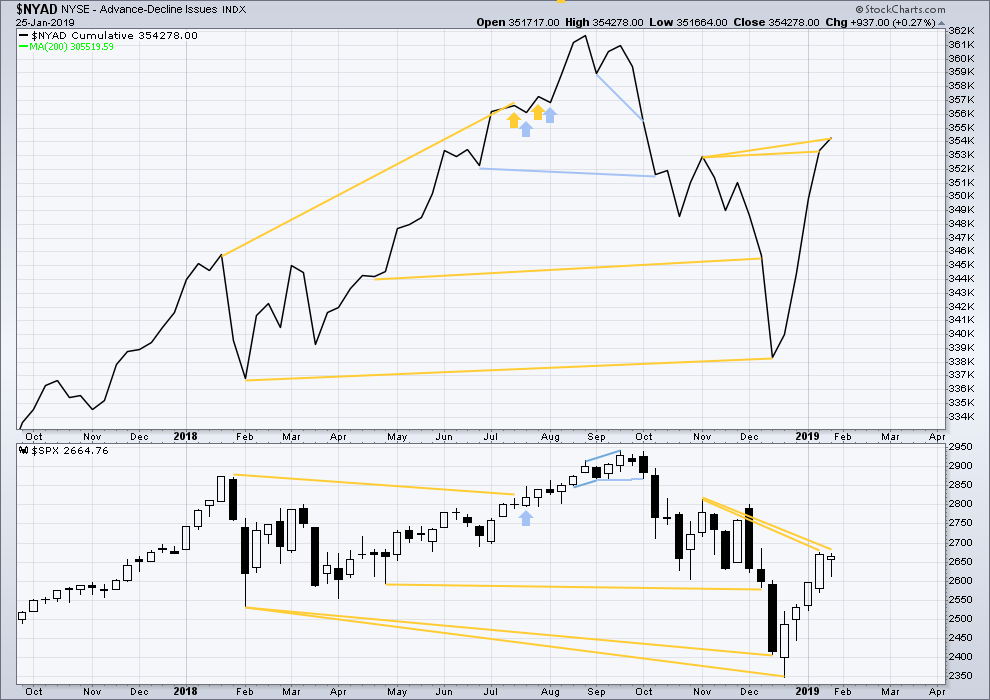
The AD line has made another new high above the prior swing high of the week beginning 5th of November 2018, but price has not. This divergence is bullish for the mid term.
DAILY CHART
Click chart to enlarge. Chart courtesy of StockCharts.com. So that colour blind members are included, bearish signals
will be noted with blue and bullish signals with yellow.
Breadth should be read as a leading indicator.
There is now a cluster of bullish signals from the AD line. This supports the main Elliott wave count.
Bullish divergence at Friday’s session has not been followed by any upwards movement yet. It may have failed, or it may yet be followed by more upwards movement.
Today price moved slightly lower and the AD line slightly declined. There is no new divergence.
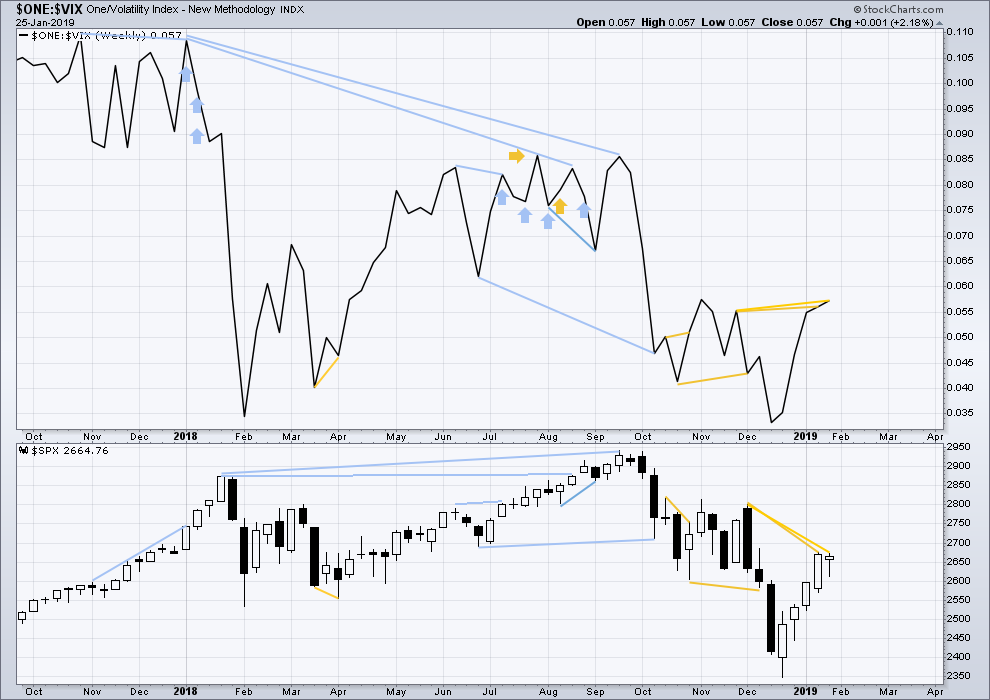
VOLATILITY – INVERTED VIX CHART
WEEKLY CHART
Click chart to enlarge. Chart courtesy of StockCharts.com. So that colour blind members are included, bearish signals
will be noted with blue and bullish signals with yellow.
Inverted VIX has made another new high above the prior swing high of the weeks beginning 26th of November and 3rd of December 2018, but price has not. This divergence is bullish for the mid term.
DAILY CHART
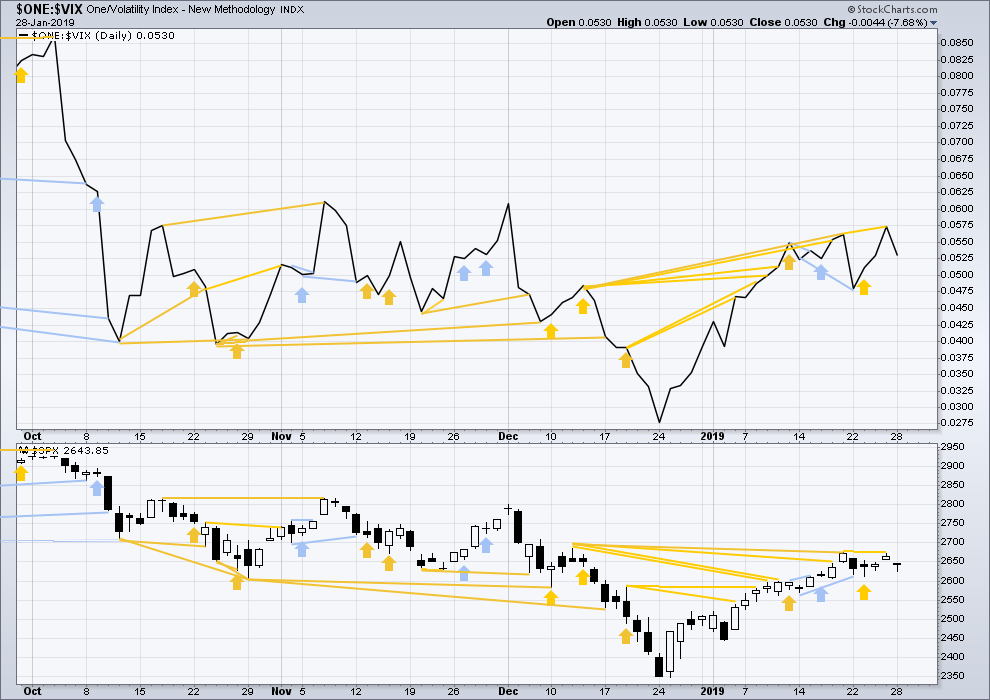
Click chart to enlarge. Chart courtesy of StockCharts.com. So that colour blind members are included, bearish signals
will be noted with blue and bullish signals with yellow.
There is now a cluster of bullish signals from inverted VIX. This supports the main Elliott wave count.
Bullish divergence at Friday’s session has not been followed by any upwards movement yet. It may have failed, or it may yet be followed by more upwards movement.
Today price moved slightly lower and inverted VIX has slightly declined. There is no new divergence.
DOW THEORY
Dow Theory confirms a bear market. This does not necessarily mean a bear market at Grand Super Cycle degree though; Dow Theory makes no comment on Elliott wave counts. On the 25th of August 2015 Dow Theory also confirmed a bear market. The Elliott wave count sees that as part of cycle wave II. After Dow Theory confirmation of a bear market in August 2015, price went on to make new all time highs and the bull market continued.
DJIA: 23,344.52 – a close on the 19th of December at 23,284.97 confirms a bear market.
DJT: 9,806.79 – price has closed below this point on the 13th of December.
S&P500: 2,532.69 – a close on the 19th of December at 2,506.96 provides support to a bear market conclusion.
Nasdaq: 6,630.67 – a close on the 19th of December at 6,618.86 provides support to a bear market conclusion.
Published @ 09:26 p.m. EST.
—
Careful risk management protects your trading account(s).
Follow my two Golden Rules:
1. Always trade with stops.
2. Risk only 1-5% of equity on any one trade.
apple earnings get the D wave of the triangle going? …… just a thought
Updated main hourly wave count:
I’m changing how I’m labelling intermediate (2) here to see an incomplete double combination.
Within the possible combination, the first structure may be a complete zigzag. Wave X may now be a complete triangle. Wave Y would need to be a flat correction. Wave Y may last about a week.
Updated second alternate wave count:
At this time it is looking like a triangle could be complete. Because second waves can’t subdivide as triangles, a triangle here would be a fourth wave.
If the triangle is complete then a target may be calculated for minor wave 5. This does look rather optimistic, the target may be too high.
Yep! 🙂
Hi Verne!
Hiya!
How’s the surf? 🙂
So nothing for a stronger down Lara ?
I’ll still have the first alternate in analysis. I just didn’t put it in an update today.
EEM (which has massive options volume) has broken it’s huuuuge down trend line on the weekly, is tracking to a new uptrend line, and per my trend indicator is now in a weekly uptrend. AND…it’s in week #4 of a squeeze at the weekly tf (red dots on the bottom TTM_Squeeze histogram). “Should” (more likely anyway) blow out to the upside.
thanks…. looks fun
This is my balanced combined ticker for the FAANGM stocks (FB, AAPL, AMZN, NFLX, GOOGL, MSFT). It’s not behaving like the major averages: it showing much more of a rolling over kind of look here (this is a daily chart). Could be a early indicator…
Cool chart, Kevin
Good look Kevin
Vix futures selling again
But s and p at a lower price
So not having the same push higher
With the same vix futures level
7 points different
Another sign
Feds up tomorrow
Risk assets apprehensive
If they stop the balance sheet runoff..(which they kind of already have )
They bounce
If they don’t
Those fang sticks will get hit
So looks like positioning
I like the change to the Second Alternate hourly count which calls for one more high above 2700 to complete Intermediate 1 (or Primary 1). The action from the recent high of 2675 on January 18th fits a triangle perfectly. When Intermediate 2 begins we should be able to see it with some degree of certainty, i.e. a sharp move downwards with large candles relative to those in Intermediate 1. Thanks Lara.
But it may not be a triangle…could be a double top structure.
If that is the case we will have a retrace under 2612
Then the bounce
This would also fit well with vxx maturing today and the massive selling of vix futures that has been going on the past month
Currently the futures are sold to spot vix
This would mean any rise in spot vix will be felt quickly as s and p usually runs or falls with vix futures ..
So a transition to the new vxxb and the ceasing if planned selling of vix futures today
Would allow for a bounce in vix futures as the market falls to 2610 area
Then a chance for the bounce
Either way I think 2610 needs to be visited soon
If not and the market climbs to 2690-2700
That will be an amazing short and I will start layering in
I closed all but 1/4 of my vxxb longs and spy shorts in this last push down
Selling the 266-268 call spreads for tomorrow on any rise above 264.50
And selling 37.50 puts for Friday in vxxb on any move under 38.10
To reload my thinnned out position from Friday
This is a link for the vix and vix futures
It is a helpful tool to observe with tech analysis Ew and other factors
Notice the spot vix to vix futures relationships
And you can tie that in with Lara’s analysis on Inverted VIX and possible pivots
https://www.barchart.com/futures/quotes/VI*0/all-futures
I am a big believer that the market signals what it’s going to do. It signals a trend, then it sets up a retracement so that the trend can be entered and participated in. It’s fractal, as we know, so this is valid market behavior for short/ medium/ and long timeframes.
Lara points out; “From the all-time high to the low of (December), price moved lower by 20.2% of market value meeting the definition for a bear market”.
Also, “It should be noted that the large fall in price from May 2011 to October 2011 also met this definition of a bear market, yet it was only a very large pullback within a bull market, which so far has lasted almost 10 years”.
I wonder, are we in the first stages of a bear market? Are we in a bear market retracement?
I enjoy listening to the Peter Schiff financial podcast. He said something recently that really sticks in my mind. He said; “How likely is it that the longest bull market in history is followed by the shortest bear market in history?”
We all look at the same charts. Everyone says that the low has been made and that we will make new highs this year. When we do make the final bear market low, investor sentiment will unanimously say that “it could still make new lows”.
I have 2 questions for Lara (and everyone). Do the higher targets for Grand Supercycle, the Supercycle, and the Cycle need to be achieved before we can go full-on into a bear market? How likely is it that a bear market could occur without these targets getting hit?
“Bear market” is term applied when some arbitrary percentage of market price correction occurs. The key word is “arbitrary”. As such, there is NO implication that said correction will continue to yet deeper price levels. I’d rephrase Schiff’s statement as “how likely is it that the largest bull market in history gets hit with a 20% correction, and yet is still not finished?”. Well, I’d say given it’s the biggest bull market in history, and approaching it’s end, that’s not overly surprising volatility before it’s final highs. “Massive churn at the top.” A frothy market during it’s final bull market days strikes me as nominal, not surprising.
As for whether the GSC wave 1 top might be in, I do believe some EW analysts have models for that. Certainly not impossible. Whatever the market does, there’s going to be some EW model that explains it is my view. EW isn’t deterministic or “predictive”. High quality analysis can give us traders a probabilistic edge. Nothing more. I like C.C.’s frequent refrain: “we don’t forecast; we are data driven” or something to that effect.
Your statement about “everyone” thinking there will be new ATH’s this year is not accurate; many many pundits think there’s more and deeper down coming first.
Doesn’t really answer your questions but my $0.02 nonetheless.
“How likely is it that a bear market could occur without these targets getting hit?”
Extremely unlikely.
In Lowry’s over 90 year history, every single bear market has been preceded by declining market breadth and increasing selling pressure.
At the last all time high in September 2019 there was no decline in market breadth nor increase in selling pressure.
And so any expectation that the bear market began at that high (or that the last ATH was the end of the bull market) is expecting something that has not happened in nearly 100 years. I do not like those odds, which is why I will not publish a wave count which sees a bear market now underway.
Awesome. I love it. No Wishy Washy hedging of your answer!
I find that sitting on fences is remarkably uncomfortable 🙂 So I rarely do it.