
A small inside day fits both Elliott wave counts.
Summary: The first large pullback within cycle wave V may have arrived. It may be labelled either intermediate wave (1) or primary wave 1. The target is at 2,472, which may be met in three or five weeks. It is also possible that it could be a shallow sideways consolidation.
The bigger picture still expects that a low may now be in place. Further confidence in this view may be had now that price has made new high above 2,631.09. The target is at 3,045 with a limit at 3,477.39. The Elliott wave count has support classic technical analysis.
New updates to this analysis are in bold.
The biggest picture, Grand Super Cycle analysis, is here.
The monthly chart was last published here.
ELLIOTT WAVE COUNT
WEEKLY CHART
Click chart to enlarge.
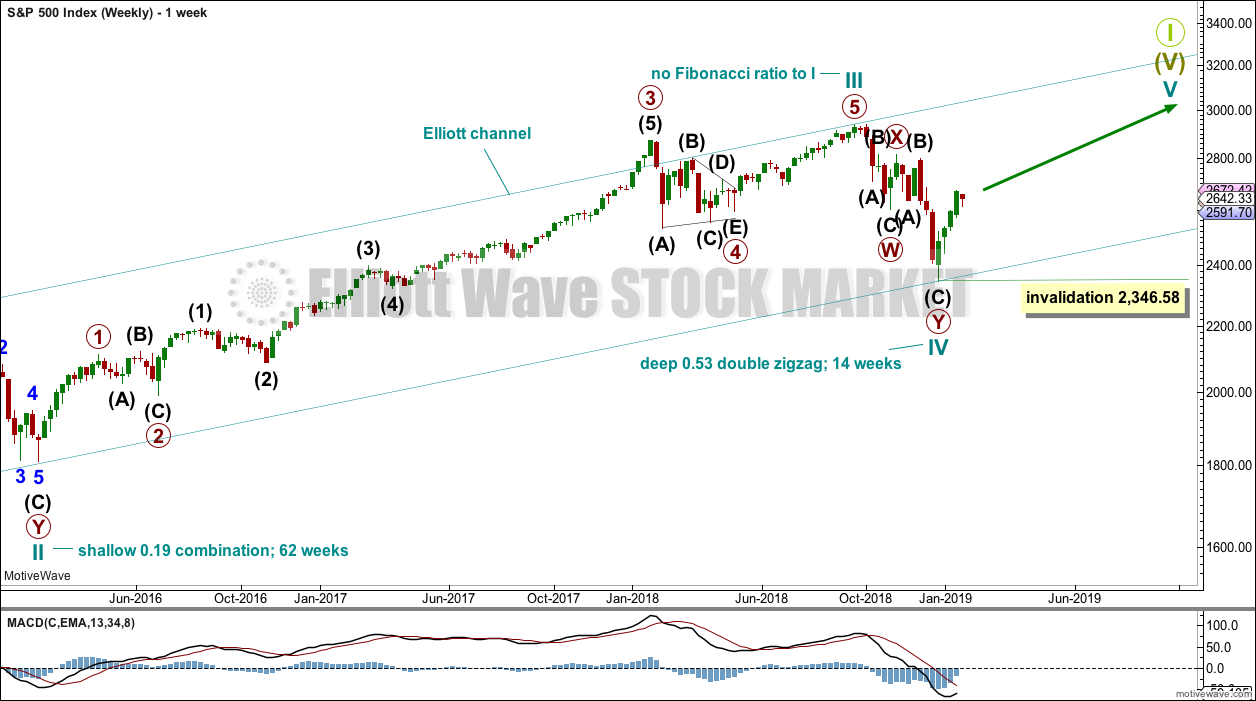
This weekly chart shows all of cycle waves III, IV and V so far.
Cycle wave II fits as a time consuming double combination: flat – X – zigzag. Combinations tend to be more time consuming corrective structures than zigzags. Cycle wave IV has completed as a multiple zigzag that should be expected to be more brief than cycle wave II.
Cycle wave IV may have ended at the lower edge of the Elliott channel.
Within cycle wave V, no second wave correction may move beyond the start of its first wave below 2,346.58.
Although both cycle waves II and IV are labelled W-X-Y, they are different corrective structures. There are two broad groups of Elliott wave corrective structures: the zigzag family, which are sharp corrections, and all the rest, which are sideways corrections. Multiple zigzags belong to the zigzag family and combinations belong to the sideways family. There is perfect alternation between the possible double zigzag of cycle wave IV and the combination of cycle wave II.
Although there is gross disproportion between the duration of cycle waves II and IV, the size of cycle wave IV in terms of price makes these two corrections look like they should be labelled at the same degree. Proportion is a function of either or both of price and time.
Draw the Elliott channel about Super Cycle wave (V) with the first trend line from the end of cycle wave I (at 2,079.46 on the week beginning 30th November 2014) to the high of cycle wave III, then place a parallel copy on the low of cycle wave II. Cycle wave V may find resistance about the upper edge.
DAILY CHART
Click chart to enlarge.
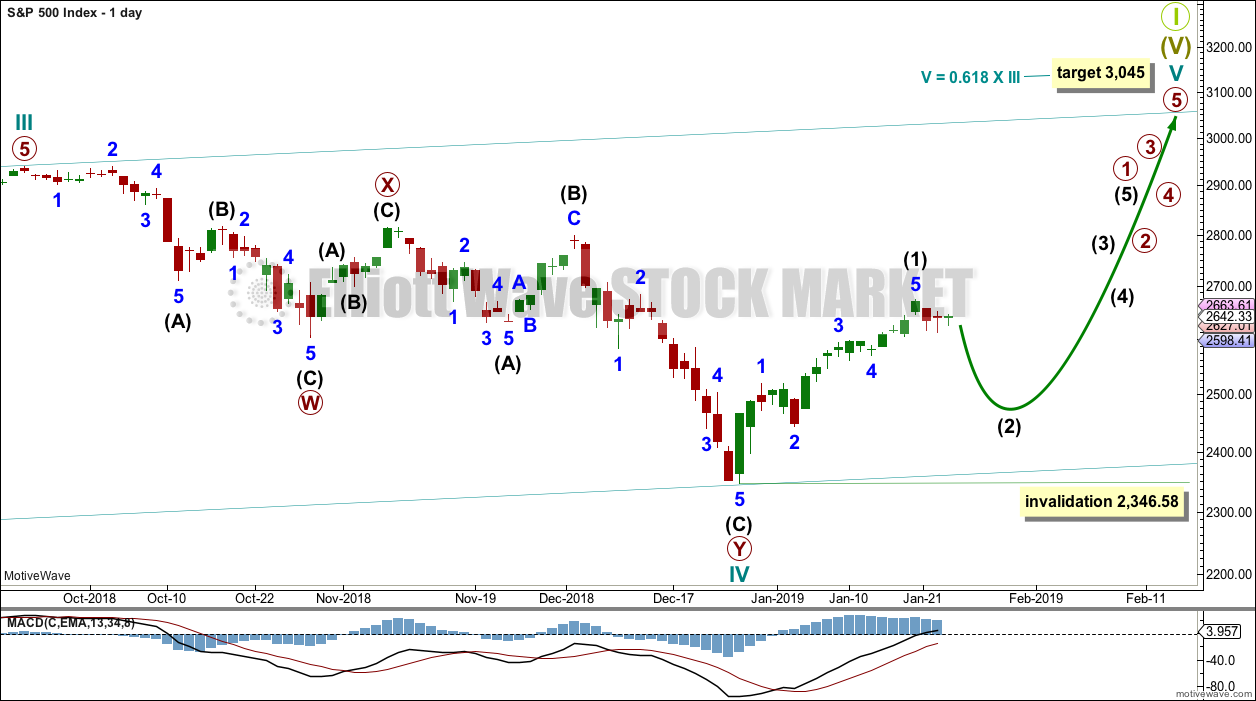
The daily chart will focus on the structure of cycle waves IV and V.
Cycle wave IV may be a complete double zigzag. This would provide perfect alternation with the combination of cycle wave II. Double zigzags are fairly common corrective structures.
Within Super Cycle wave (V), cycle wave III may not be the shortest actionary wave. Because cycle wave III is shorter than cycle wave I, this limits cycle wave V to no longer than equality in length with cycle wave III at 3,477.39. A target is calculated for cycle wave V to end prior to this point.
Cycle wave V must subdivide as a five wave motive structure, either an impulse or an ending diagonal. An impulse is much more common and that will be how it is labelled. A diagonal would be considered if overlapping suggests it.
Within the five wave structure for cycle wave V, primary wave 1 would be incomplete. Within primary wave 1, intermediate wave (1) may now be complete. The degree of labelling within cycle wave V may need to be adjusted as it unfolds further. At this stage, an adjustment may be to move the degree of labelling within cycle wave V up one degree; it is possible that it could be primary wave 1 now complete.
Within cycle wave V, no second wave correction may move beyond the start of its first wave below 2,346.58.
Three hourly charts are given below. The main hourly and first alternate hourly charts follow labelling of intermediate wave (1) on the daily chart. The second alternate does not have as good a look.
MAIN HOURLY CHART
Click chart to enlarge.
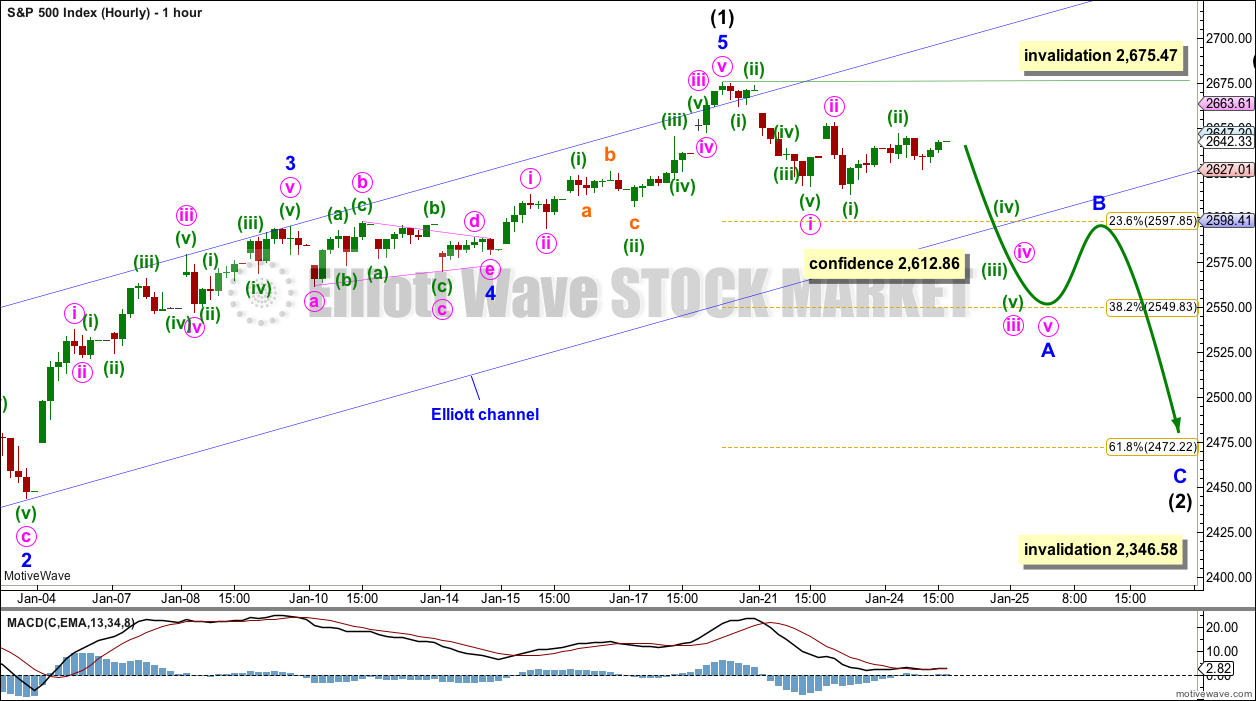
Intermediate wave (1) may be a complete impulse.
There is perfect alternation between a shallow 0.42 zigzag for minor wave 2 and a much more shallow 0.10 triangle for minor wave 4. Minor wave 2 lasted 27 hours and minor wave 4 lasted 25 hours; their proportion is close to perfect in terms of time.
Within this wave count, minor wave 3 is shorter than minor wave 1. There is a close Fibonacci ratio between minor waves 5 and 3.
This wave count agrees with MACD. The strongest momentum is within minor wave 3. Minor wave 5 shows slightly weaker momentum.
This first hourly chart considers a zigzag for intermediate wave (2). Minor wave A within a zigzag must subdivide as a five wave structure; minor wave A may be an incomplete impulse. Within minor wave A, minute waves i and ii may be complete. Within minute wave iii, minuette waves (i) and (ii) may be complete. This wave count would now expect to see an increase in downwards momentum.
The most common structure for a second wave correction is a zigzag.
FIRST ALTERNATE HOURLY CHART
Click chart to enlarge.
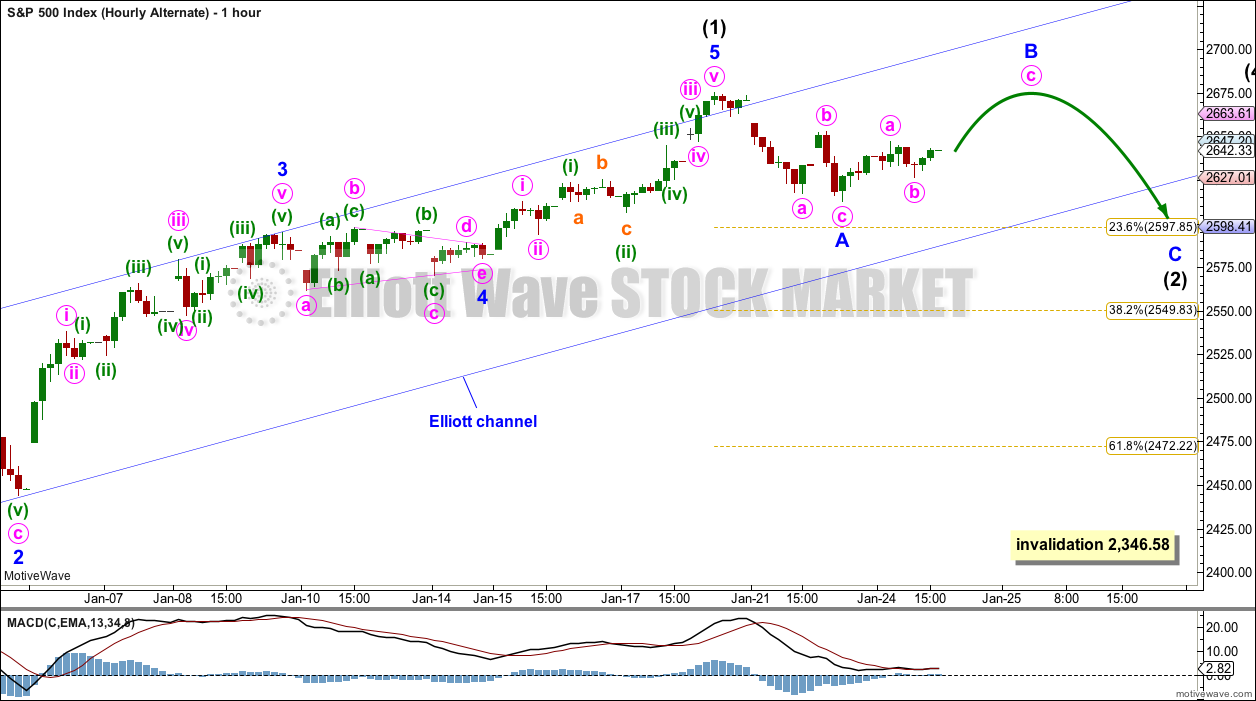
This alternate wave count considers a flat correction for intermediate wave (2). A combination may subdivide in the same way for the first part.
Flat corrections subdivide 3-3-5. Minor wave A may be a complete zigzag. Minor wave B would need to retrace a minimum 0.9 length of minor wave A at 2,669.09. The most common length for minor wave B within a flat correction would be from 1 to 1.38 times the length of minor wave A at 2,675.47 to 2,699.26.
A new high above 2,675.47 is allowable for this wave count, and so a new high does not mean intermediate wave (2) should be over.
A flat correction (or a combination) is possible for intermediate wave (2), but not as common as a zigzag.
SECOND ALTERNATE HOURLY CHART
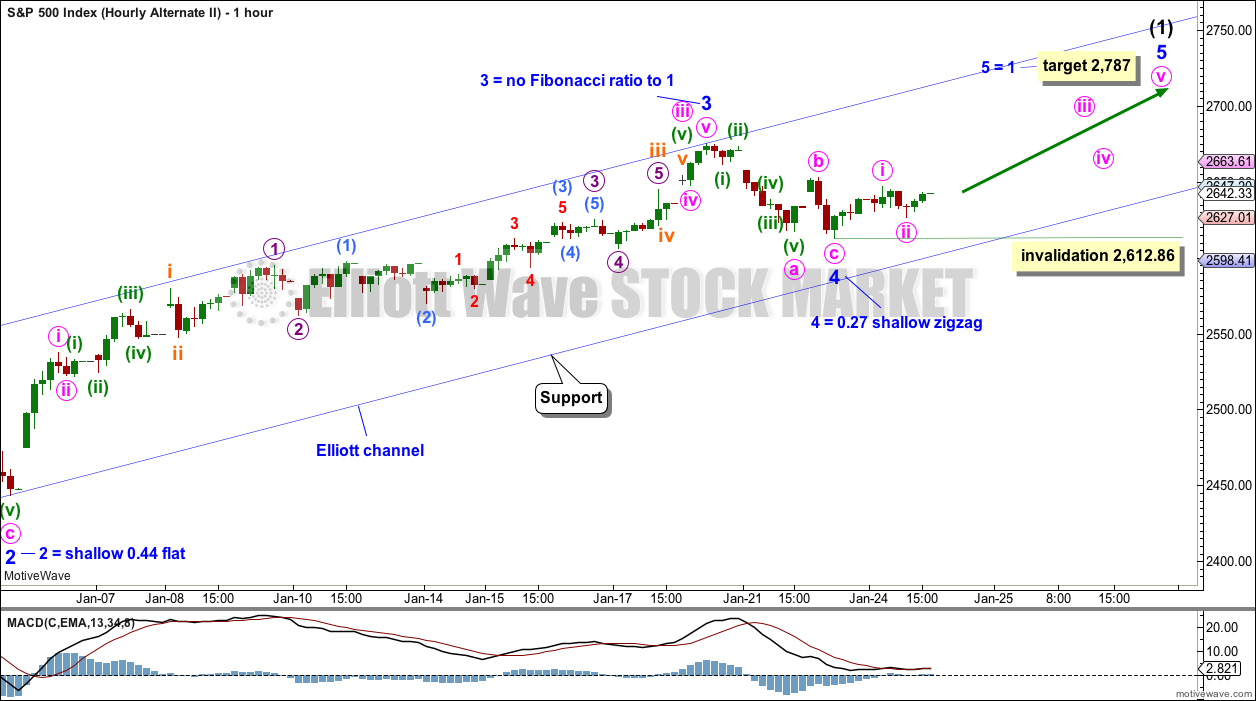
Click chart to enlarge.
It is possible that minor wave 3 was over at the last high. This wave count ignores what looks like a triangle and on higher time frames minor wave 3 looks like a three wave structure.
Minor wave 4 may have ended as a quick shallow zigzag. There is perfect alternation between minor waves 2 and 4.
Within minor wave 5, minute wave ii may not move beyond the start of minute wave i below 2,612.86.
The target expects minor wave 5 to exhibit the most common Fibonacci ratio to minor wave 1.
TECHNICAL ANALYSIS
WEEKLY CHART
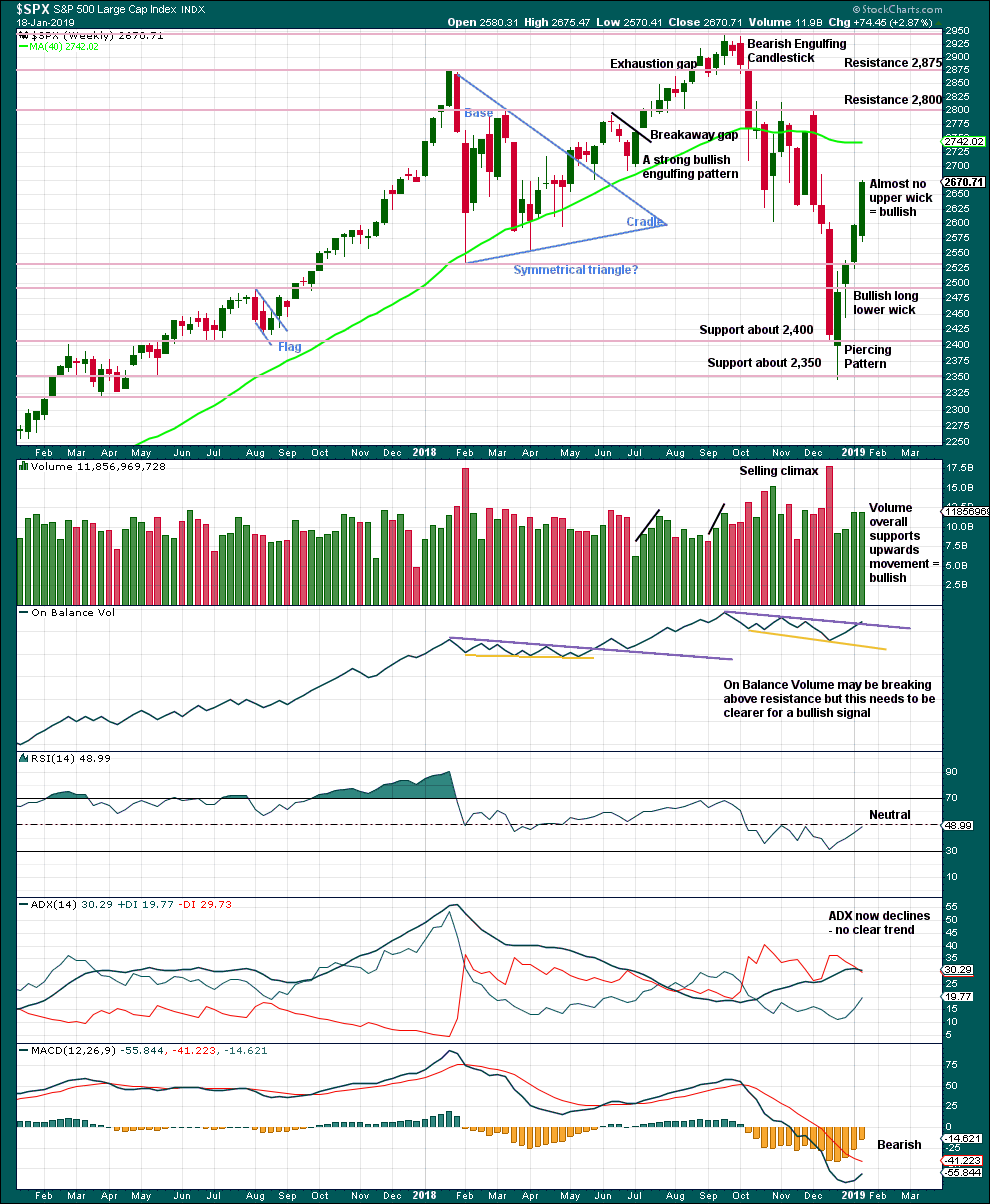
Click chart to enlarge. Chart courtesy of et=”_blank”>StockCharts.com.
From the all time high to the low of last week, price moved lower by 20.2% of market value meeting the definition for a bear market.
It should be noted that the large fall in price from May 2011 to October 2011 also met this definition of a bear market, yet it was only a very large pullback within a bull market, which so far has lasted almost 10 years.
Again, last weekly candlestick has almost no upper wick. With price closing almost at the high for the week, it looks reasonable to expect more upwards movement this week.
Last week volume has very slightly declined from the prior week. The decline is so slight, this will not be read as bearish.
DAILY CHART
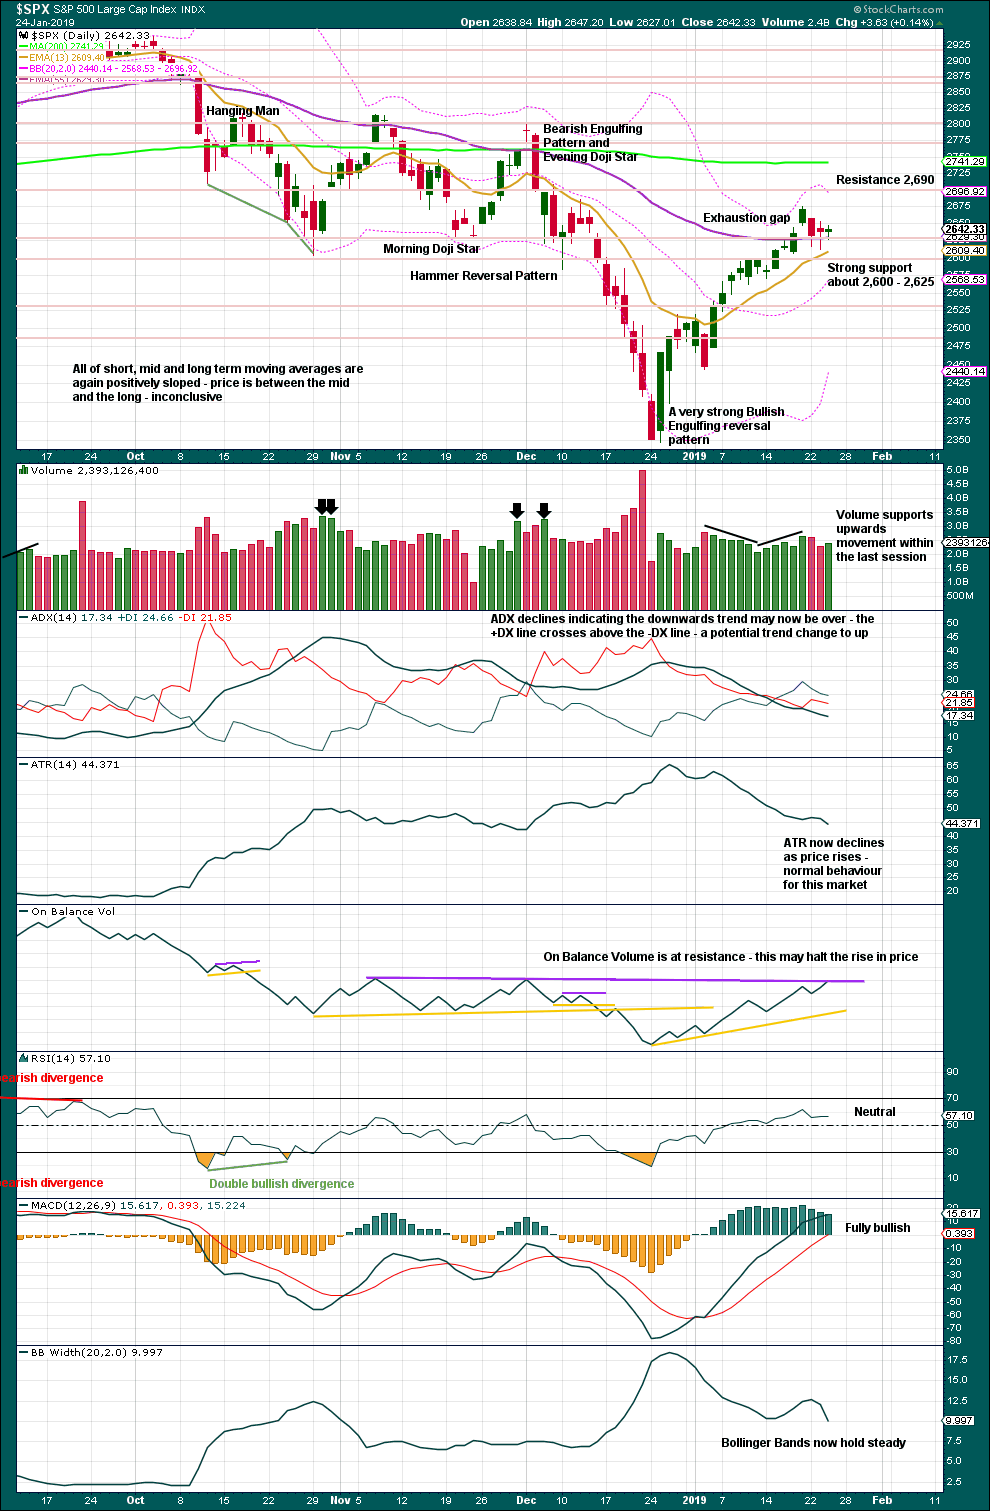
Click chart to enlarge. Chart courtesy of StockCharts.com.
Over a fairly long period of time this ageing bull market has been characterised by upwards movement on light and declining volume and low ATR. For the short to mid term, little concern may be had if price now rises again on declining volume. Current market conditions have allowed for this during a sustained rise in price.
It is also normal for this market to have lower ATR during bullish phases, and strongly increasing ATR during bearish phases. Currently, declining ATR is normal and not of a concern.
Considering the larger picture from the Elliott wave count, some weakness approaching the end of Grand Super Cycle wave I is to be expected.
From Kirkpatrick and Dhalquist, “Technical Analysis” page 152:
“A 90% downside day occurs when on a particular day, the percentage of downside volume exceeds the total of upside and downside volume by 90% and the percentage of downside points exceeds the total of gained points and lost points by 90%. A 90% upside day occurs when both the upside volume and points gained are 90% of their respective totals”…
and “A major reversal is singled when an NPDD is followed by a 90% upside day or two 80% upside days back-to-back”.
The current situation saw two 80% downside days on December 20th and 21st, then a near 90% downside day with 88.97% downside on December 24th. This very heavy selling pressure on three sessions very close together may be sufficient to exhibit the pressure observed in a 90% downside day.
This has now been followed by two 90% upside days: on December 26th and again on 4th January.
The current situation looks very much like a major low has been found.
The last gap is now closed indicating it is an exhaustion gap. A deeper pullback may now be expected.
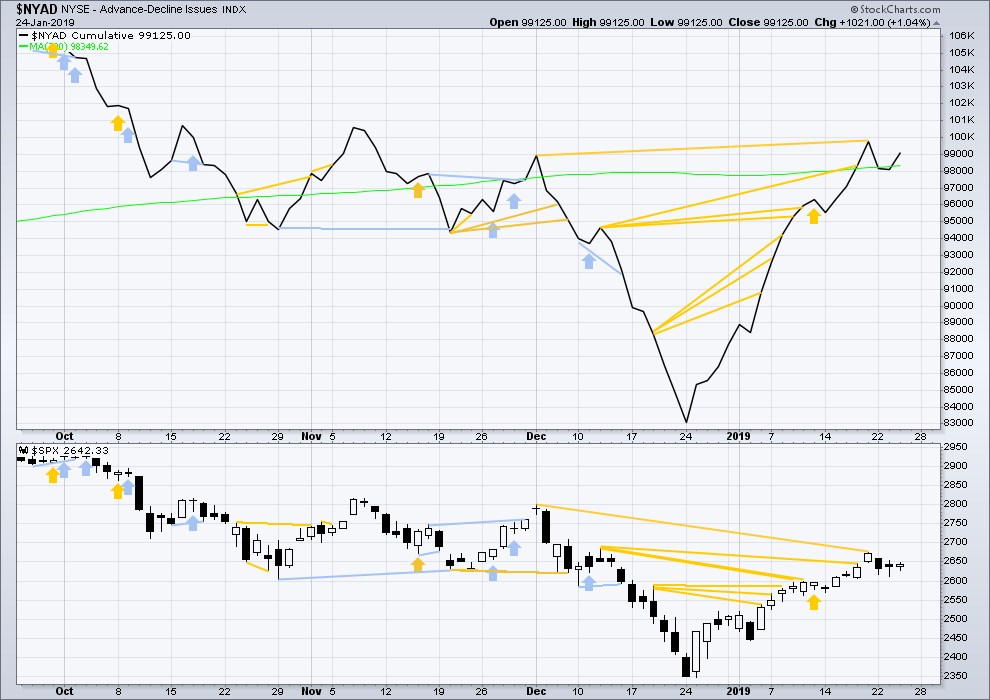
BREADTH – AD LINE
WEEKLY CHART
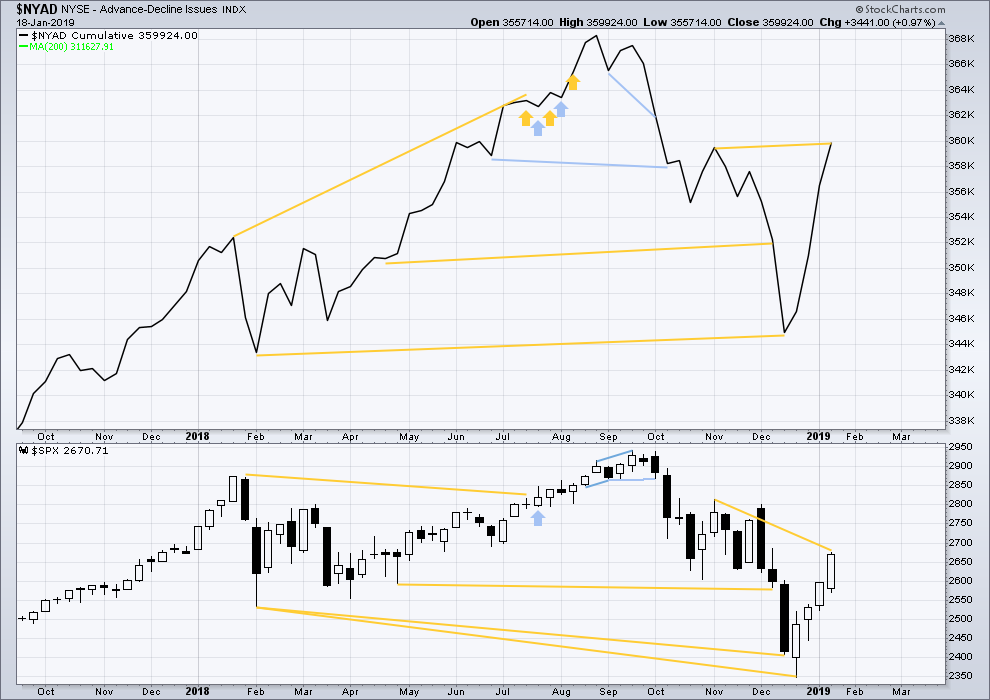
Click chart to enlarge. Chart courtesy of StockCharts.com. So that colour blind members are included, bearish signals
will be noted with blue and bullish signals with yellow.
Last week the AD line has made a new high above the prior swing high of the week beginning 5th of November 2018, but price has not. This divergence is bullish for the mid term.
DAILY CHART
Click chart to enlarge. Chart courtesy of StockCharts.com. So that colour blind members are included, bearish signals
will be noted with blue and bullish signals with yellow.
Breadth should be read as a leading indicator.
There is now a cluster of bullish signals from the AD line. This supports the main Elliott wave count.
Upwards movement within this last session has support from rising market breadth. Breadth is not rising faster than price for this session. There is no short-term divergence.
VOLATILITY – INVERTED VIX CHART
WEEKLY CHART
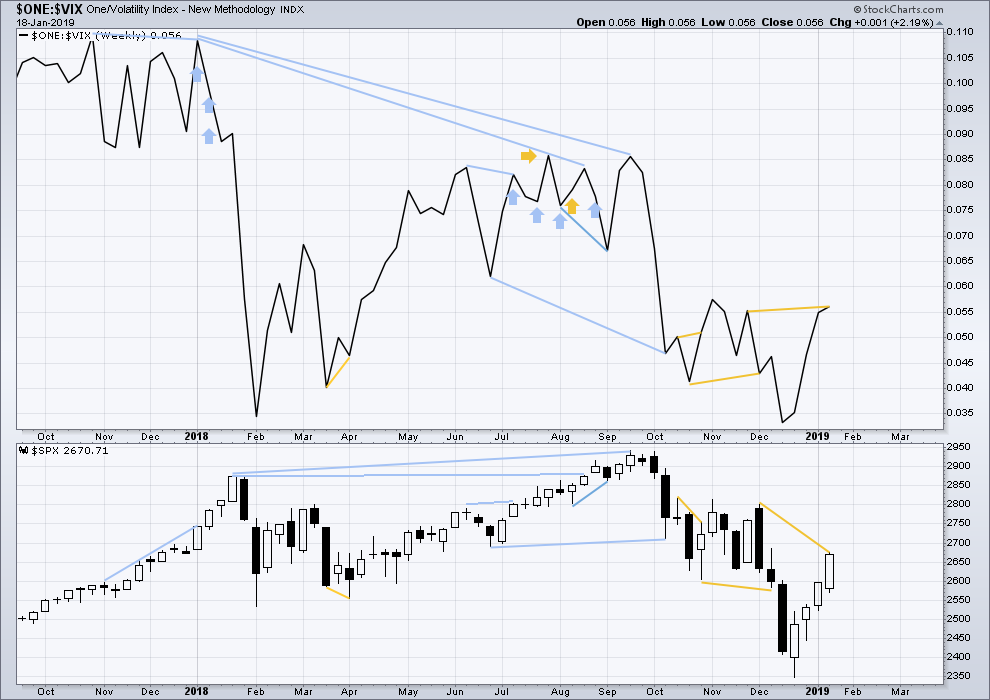
Click chart to enlarge. Chart courtesy of StockCharts.com. So that colour blind members are included, bearish signals
will be noted with blue and bullish signals with yellow.
This week inverted VIX has made a slight new high above the prior swing high of the weeks beginning 26th of November and 3rd of December 2018, but price has not. This divergence is bullish for the mid term.
DAILY CHART
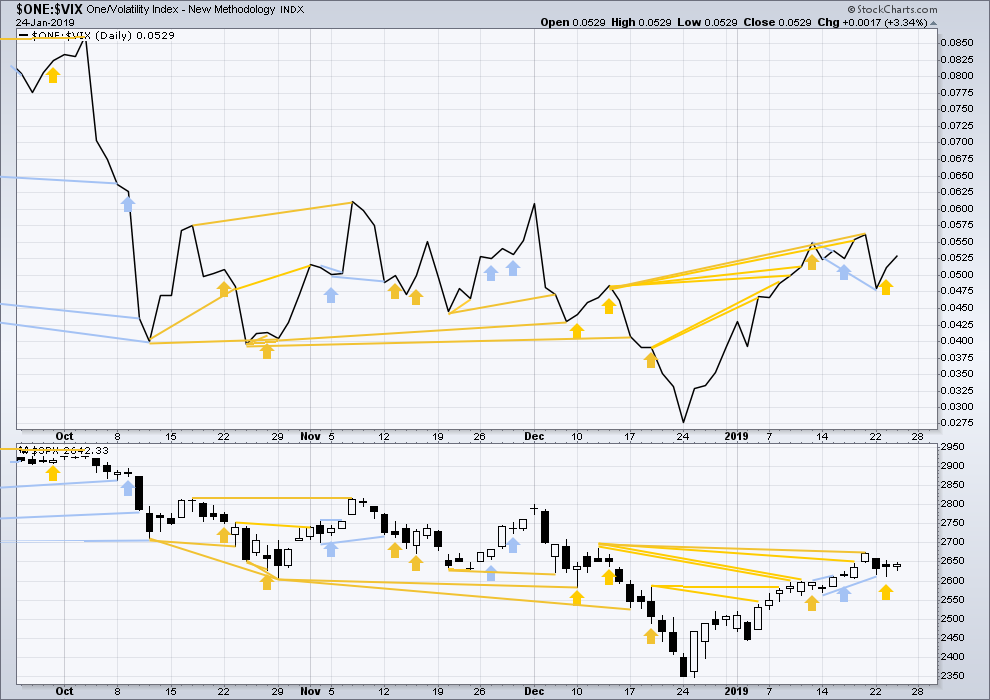
Click chart to enlarge. Chart courtesy of StockCharts.com. So that colour blind members are included, bearish signals
will be noted with blue and bullish signals with yellow.
There is now a cluster of bullish signals from inverted VIX. This supports the main Elliott wave count.
Upwards movement within this last session comes with a normal decline in VIX. VIX is not declining any faster than price is rising today. There is no new short-term divergence.
DOW THEORY
Dow Theory confirms a bear market. This does not necessarily mean a bear market at Grand Super Cycle degree though; Dow Theory makes no comment on Elliott wave counts. On the 25th of August 2015 Dow Theory also confirmed a bear market. The Elliott wave count sees that as part of cycle wave II. After Dow Theory confirmation of a bear market in August 2015, price went on to make new all time highs and the bull market continued.
DJIA: 23,344.52 – a close on the 19th of December at 23,284.97 confirms a bear market.
DJT: 9,806.79 – price has closed below this point on the 13th of December.
S&P500: 2,532.69 – a close on the 19th of December at 2,506.96 provides support to a bear market conclusion.
Nasdaq: 6,630.67 – a close on the 19th of December at 6,618.86 provides support to a bear market conclusion.
Published @ 06:38 p.m. EST.
—
Careful risk management protects your trading account(s).
Follow my two Golden Rules:
1. Always trade with stops.
2. Risk only 1-5% of equity on any one trade.
Found my short entries today. The chart is the last 2 hours of the day. The signals are shown in the yellow rings. My rule is; when using the 5 minute chart to get a signal, the signal requires 2 confirmation candles. So, the signal from a five minute chart requires a 4 candle signal. 15, 20, 30 minute charts require only 3 candle signals.
The retracement entry points are the blue circles. In each case, the retracement went back to the close of its uncertainty candle.
PS — the terms “uncertainty candle, directional candle and confirmation candle” are just nicknames that I came up with. Other people won’t know what those mean.
This is a nice piece of work and observation
Kevin was noticing something similar …
I have been seeing similar signs with vol
But I must say it has been frustrating … to try and get short…
I’m going to be long vol and short s and p via options assignments from Friday
From a psychology test.. Friday actually had me feeling the turmoil of feeling that it was right to be short.. but getting the anxiety of feeling that the market was going to keep pressing me and causing me pain…
When that pain starts getting to you … is usually the time the market turns..
I try and trade without stops for this reason and just counter trade with options positions for hedges
I was trading a lot of hedges the last day and a half… scooping the premiums against my core positions …
So we shall see
I am prepared for one more push to 2692ish
But would prefer the down starts now 🙂
Covered 1/2 my spy shorts and 1/2 my vol longs
Main hourly wave count updated: Minute wave ii must be over here for this count to remain valid.
First alternate hourly wave count updated:
Minor B may now be over. It meets the requirement for a B wave within a flat.
I may also move the degree of labelling within intermediate (2) down one degree; this may be only minute a of minor A completing.
Thanks Lara,
Doesn’t today’s action has the look of a frustrating 4th wave after a very impulsive 3rd wave??
Ie a last wave of 34 points or (34*1.618) points pending, so around 2692 to 2710+ target??
Sorry if I misinterpreted today’s action.
Also DJIA made a new high than last Friday’s high, so i guess SPX will follow.
Thanks
Not necessarily. Intermediate (2) (or primary 2) could begin slowly. As Kevin has noted, tops are a process.
The DJIA has made a new high, but the S&P does not have to follow. Friday’s candlestick for the DJIA is a Shooting Star, this is a bearish reversal pattern (although not a major one).
However, I certainly do acknowledge that this could be a sideways fourth wave. To that end I’ll keep publishing the second alternate and allow for minor 4 to continue sideways. If your own analysis supports that wave count then use that.
This market is running in lockstep with vxx and the crushing of vix futures
Traded vol for over 15 years
I have never seen it this synchronized
Feels like not many real people left I the market
It’s kinda sad to watch
My daily view. Trend is strong up. But price is approaching the trend line that starts at the ATH, as well as the massive resistance in the 2700-2714 range. Also, price has “rounded out” of the up channel initially formed by the move off the Dec low. So yes this may be minor 5 up…but even still, intermediate 2 down is looming.
The bear count is still valid, which makes this market very very confusing. Minute ii “could be” and expanded flat with its b wave going lower than its a wave, and ending at today’s highs… We could start plunging from here… or go higher and higher…
not to mention that the rest of the world has been in a bear market for months…. remember the roaring 20s …… was only roaring in the US
who likes palindromes …. spy high so far 266.62
gonna short against this, just closed 3 red 15 min candles…. we havent had 3 in an up wave for quite some time
fail
This morning I just happened to take a gander at Daneric’s blogpost. He has changed his count from bearish to bullish. This is several weeks, of course, after Lara posted a long term bottom, Cycle Wave 4, is most likely in place.
He has noted the “breadth thrust” as support for this change in wave count. In addition, he stated that EWI has also given this significant weight. Of course you heard it hear long ago from me as I noted in early January that the “Zweig Breadth Thrust Signal” was triggered.
Bottom line, the next best opportunity to go long for a mid-term or long-term position will be the end of Intermediate Wave 2 or Primary Wave 2 as indicated in Lara’s counts. Hopefully that will be around 2450 SPX with a stop loss around 2350.
As always, these are just my thoughts openly shared and never to be construed as trading / investing advice. Successful traders always take 100% responsibility for their trades, never ever blaming someone’s advice, forecast, thoughts etc.
Reprinted from yesterday.
—————————————————————————————————————
Hi ari,
I did see you asked a couple of days ago. I am still sort of out of action with the surgery.
I am not feeling any PVC’s whatsoever. Absolutely no issues or symptoms. However, I do not know if it is the magnesium taurate or the metoprolol prescribed by the doc. I have a 3 month check-up in March. I am considering asking to stop the meds and see what happens. Any thoughts?
Thanks for the recommendation on the magnesium. I might add ‘free’ recommendation. Have a great day.
Hi Rodney! When 2 things are started at once, its hard to tell which one worked. If you actually don’t have any heart problems, such as coronary artery disease (blocked arteries) or any other major heart problems, then you “can” stop the metoprolol and see if the magnesium is doing the trick. If your PVC’s start again, you can re-start the medication…
Or you can just wait until you see your own doctor and see what he/she says…
Glad you’re having less PVC’s 🙂
I have no other issues with my heart. In fact, all reports indicate I have a very strong healthy heart and arteries etc without any blockages. I see the cardiologist in March and will discuss this with her. Thanks ari for your help.
You’re welcome…
Looking at a couple of support lines for a pullback. If price breaks through the bottom line, it seems that they wouldn’t take it lower than 2521. Below 2521 the 4th wave would intrude into the 1st wave.
PS — my count is on the chart for reference points to talk about. Lara’s charts have the real numbers.
Lara
Are you seeing this as a one way or another move of substance that is imminent…
You had mentioned most likely down
But if it doesn’t go.. will the opposit be true
That is what the alternates look like short term
A move to 2670 or above
Thanks for all your work
The futures are pointing towards the 1st alternative-2675
The second alternate is equally as likely.
either way… here comes the 20 week MA, and that’s where I plan a big short
“Are you seeing this as a one way or another move of substance that is imminent”
Not really. If it’s upwards, then the second alternate hourly chart may be correct. That expects weakening upwards movement.
I favour the main hourly and first alternate.
The main hourly expects a strong move down, but the second alternate expects only a sideways chop before the new upwards trend resumes.