
Upwards movement has continued all week exactly as expected.
Price has reached the target and exceeded it by 2.47 points, but the Elliott wave structure is incomplete. A new target is calculated.
Summary: The target for intermediate wave (1) to end is now at 2,687. The target may be met next week.
A classic analysis target using Friday’s gap open is at 2,722.
The bigger picture still expects that a low may now be in place. Further confidence in this view may be had now that price has made new high above 2,631.09. The target is at 3,045 with a limit at 3,477.39. The Elliott wave count has support classic technical analysis.
New updates to this analysis are in bold.
The biggest picture, Grand Super Cycle analysis, is here.
The monthly chart was last published here.
ELLIOTT WAVE COUNT
WEEKLY CHART
Click chart to enlarge.
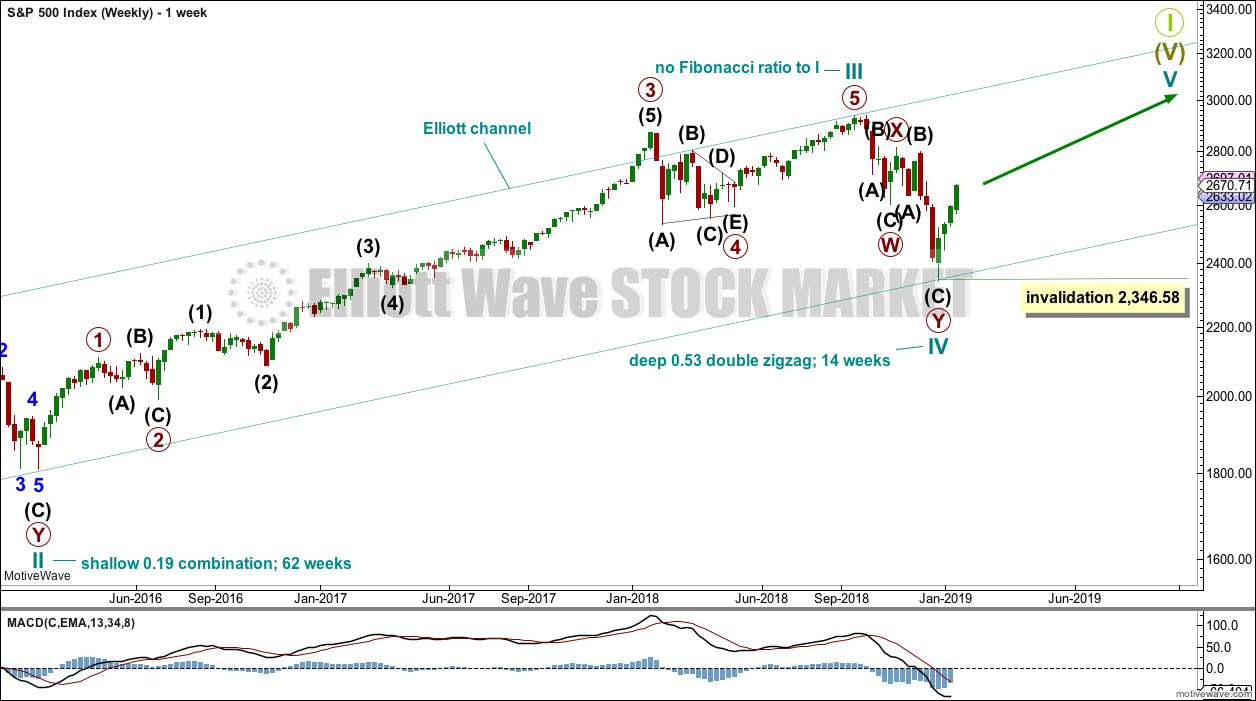
This weekly chart shows all of cycle waves III, IV and V so far.
Cycle wave II fits as a time consuming double combination: flat – X – zigzag. Combinations tend to be more time consuming corrective structures than zigzags. Cycle wave IV has completed as a multiple zigzag that should be expected to be more brief than cycle wave II.
Cycle wave IV may have ended at the lower edge of the Elliott channel.
Within cycle wave V, no second wave correction may move beyond the start of its first wave below 2,346.58.
Although both cycle waves II and IV are labelled W-X-Y, they are different corrective structures. There are two broad groups of Elliott wave corrective structures: the zigzag family, which are sharp corrections, and all the rest, which are sideways corrections. Multiple zigzags belong to the zigzag family and combinations belong to the sideways family. There is perfect alternation between the possible double zigzag of cycle wave IV and the combination of cycle wave II.
Although there is gross disproportion between the duration of cycle waves II and IV, the size of cycle wave IV in terms of price makes these two corrections look like they should be labelled at the same degree. Proportion is a function of either or both of price and time.
Draw the Elliott channel about Super Cycle wave (V) with the first trend line from the end of cycle wave I (at 2,079.46 on the week beginning 30th November 2014) to the high of cycle wave III, then place a parallel copy on the low of cycle wave II. Cycle wave V may find resistance about the upper edge.
DAILY CHART
Click chart to enlarge.
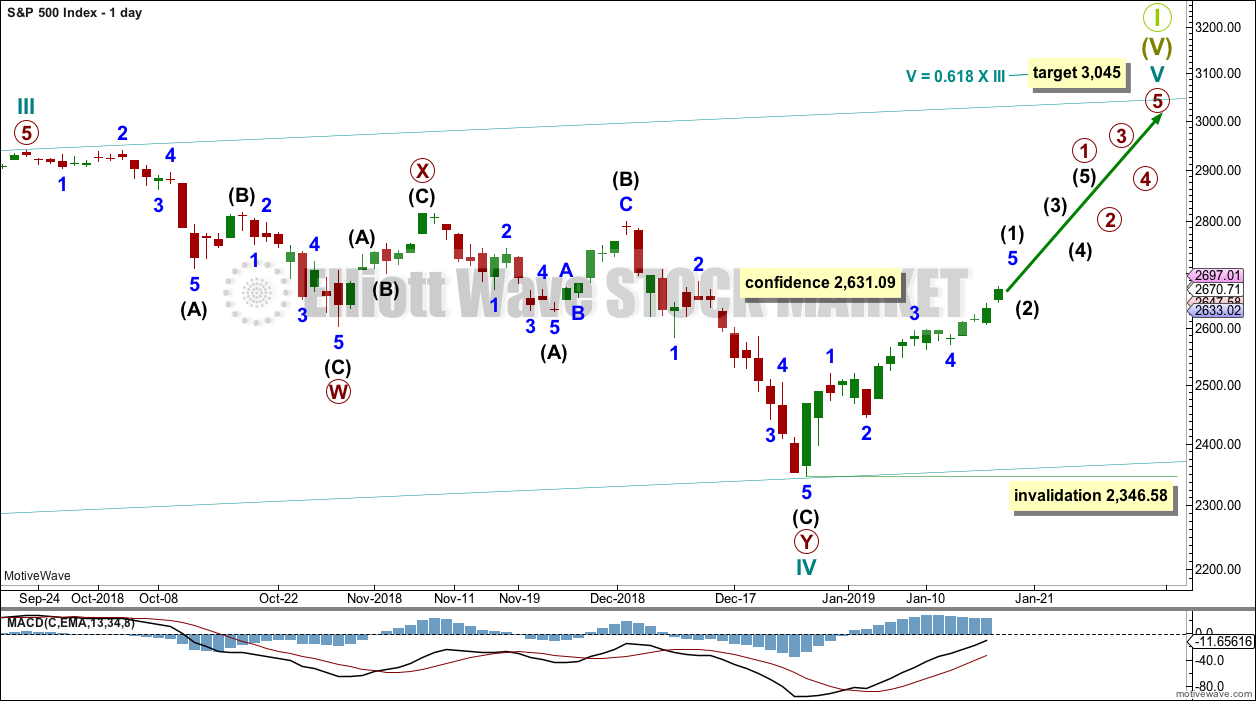
The daily chart will focus on the structure of cycle waves IV and V.
Cycle wave IV may be a complete double zigzag. This would provide perfect alternation with the combination of cycle wave II. Double zigzags are fairly common corrective structures.
Within Super Cycle wave (V), cycle wave III may not be the shortest actionary wave. Because cycle wave III is shorter than cycle wave I, this limits cycle wave V to no longer than equality in length with cycle wave III at 3,477.39. A target is calculated for cycle wave V to end prior to this point.
Cycle wave V must subdivide as a five wave motive structure, either an impulse or an ending diagonal. An impulse is much more common and that will be how it is labelled. A diagonal would be considered if overlapping suggests it.
Within the five wave structure for cycle wave V, primary wave 1 would be incomplete. Within primary wave 1, intermediate wave (1) may be incomplete. The degree of labelling within cycle wave V may need to be adjusted as it unfolds further. At this stage, an adjustment may be to move the degree of labelling within cycle wave V up one degree; it is possible that it could be primary wave 1 now close to completion.
Within cycle wave V, no second wave correction may move beyond the start of its first wave below 2,346.58.
There is more than one way to label the unfolding impulse of intermediate wave (1). If this labelling is correct, then within this impulse minor wave 3 is shorter than minor wave 1. This limits minor wave 5 to no longer than equality with minor wave 3 at 2,731.32, so that minor wave 3 is not the shortest actionary wave and this core Elliott wave rule is met.
However, it is also possible to see minor wave 3 incomplete. Because there is an alternate way to label this impulse the limit at 2,731.32 may be passed and the wave count would remain valid.
MAIN HOURLY CHART
Click chart to enlarge.
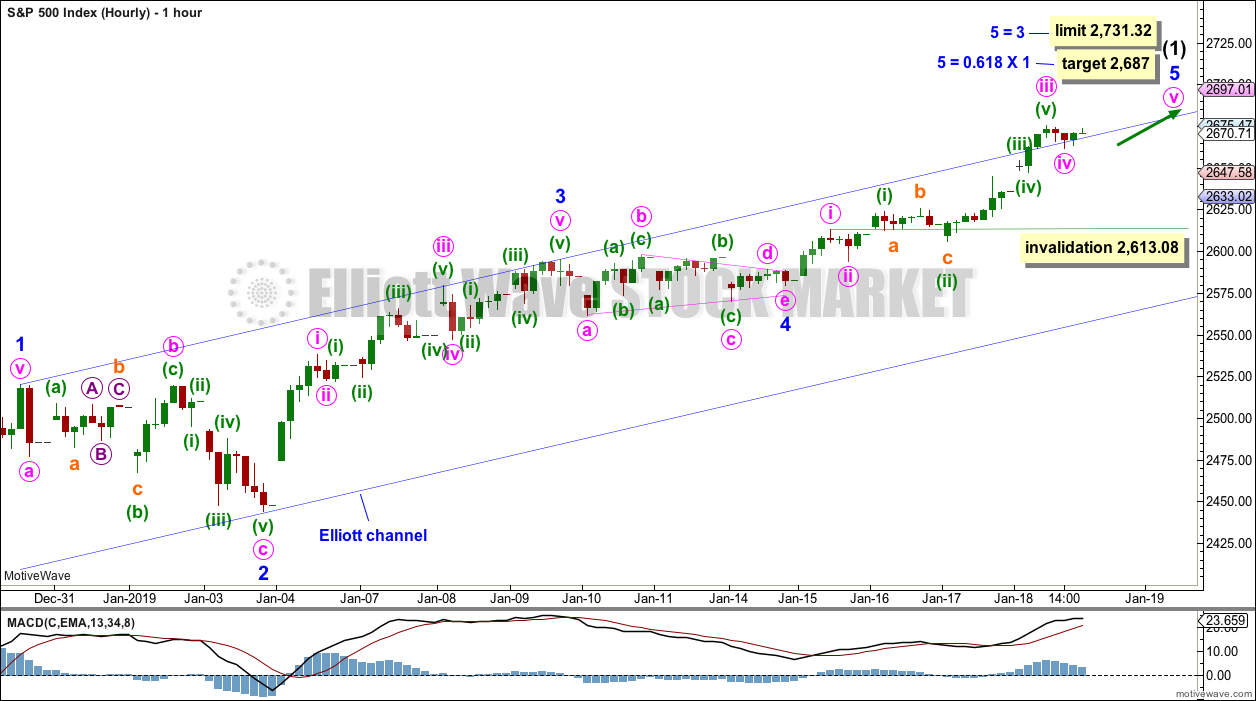
Intermediate wave (1) may be incomplete and may be unfolding as an impulse.
Within the impulse, minor waves 1 to 4 may now be complete. There is perfect alternation between a shallow 0.42 zigzag for minor wave 2 and a much more shallow 0.10 triangle for minor wave 4. Minor wave 2 lasted 27 hours and minor wave 4 lasted 25 hours; their proportion is close to perfect in terms of time.
Within this wave count, minor wave 3 is shorter than minor wave 1. Third waves may never be the shortest actionary wave. Minor wave 5 would be limited to no longer than equality in length with minor wave 3 at 2,731.32, so that this core Elliott wave rule is met.
Minor wave 5 may be unfolding as an impulse.
Within minor wave 5, minute waves i through to iii may be complete. If minute wave iv continues any further, it may not move into minute wave i price territory below 2,613.08.
This wave count agrees with MACD. The strongest momentum is still minor wave 3. Minor wave 5 shows slightly weaker momentum. If this changes, then the alternate below may be preferred.
ALTERNATE HOURLY CHART
Click chart to enlarge.
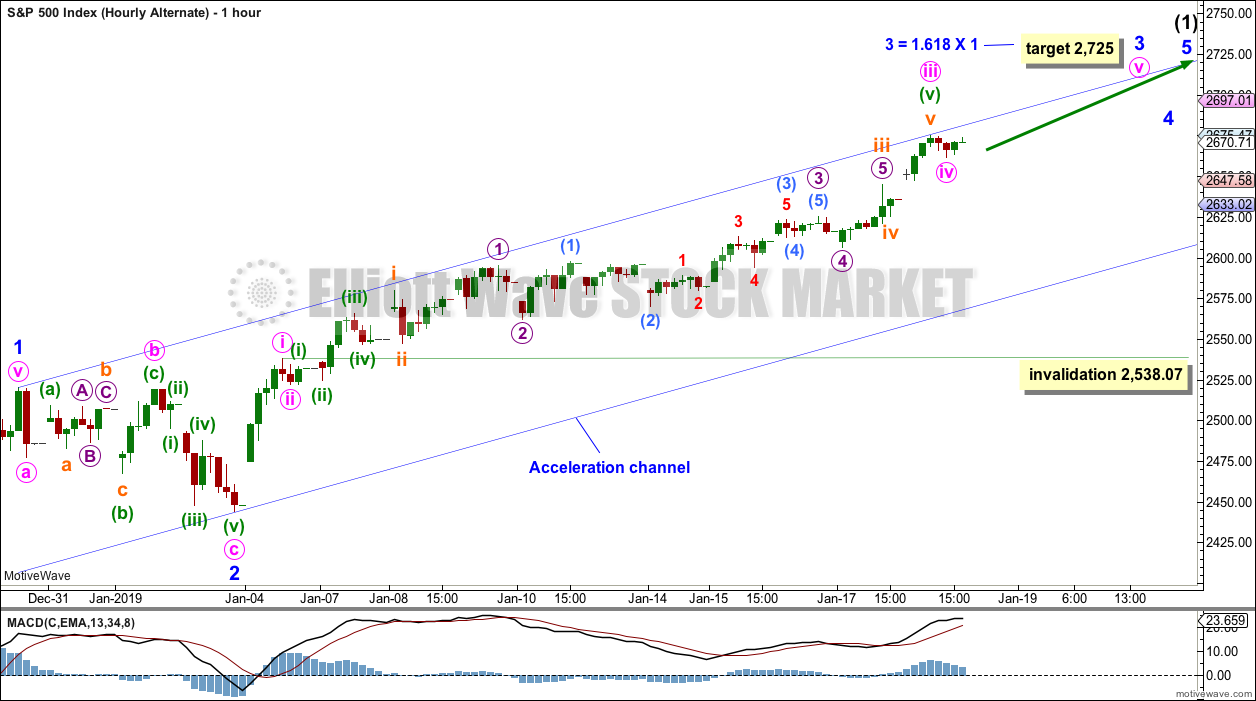
It is possible that minor wave 3 is incomplete. A target is calculated for it to reach the most common Fibonacci ratio to minor wave 1.
Minor wave 3 may only subdivide as an impulse. Within minor wave 3, minute wave iv may not move into minute wave i price territory below 2,538.07.
Draw an acceleration channel as shown. Keep redrawing the channel as price continues higher. When minor wave 3 is complete, this would then be an Elliott channel and minor wave 4 may then find support about the lower edge.
This wave count does not at this time agree as well with MACD as the main wave count. However, if MACD shows an increase in momentum, then this wave count would agree; minor wave 3 should show stronger momentum particularly at its end.
TECHNICAL ANALYSIS
WEEKLY CHART
Click chart to enlarge. Chart courtesy of et=”_blank”>StockCharts.com.
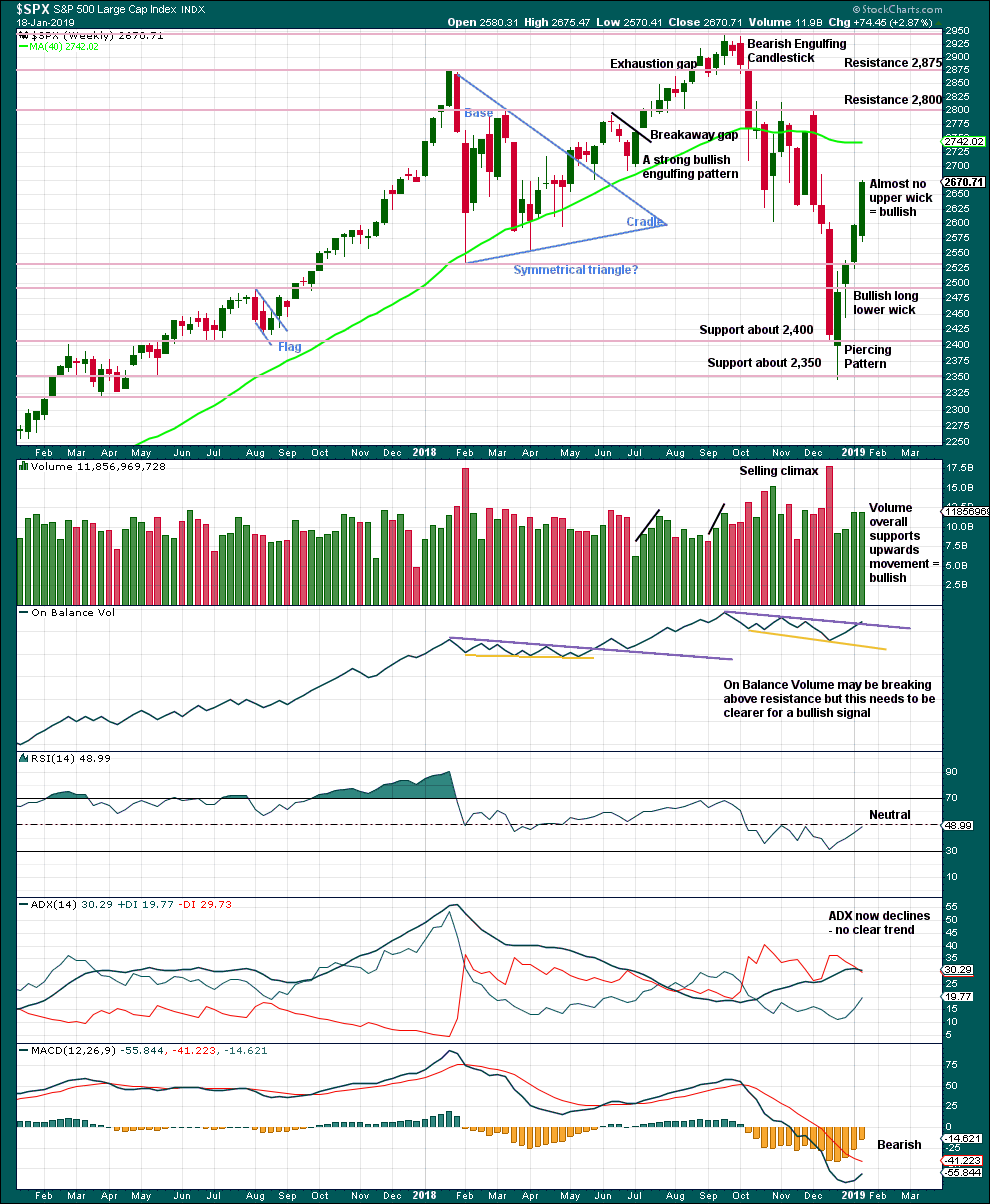
From the all time high to the low of last week, price moved lower by 20.2% of market value meeting the definition for a bear market.
It should be noted that the large fall in price from May 2011 to October 2011 also met this definition of a bear market, yet it was only a very large pullback within a bull market, which so far has lasted almost 10 years.
Again, this weekly candlestick has almost no upper wick. With price closing almost at the high for the week, it looks reasonable to expect more upwards movement next week.
This week volume has very slightly declined from last week. The decline is so slight, this will not be read as bearish.
DAILY CHART
Click chart to enlarge. Chart courtesy of StockCharts.com.
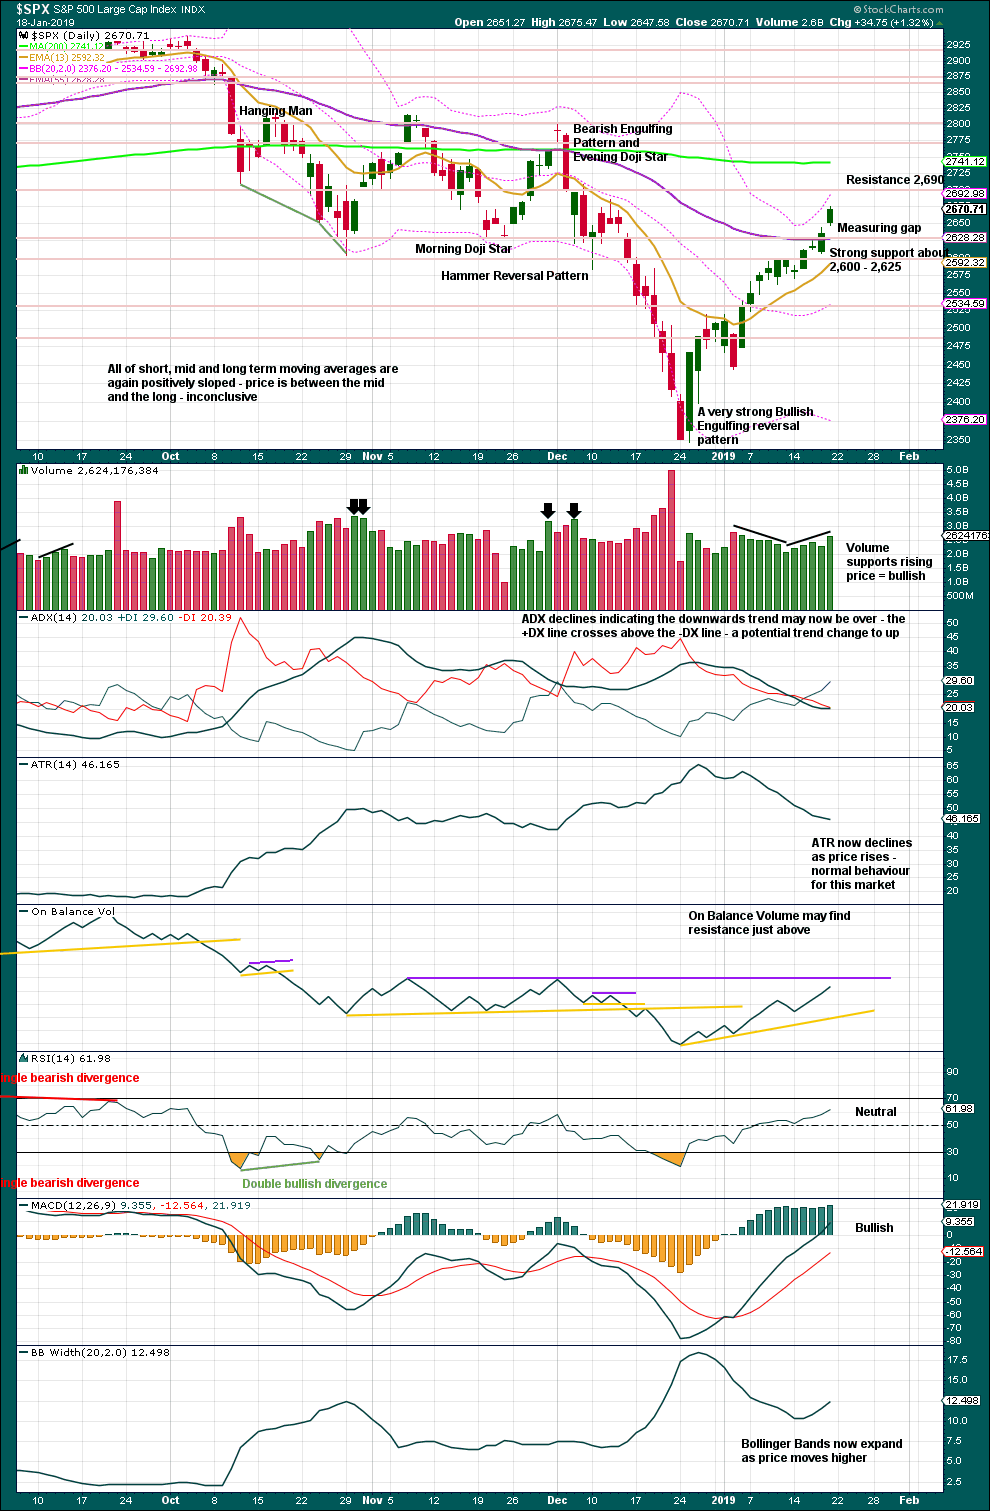
Over a fairly long period of time this ageing bull market has been characterised by upwards movement on light and declining volume and low ATR. For the short to mid term, little concern may be had if price now rises again on declining volume. Current market conditions have allowed for this during a sustained rise in price.
It is also normal for this market to have lower ATR during bullish phases, and strongly increasing ATR during bearish phases. Currently, declining ATR is normal and not of a concern.
Considering the larger picture from the Elliott wave count, some weakness approaching the end of Grand Super Cycle wave I is to be expected.
From Kirkpatrick and Dhalquist, “Technical Analysis” page 152:
“A 90% downside day occurs when on a particular day, the percentage of downside volume exceeds the total of upside and downside volume by 90% and the percentage of downside points exceeds the total of gained points and lost points by 90%. A 90% upside day occurs when both the upside volume and points gained are 90% of their respective totals”…
and “A major reversal is singled when an NPDD is followed by a 90% upside day or two 80% upside days back-to-back”.
The current situation saw two 80% downside days on December 20th and 21st, then a near 90% downside day with 88.97% downside on December 24th. This very heavy selling pressure on three sessions very close together may be sufficient to exhibit the pressure observed in a 90% downside day.
This has now been followed by two 90% upside days: on December 26th and again on 4th January.
The current situation looks very much like a major low has been found.
With volume now supporting rising price, it looks reasonable to expect more upwards movement next week. If a bearish candlestick reversal pattern prints on the daily chart, then a deeper pullback for a second wave may be expected.
The gap open for Friday’s session may be used to calculate a target. Measuring gaps are often halfway within a movement. A target may be at 2,722.
BREADTH – AD LINE
WEEKLY CHART
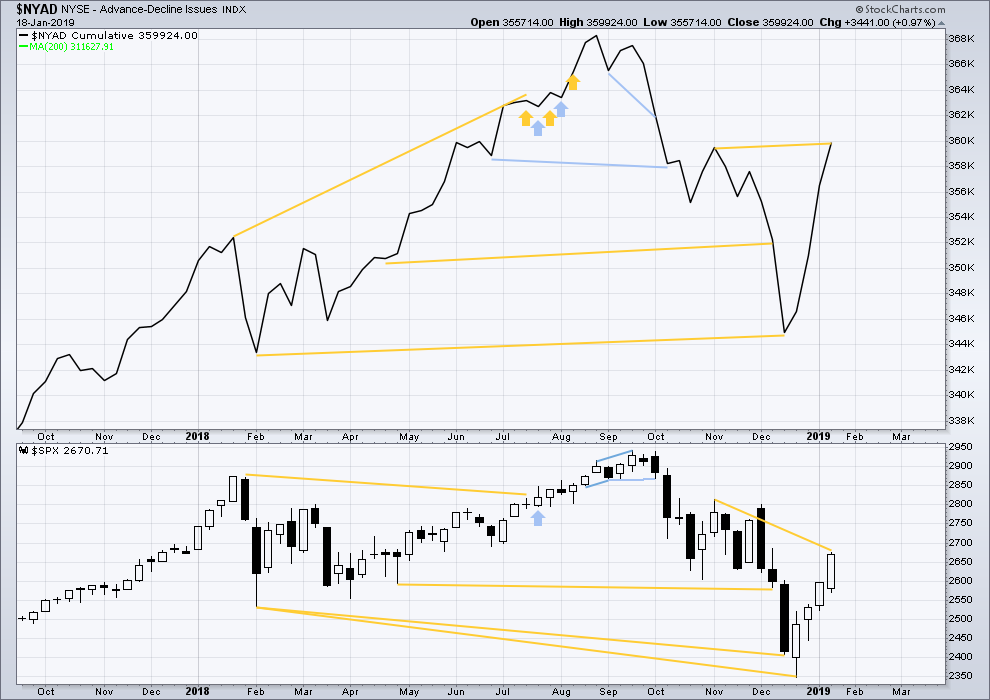
Click chart to enlarge. Chart courtesy of StockCharts.com. So that colour blind members are included, bearish signals
will be noted with blue and bullish signals with yellow.
This week the AD line has made a new high above the prior swing high of the week beginning 5th of November 2018, but price has not. This divergence is bullish for the mid term.
DAILY CHART
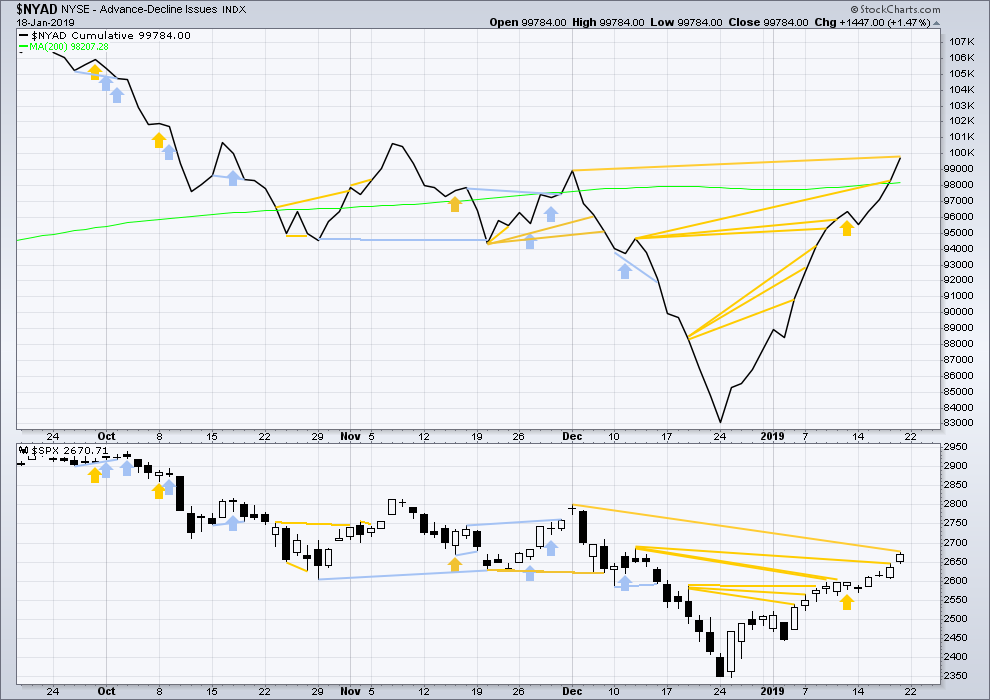
Click chart to enlarge. Chart courtesy of StockCharts.com. So that colour blind members are included, bearish signals
will be noted with blue and bullish signals with yellow.
Breadth should be read as a leading indicator.
There is now a cluster of bullish signals from the AD line. This supports the main Elliott wave count.
Today the AD line has made a new swing high above the prior high of the 3rd of December 2018, but price has not. This divergence is bullish for the mid term.
VOLATILITY – INVERTED VIX CHART
WEEKLY CHART
Click chart to enlarge. Chart courtesy of StockCharts.com. So that colour blind members are included, bearish signals
will be noted with blue and bullish signals with yellow.
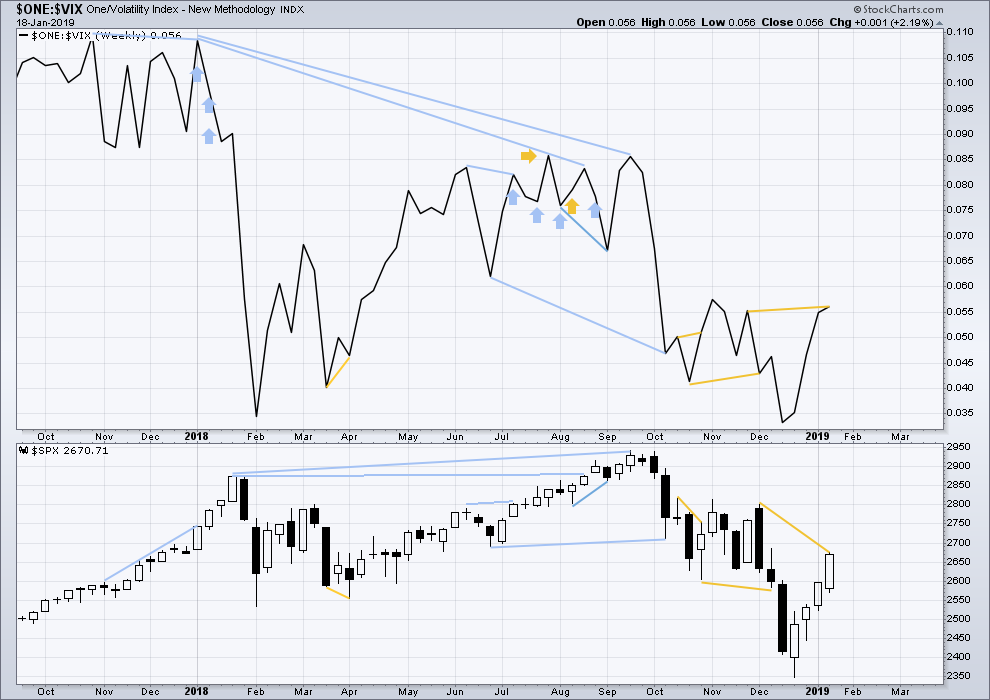
This week inverted VIX has made a slight new high above the prior swing high of the weeks beginning 26th of November and 3rd of December 2018, but price has not. This divergence is bullish for the mid term.
DAILY CHART
Click chart to enlarge. Chart courtesy of StockCharts.com. So that colour blind members are included, bearish signals
will be noted with blue and bullish signals with yellow.
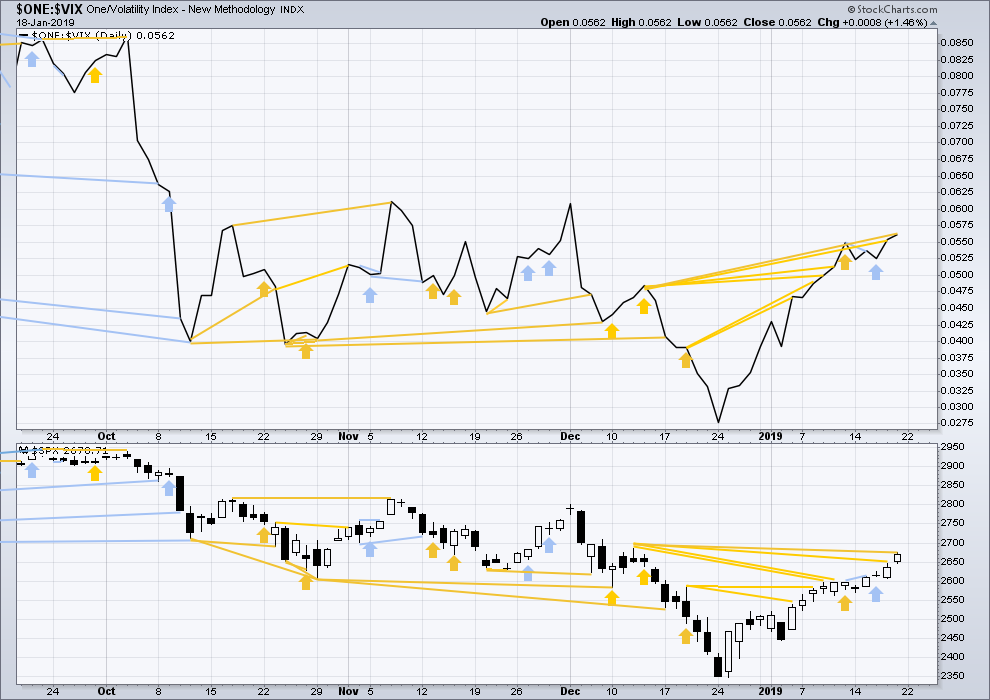
There is now a cluster of bullish signals from inverted VIX. This supports the main Elliott wave count.
Inverted VIX continues to make new highs above the prior swing high of the 12th / 13th of December 2018, but price has not. This divergence is bullish.
DOW THEORY
Dow Theory confirms a bear market. This does not necessarily mean a bear market at Grand Super Cycle degree though; Dow Theory makes no comment on Elliott wave counts. On the 25th of August 2015 Dow Theory also confirmed a bear market. The Elliott wave count sees that as part of cycle wave II. After Dow Theory confirmation of a bear market in August 2015, price went on to make new all time highs and the bull market continued.
DJIA: 23,344.52 – a close on the 19th of December at 23,284.97 confirms a bear market.
DJT: 9,806.79 – price has closed below this point on the 13th of December.
S&P500: 2,532.69 – a close on the 19th of December at 2,506.96 provides support to a bear market conclusion.
Nasdaq: 6,630.67 – a close on the 19th of December at 6,618.86 provides support to a bear market conclusion.
Published @ 11:58 p.m. EST.
—
Careful risk management protects your trading account(s).
Follow my two Golden Rules:
1. Always trade with stops.
2. Risk only 1-5% of equity on any one trade.
This downwards movement today looks too big to be part of minor wave 5. This looks like the start of intermediate wave (2).
The preferred target for intermediate wave (2) would be the 0.618 Fibonacci ratio of intermediate wave (1) at 2,742.22. It may be expected to last maybe a Fibonacci three or five weeks in total.
Lara,
Is it possible that the trade down today is some / all of minor 4 of intermediate 1? Maybe Fridays high was minor 3?
Bought SPY puts at the open and sold them here at the 0.618…. now gonna try to go long to the target !
Ok, short then
LOL!!!! Laughing with you, not at you…
Also Lara posted EURUSD chart with a 1.13 invalidation. Currently trading at 1.136….. I’ll take that bet!
hmmm
The 20 week MA has provided resistance and a sell off 3 times since Oct
I am reviewing slides from this weekends “Macro Voices” conference (www.macrovoices.com) and the majority of these analysts/traders are equities bears and are advising to sell every rally
Hi Lara,
As now the bearish count has been invalidated & we are left with only bullish count and firmly in cycle V, from the timing point of view do you still think Oct-19 or u see a possibility of us topping in Mar-19, if we are in currently completeing Primary 1 instead of intermediate 1.
Thanks
As we’re almost at the end of January, March 2019 seems to be too close.
October looks more likely.
And I’m only picking October because it seems to be a popular month for major bull market highs; 1929, 1987, 2007.
I was thinking the exact same thing over the past couple of days, that this wave up is P1 of cycle 5. But only time can tell which one is correct.
I also think that this second wave most likely will not be a deep one, but a choppy, time consuming correction. It really seems like whoever wanted to sell this market, sold out in December… not too many sellers left other than profit takers. Just my feel for the market…
True. If I move the degree of labelling up one, then it could just possibly maybe end in March… but it would have to hurry up.