
The upwards trend has resumed after a small triangle completed, which was exactly what the Elliott wave count expected.
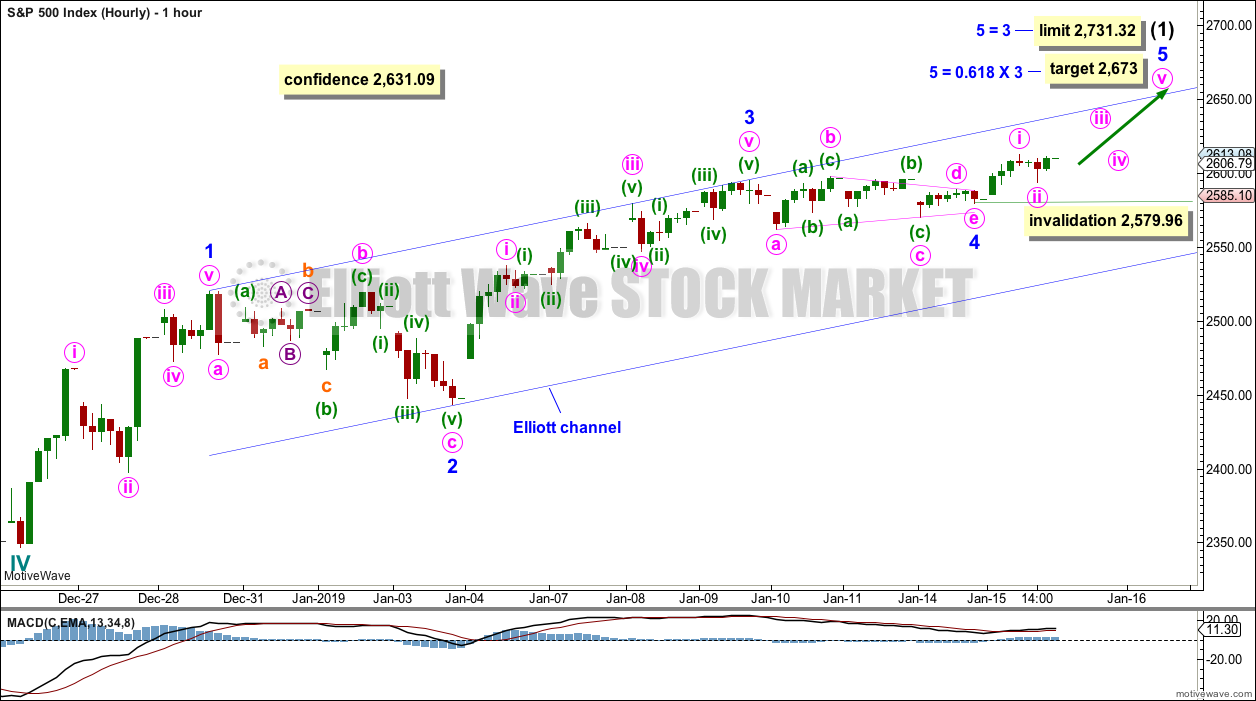
Summary: The target for intermediate wave (1) to end is at 2,673 with a limit at 2,731.32. The target may be met in another two to three sessions.
The bigger picture still expects that a low may now be in place. Confidence in this view may be had if price makes a new high above 2,631.09. The target is at 3,045 with a limit at 3,477.39. This primary view has support from strongly rising market breadth and a 90% up day on the 4th of January.
The alternate wave count expects one more low before cycle wave IV is complete. Targets are either 2,269 or 2,242 – 2,240, although when intermediate wave (4) may be complete the target would be recalculated.
New updates to this analysis are in bold.
The biggest picture, Grand Super Cycle analysis, is here.
The monthly chart was last published here.
MAIN ELLIOTT WAVE COUNT
WEEKLY CHART
Click chart to enlarge.
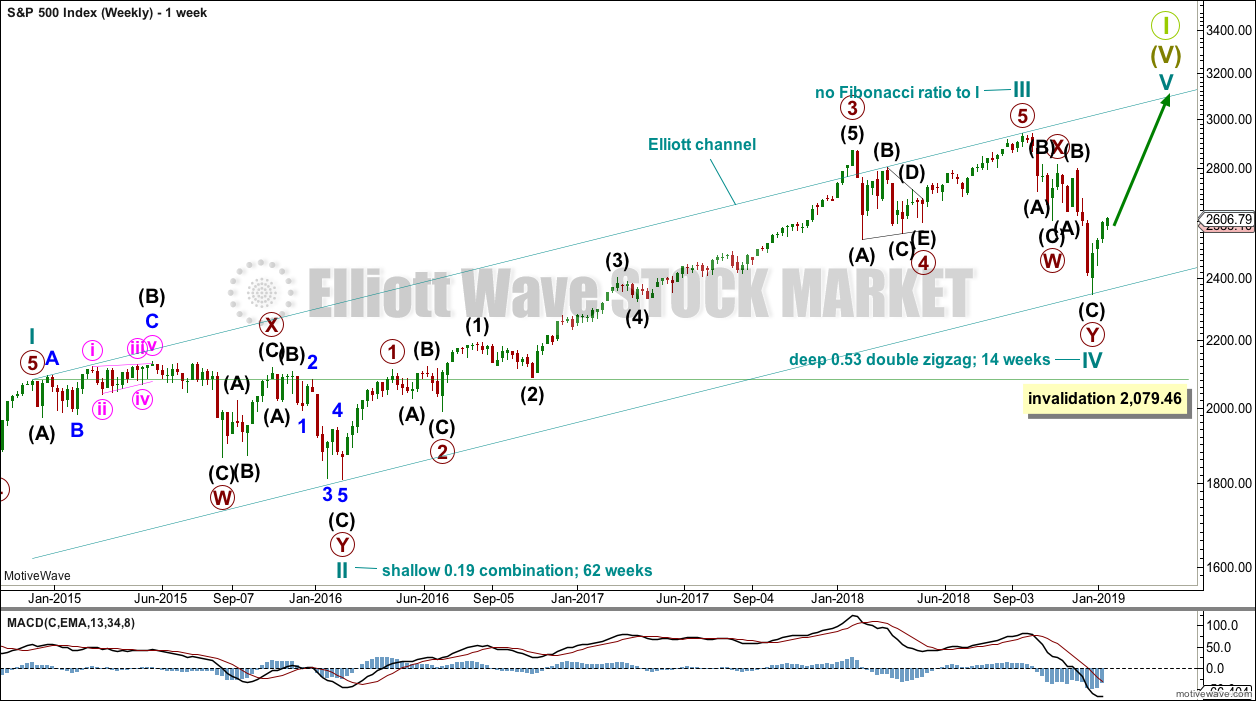
This weekly chart shows all of cycle waves II, III and IV so far.
Cycle wave II fits as a time consuming double combination: flat – X – zigzag. Combinations tend to be more time consuming corrective structures than zigzags. If cycle wave IV completes as a single or multiple zigzag, then it should be expected to be more brief than cycle wave II.
Cycle wave IV may have ended at the lower edge of the Elliott channel. Fourth waves are not always contained within Elliott channels. If the alternate daily wave count below is correct, then cycle wave IV may breach this channel.
Cycle wave IV may not move into cycle wave I price territory below 2,079.46.
Although both cycle waves II and IV are labelled W-X-Y, they are different corrective structures. There are two broad groups of Elliott wave corrective structures: the zigzag family, which are sharp corrections, and all the rest, which are sideways corrections. Multiple zigzags belong to the zigzag family and combinations belong to the sideways family. There is perfect alternation between the possible double zigzag of cycle wave IV and the combination of cycle wave II.
Although there is gross disproportion between the duration of cycle waves II and IV, the size of cycle wave IV in terms of price makes these two corrections look like they should be labelled at the same degree. Proportion is a function of either or both of price and time.
Draw the Elliott channel about Super Cycle wave (V) as shown. Cycle wave V may find resistance about the upper edge.
DAILY CHART
Click chart to enlarge.
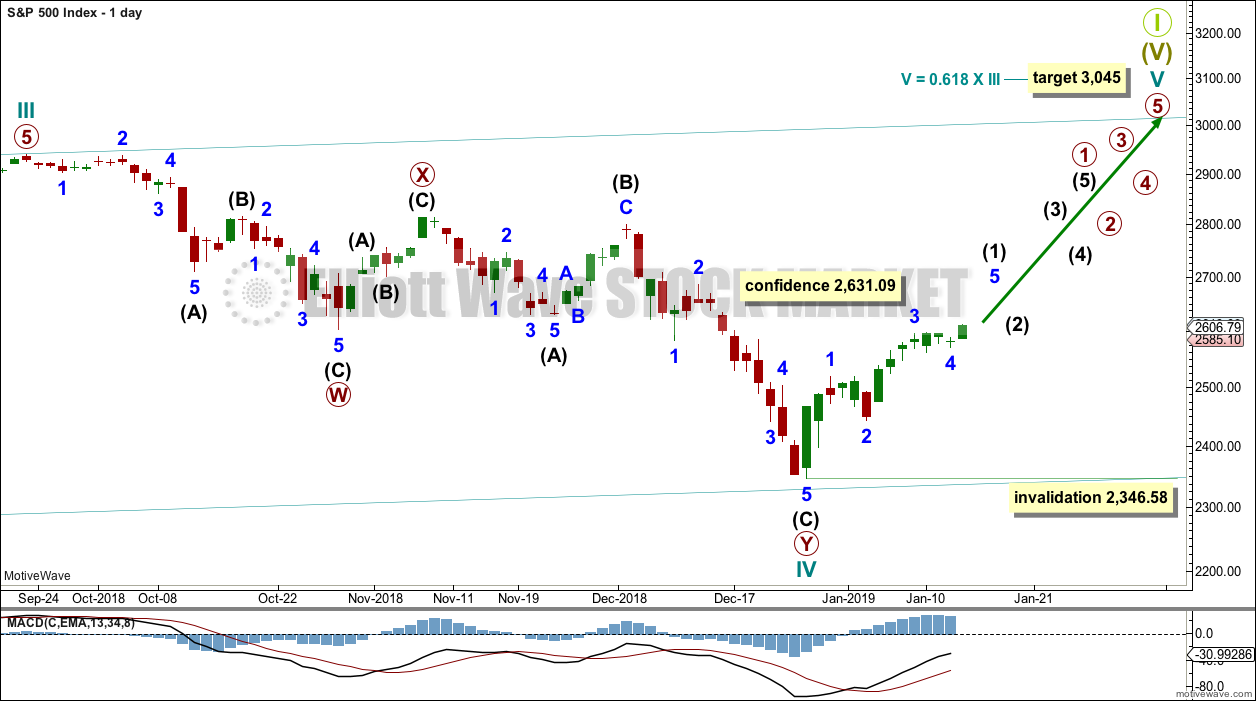
The daily chart will focus on the structure of cycle waves IV and V.
Cycle wave IV may be a complete double zigzag. This would provide perfect alternation with the combination of cycle wave II. Double zigzags are fairly common corrective structures.
Within Super Cycle wave (V), cycle wave III may not be the shortest actionary wave. Because cycle wave III is shorter than cycle wave I, this limits cycle wave V to no longer than equality in length with cycle wave III at 3,477.39. A target is calculated for cycle wave V to end prior to this point.
Cycle wave V must subdivide as a five wave motive structure, either an impulse or an ending diagonal. An impulse is much more common and that will be how it is labelled. A diagonal would be considered if overlapping suggests it.
Within the five wave structure for cycle wave V, primary wave 1 would be incomplete. Within primary wave 1, intermediate wave (1) may be incomplete. The degree of labelling within cycle wave V may need to be adjusted as it unfolds further. At this stage, an adjustment may be to move the degree of labelling within cycle wave V up one degree; it is possible that it could be primary wave 1 now close to completion.
Within cycle wave V, no second wave correction may move beyond the start of its first wave below 2,346.58.
At this stage, a new high by any amount at any time frame above 2,631.09 would invalidate the alternate wave count below and provide confidence in this main wave count.
HOURLY CHART
Click chart to enlarge.
Intermediate wave (1) may be incomplete and may be unfolding as an impulse.
Within the impulse, minor waves 1 to 4 may now be complete. There is perfect alternation between a shallow 0.42 zigzag for minor wave 2 and a much more shallow 0.10 triangle for minor wave 4. Minor wave 2 lasted 27 hours and minor wave 4 lasted 25 hours; their proportion is close to perfect in terms of time.
Within this wave count, minor wave 3 is shorter than minor wave 1. Third waves may never be the shortest actionary wave. Minor wave 5 would be limited to no longer than equality in length with minor wave 3 at 2,731.32, so that this core Elliott wave rule is met.
Within minor wave 5, if minute wave ii continues further, it may not move beyond the start of minute wave i below 2,579.96.
ALTERNATE DAILY CHART
Click chart to enlarge.
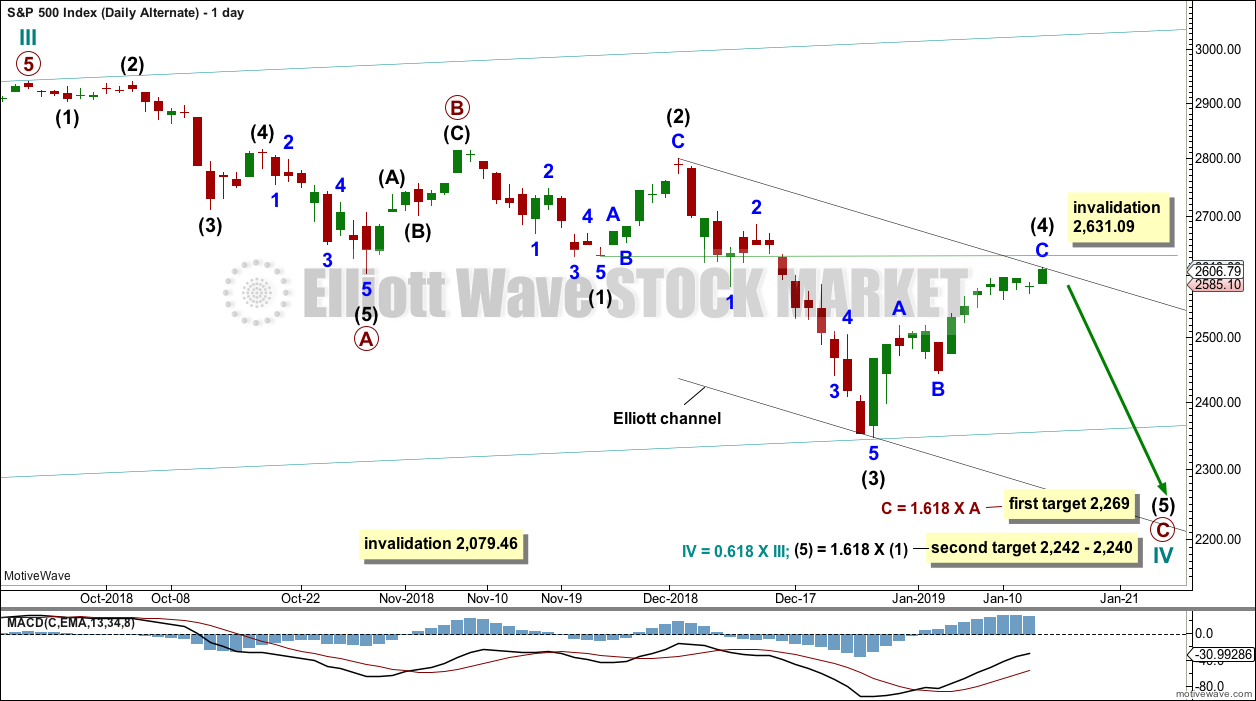
Cycle wave IV may be a an incomplete single zigzag. This would provide perfect alternation with the combination of cycle wave II. Zigzags are the most common corrective structures.
Within this zigzag, primary wave C may be completing as a five wave impulse.
Intermediate wave (2) shows up on the weekly and daily charts. Intermediate wave (4) now also shows on weekly and daily charts. This wave count has the right look.
Intermediate wave (4) may not move into intermediate wave (1) price territory above 2,631.09.
Targets are calculated for cycle wave IV to end. If price gets to the first target and the structure is incomplete, or if price falls through the first target, then the second target may be used.
Redraw the channel about primary wave C using Elliott’s second technique. Draw the first trend line from the high of intermediate wave (2) to the high of intermediate wave (4), then place a parallel copy on the low of intermediate wave (3). If intermediate wave (4) continues higher, then redraw the channel using the same technique. The lower edge may then provide support for intermediate wave (5).
It is my judgement today that the probability of this alternate wave count has reduced to the point that it no longer warrants an hourly chart.
TECHNICAL ANALYSIS
WEEKLY CHART
Click chart to enlarge. Chart courtesy of et=”_blank”>StockCharts.com.
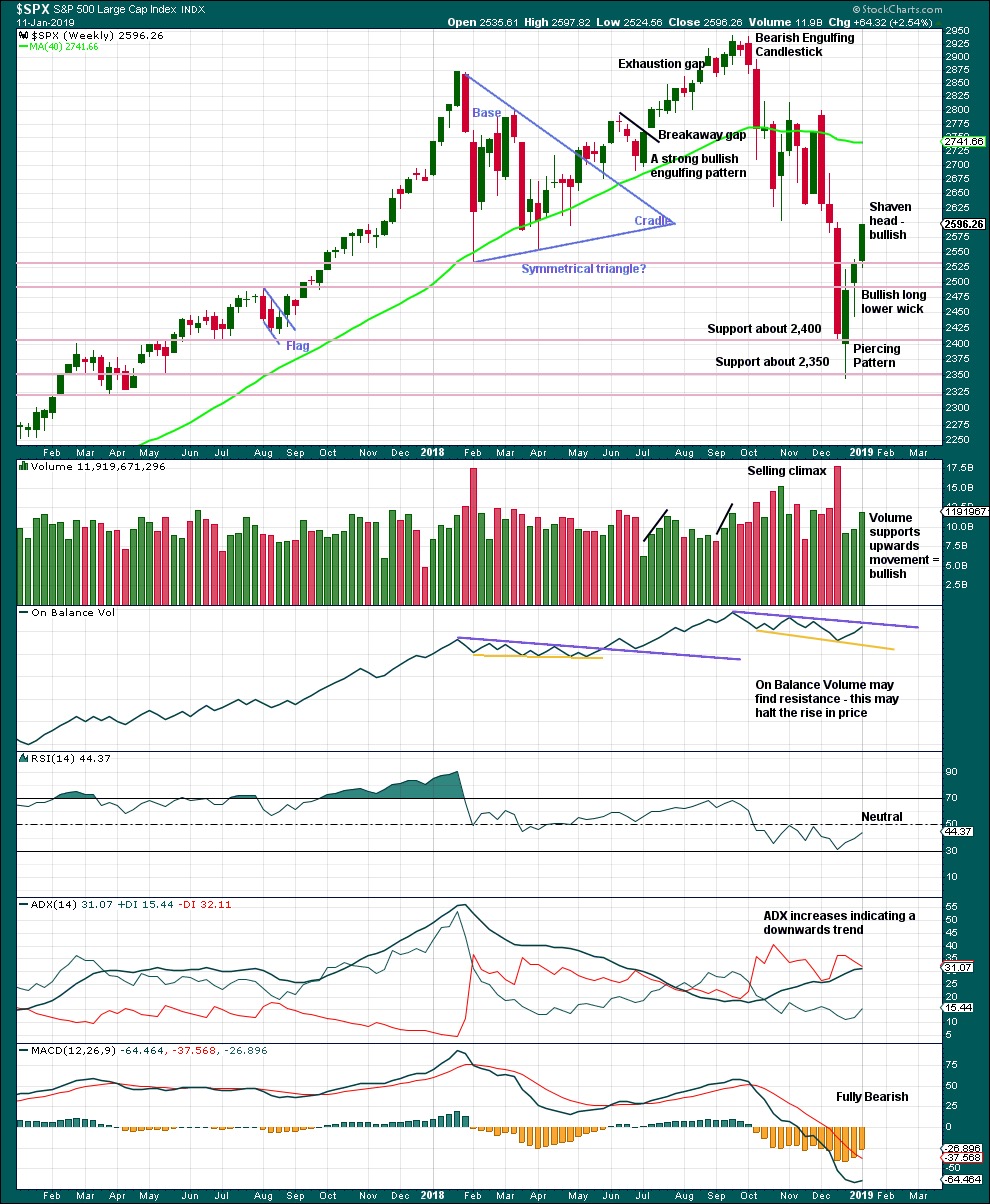
From the all time high to the low of last week, price moved lower by 20.2% of market value meeting the definition for a bear market.
It should be noted that the large fall in price from May 2011 to October 2011 also met this definition of a bear market, yet it was only a very large pullback within a bull market, which so far has lasted almost 10 years.
The last weekly candlestick with a shaven head and good support from volume strongly suggests more upwards movement this week.
DAILY CHART
Click chart to enlarge. Chart courtesy of StockCharts.com.
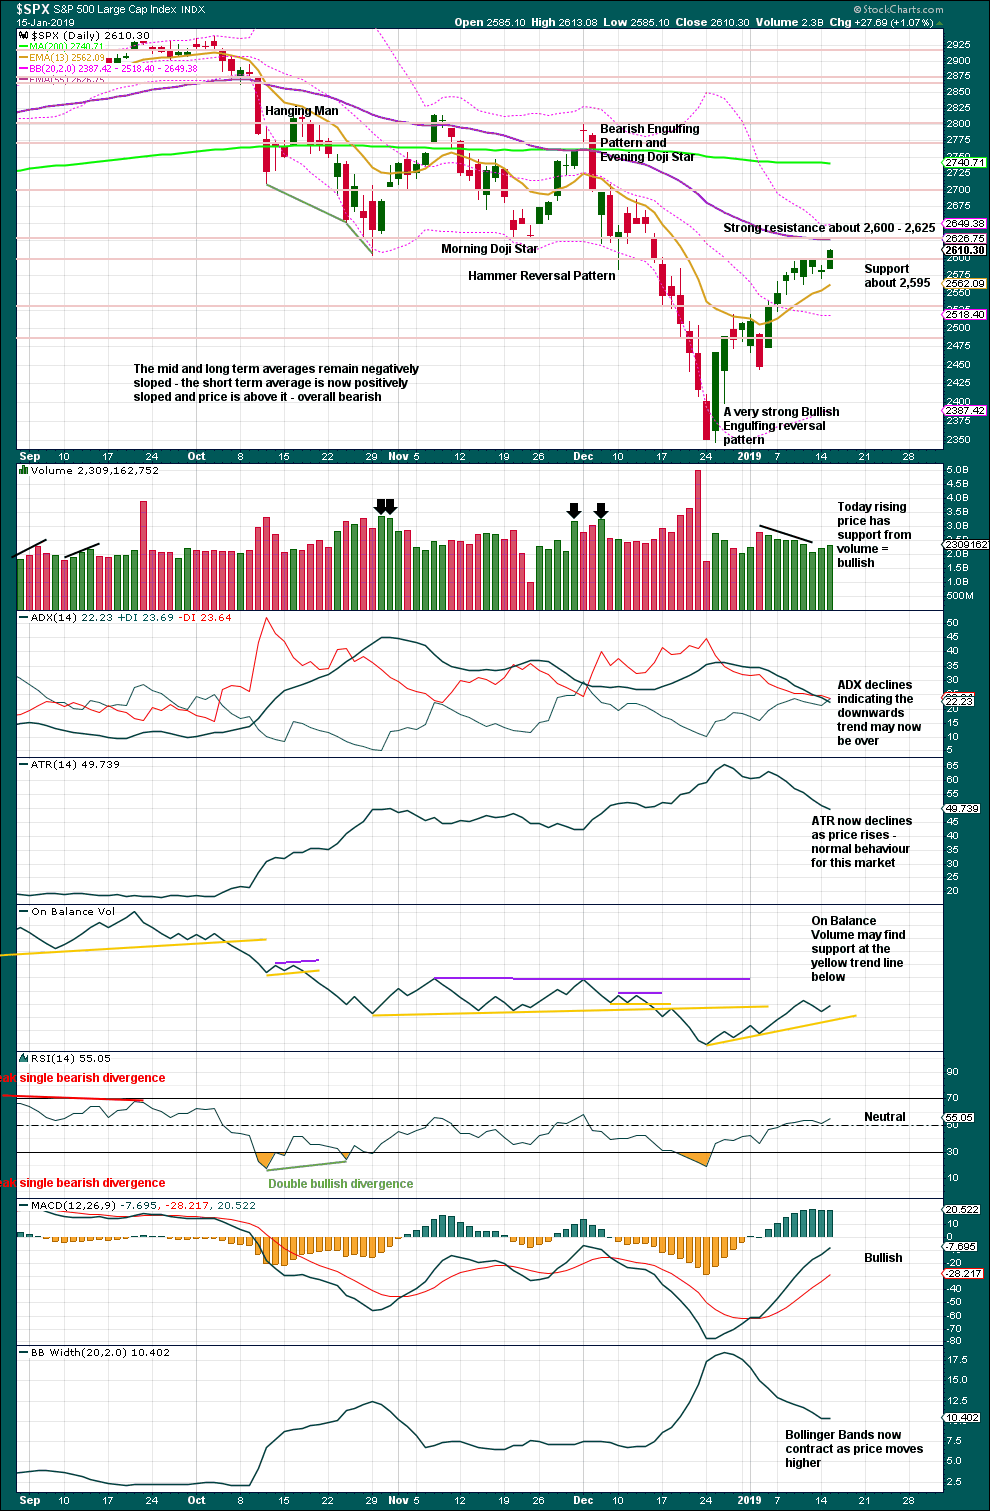
Over a fairly long period of time this ageing bull market has been characterised by upwards movement on light and declining volume and low ATR. For the short to mid term, little concern may be had if price now rises again on declining volume. Current market conditions have allowed for this during a sustained rise in price.
It is also normal for this market to have lower ATR during bullish phases, and strongly increasing ATR during bearish phases. Currently, declining ATR is normal and not of a concern.
Considering the larger picture from the Elliott wave count, some weakness approaching the end of Grand Super Cycle wave I is to be expected.
From Kirkpatrick and Dhalquist, “Technical Analysis” page 152:
“A 90% downside day occurs when on a particular day, the percentage of downside volume exceeds the total of upside and downside volume by 90% and the percentage of downside points exceeds the total of gained points and lost points by 90%. A 90% upside day occurs when both the upside volume and points gained are 90% of their respective totals”…
and “A major reversal is singled when an NPDD is followed by a 90% upside day or two 80% upside days back-to-back”.
The current situation saw two 80% downside days on December 20th and 21st, then a near 90% downside day with 88.97% downside on December 24th. This very heavy selling pressure on three sessions very close together may be sufficient to exhibit the pressure observed in a 90% downside day.
This has now been followed by two 90% upside days: on December 26th and again on 4th January.
The current situation looks very much like a major low has been found.
A close very near the high for today’s session, in conjunction with support from volume today, looks very much like more upwards movement may be expected tomorrow.
This analysis overall supports the main Elliott wave count.
BREADTH – AD LINE
WEEKLY CHART
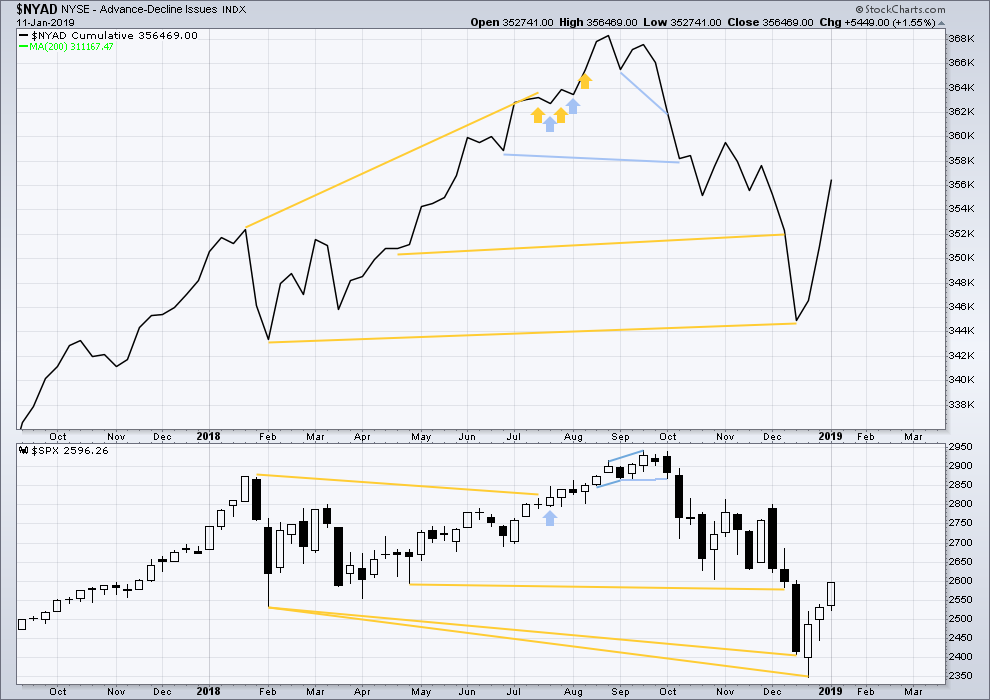
Click chart to enlarge. Chart courtesy of StockCharts.com. So that colour blind members are included, bearish signals
will be noted with blue and bullish signals with yellow.
Upwards movement has support from rising market breadth.
DAILY CHART
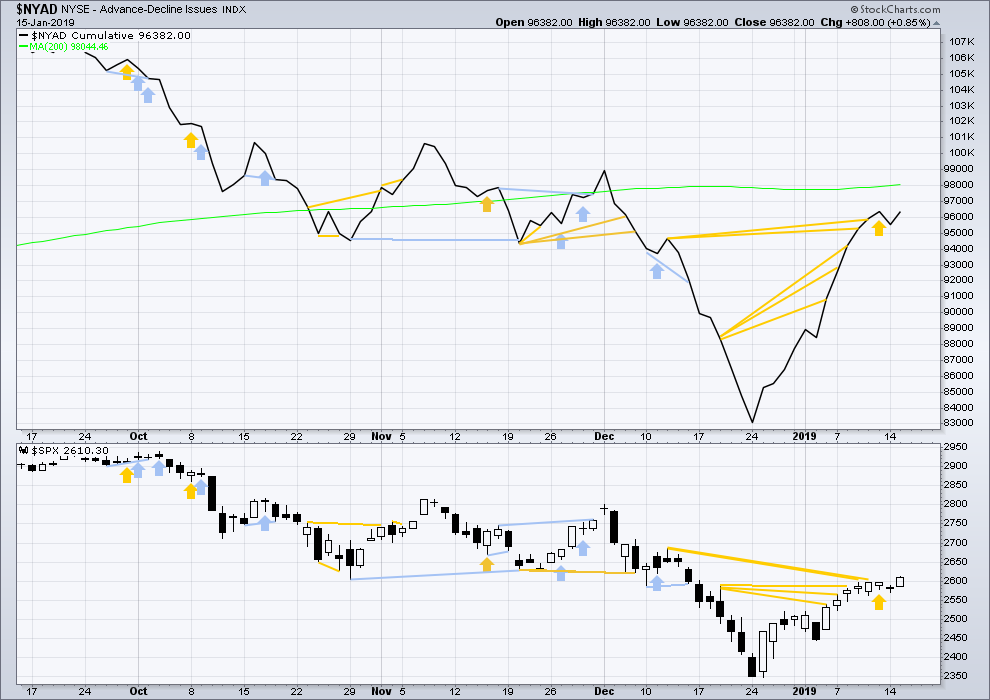
Click chart to enlarge. Chart courtesy of StockCharts.com. So that colour blind members are included, bearish signals
will be noted with blue and bullish signals with yellow.
Breadth should be read as a leading indicator.
There is now a cluster of bullish signals from the AD line. This supports the main Elliott wave count.
Both price and the AD line moved higher today. Price has made new highs above the 11th of January, but the AD line is essentially flat with that date. There is very weak divergence here, but it is too weak to be given much weight.
VOLATILITY – INVERTED VIX CHART
WEEKLY CHART
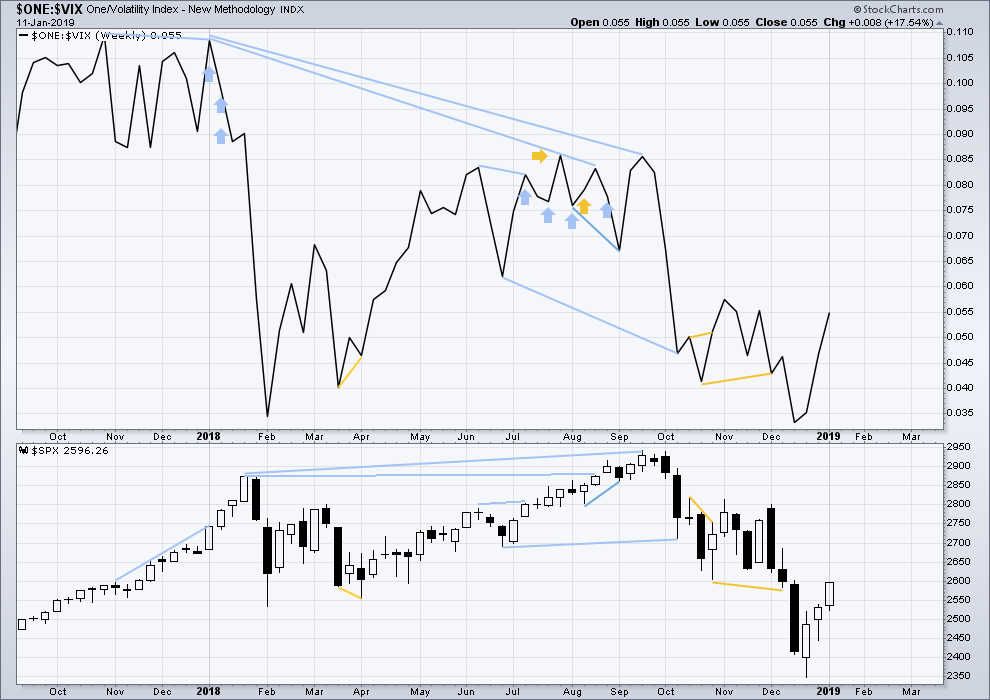
Click chart to enlarge. Chart courtesy of StockCharts.com. So that colour blind members are included, bearish signals
will be noted with blue and bullish signals with yellow.
Upwards movement has support from a corresponding decline in VIX. There is no divergence.
DAILY CHART
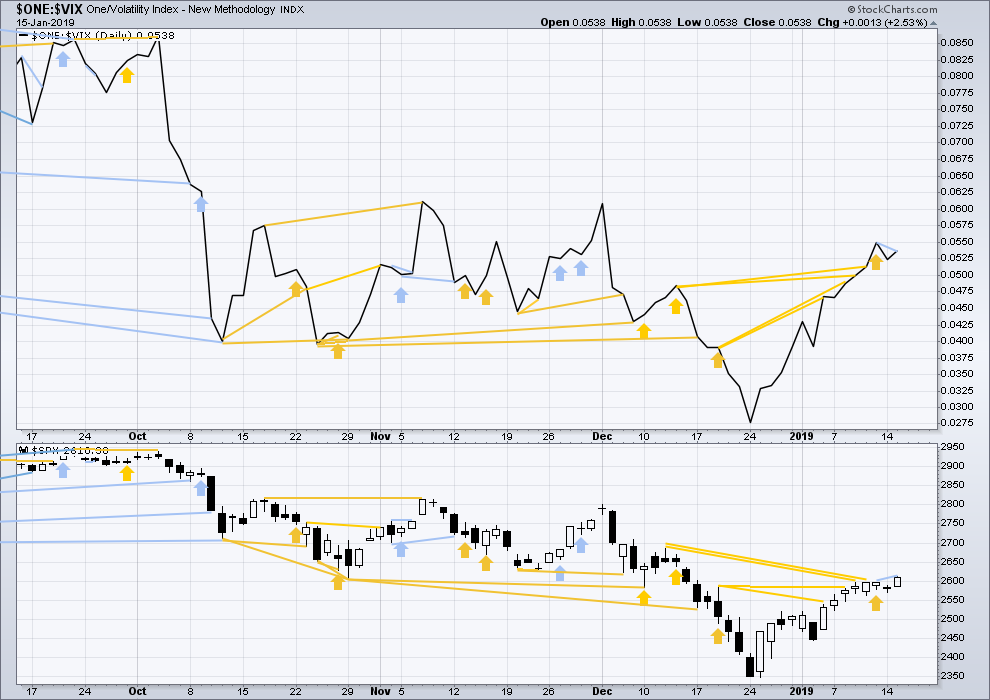
Click chart to enlarge. Chart courtesy of StockCharts.com. So that colour blind members are included, bearish signals
will be noted with blue and bullish signals with yellow.
There is now a cluster of bullish signals from inverted VIX. This supports the main Elliott wave count.
Today price has made a new high above the prior high of the 11th of January, but inverted VIX has not. This divergence is slight, but it is bearish.
DOW THEORY
Dow Theory confirms a bear market. This does not necessarily mean a bear market at Grand Super Cycle degree though; Dow Theory makes no comment on Elliott wave counts. On the 25th of August 2015 Dow Theory also confirmed a bear market. The Elliott wave count sees that as part of cycle wave II. After Dow Theory confirmation of a bear market in August 2015, price went on to make new all time highs and the bull market continued.
DJIA: 23,344.52 – a close on the 19th of December at 23,284.97 confirms a bear market.
DJT: 9,806.79 – price has closed below this point on the 13th of December.
S&P500: 2,532.69 – a close on the 19th of December at 2,506.96 provides support to a bear market conclusion.
Nasdaq: 6,630.67 – a close on the 19th of December at 6,618.86 provides support to a bear market conclusion.
Published @ 11:10 p.m. EST.
—
Careful risk management protects your trading account(s).
Follow my two Golden Rules:
1. Always trade with stops.
2. Risk only 1-5% of equity on any one trade.
Updated hourly chart:
The invalidation point may be moved up one degree.
Minor 5 is incomplete, so I’ll expect at least another two days of upwards movement here.
another triangle?
Hey Peter,
Trying to tune this in … SPX , right. What is your time frame and MA line period?
I’m seeing the same on ES today. I agree w/ Scott volume is acting triangularish.
this is a 5 min chart with 50 MA
Thx
Volume is getting pretty bad….
Is this what happens after continuous stock buy backs ?
Goldman Sachs releases Q4 numbers. Trading desk revenues fall 18% YOY. GS is gap up 7% from yesterday’s open.
I mention this because it’s very important to trader desk psychology. These guys are hyper aware of how things are going in their part of the world. GS Q4 earnings beat by over 41%. Larger bonus, no doom and gloom.
It’s like the saying; Do you know what the difference is between a recession and a depression? A Recession is when bad things happen to other people. A Depression is when bad things happen to me. The financial company results we are getting is like the reciprocal of this. “In some asset classes things are not good, but things are booming in our business, so, things can’t be that bad.”
I feel that trading desk psychology has turned positive.
There are ten possible cognitive biases (from a very long list) that may affect this idea. (In alphabetical order) They are:
1. Anchoring
2. Base rate fallacy
3. Bias blind spot
4. Confirmation bias
5. Conjunction fallacy
6. Illusion of validity
7. Illusory correlation
8. Optimism bias
9. Post-purchase rationalization
10. Selective perception
After examining these variables, I am comfortable with this theory. What do you think about this?
Bank of America Q4 numbers. Equity trading desk revenue shows up 11%. bofa stock is gap up about 9% from yesterday’s open.
Came across an interesting article that envisioned market leadership shifting from big tech to something else. I wonder if financials will assume that role?
Thought I might check in on this slow day. The picture is what happens to greedy traders! Lara, you can certainly remove this post if you find it too graphic.
That’s a nasty scar. Best of luck with rehab.
If anyone ever asks, blame it on a shark.
That’s actually a pretty clean scar considering its open shoulder surgery…
How are your PVC’s Rodney? Any better with the Magnesium?
yikes! I hope you got a nerve block…
Oh brother…I’m ROTFLMAO at your joke. But that right there is no joke. “Been there done that” (across my belly, 2x). Best of continued recoveries.
Dude, that is Badass!
wow!
I wish you all the best of luck with your recovery Rodney. Rest up well!
RUT popping. Next resistance 1460-66 due to to pivot lows from a month or two ago (white horizontal lines). After that…air space up to the next fibo levels.
NDX busting through it’s major down trend line on the daily.
Lots of fibo level’s a bit overhead, AND…it appears that the overall move up is now in wave v of a 5 wave move, looking at this daily chart. We know that SPX is in the same position.
So overall…watch out for a significant pivot high coming up in these markets in the new few days, and a significant (intermediate) set of 2 waves retracing a good chunk of this several weeks of rally.
Vix is going trough a bottoming process the last couple days …
Feb vix futures are priced lower than spot vix
Normally with that much time before expiration and that kind of inversion
It leads to a jump in vix futures
Selling vxx has gone hand in hand with moving the s and p up
When that is no longer possible
The moves up stall
Sold more Tesla nflx upside calls for Friday
sold some vxx 37 puts for Friday
Sold 262 calls for today in spy
Will keep layering in
Markets pulling back a little
This may be the last dip
Before there is one more push up
Then I’m full short …
The current tops are in dead space for the most part. A little bit less likely they will be major pivots. So far earnings results are strong. I think there’s more to go up before we see an intermediate 2 kick in.
I am playing for a top between 2627-2659
Selling upside calls and all options positions based on those marks short term
With intention if I don’t scoop the premium to be short the underlying in that area
My volatility spider sense is tingling
I thought there may be one more push from here
But that may have been the top around 2623
Still playing for that one more push before I commit to full shorts
NDX hasn’t continued pushing up and through…and there’s some significant risk the top here is in right at that trend line, and some kind of significant 2 (probably intermediate) is going to kick in here. A break below yesterday’s (Tuesday’s) low would seal the deal in my book.
This little move back to the 2625 range is feeling like the last push
How far it goes ?
But for an up day…. the volume is terrible
Maybe a final attempt to gap tomorrow … but it doesn’t seem like they can do it (ignite buying )during cash session
The destruction of the vix and vix futures… specifically Jan vix futures that expire today … was quite the piece of work…
Seen the long vol trade be such a losing proposition except for very small timeframes over the last decade..
But this one was the best crushing of vol I have seen in quite a while…
Interesting observation!