
Analysis has expected upwards movement, which has continued all week.
Today’s analysis looks at measures of internal strength of the market to determine if this bounce should continue or if it could be complete.
Summary: For the short term, now expect more upwards movement as most likely. This may be the dominant view while price remains above 2,562.02.
A new low below 2,562.02 would indicate a deeper pullback may continue towards 2,537.50.
The bigger picture still expects that a low may now be in place. Confidence in this view may be had if price makes a new high above 2,631.09. The target is at 3,045 with a limit at 3,477.39. This primary view has support from strongly rising market breadth and a 90% up day on the 4th of January.
The alternate wave count expects one more low before cycle wave IV is complete. Targets are either 2,269 or 2,242 – 2,240, although when intermediate wave (4) may be complete the target would be recalculated.
New updates to this analysis are in bold.
The biggest picture, Grand Super Cycle analysis, is here.
The monthly chart was last published here.
MAIN ELLIOTT WAVE COUNT
WEEKLY CHART
Click chart to enlarge.
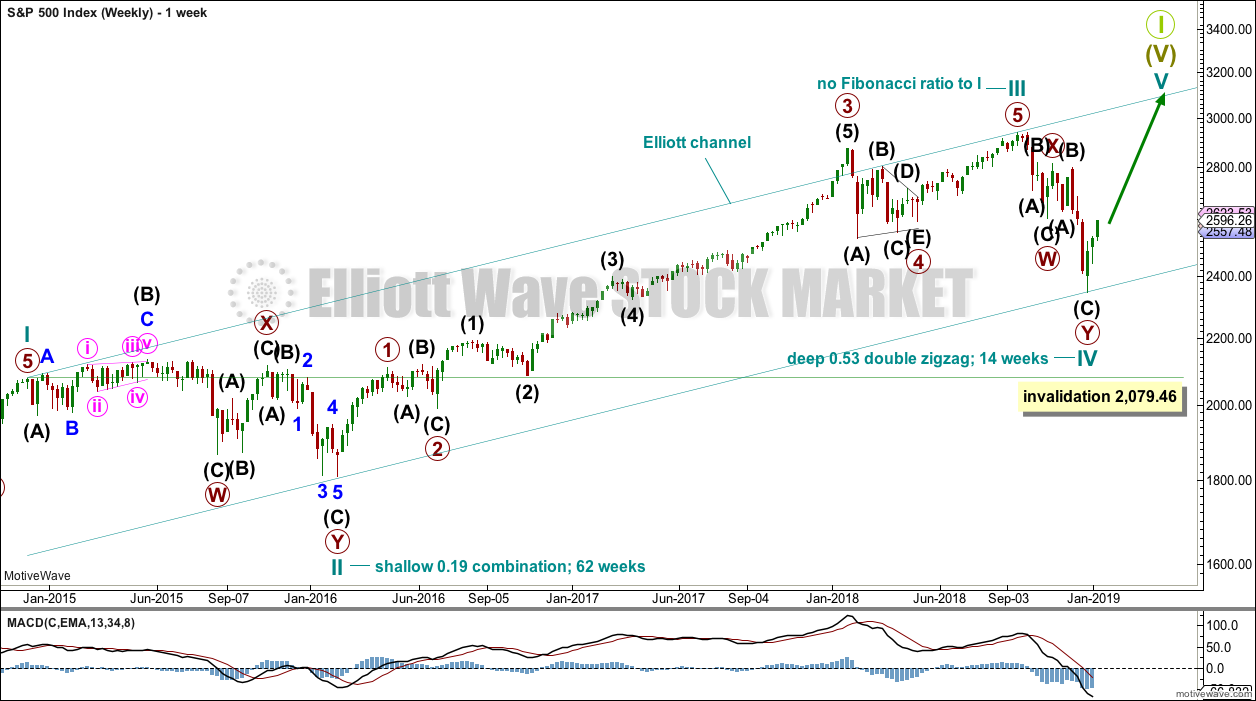
This weekly chart shows all of cycle waves II, III and IV so far.
Cycle wave II fits as a time consuming double combination: flat – X – zigzag. Combinations tend to be more time consuming corrective structures than zigzags. If cycle wave IV completes as a single or multiple zigzag, then it should be expected to be more brief than cycle wave II.
Cycle wave IV may have ended at the lower edge of the Elliott channel. Fourth waves are not always contained within Elliott channels. If the alternate daily wave count below is correct, then cycle wave IV may breach this channel.
Cycle wave IV may not move into cycle wave I price territory below 2,079.46.
Although both cycle waves II and IV are labelled W-X-Y, they are different corrective structures. There are two broad groups of Elliott wave corrective structures: the zigzag family, which are sharp corrections, and all the rest, which are sideways corrections. Multiple zigzags belong to the zigzag family and combinations belong to the sideways family. There is perfect alternation between the possible double zigzag of cycle wave IV and the combination of cycle wave II.
Although there is gross disproportion between the duration of cycle waves II and IV, the size of cycle wave IV in terms of price makes these two corrections look like they should be labelled at the same degree. Proportion is a function of either or both of price and time.
Draw the Elliott channel about Super Cycle wave (V) as shown. Cycle wave V may find resistance about the upper edge.
DAILY CHART
Click chart to enlarge.
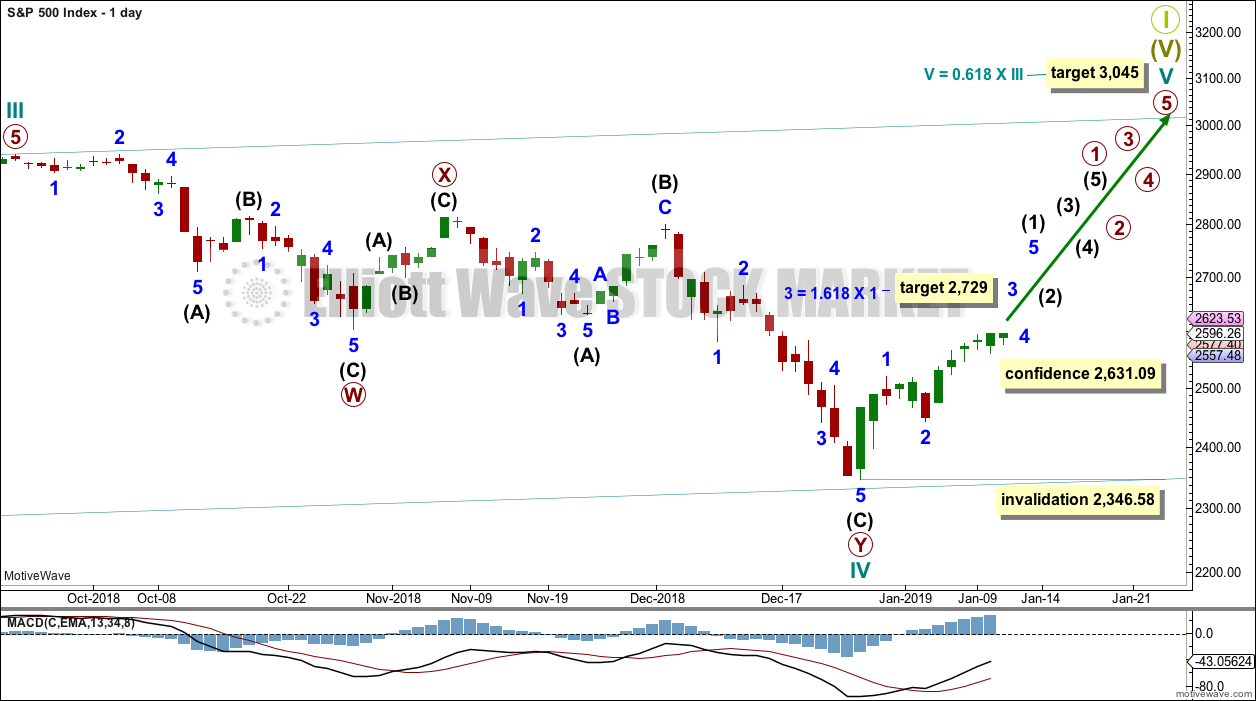
The daily chart will focus on the structure of cycle wave IV.
Cycle wave IV may be a complete double zigzag. This would provide perfect alternation with the combination of cycle wave II. Double zigzags are fairly common corrective structures.
Within Super Cycle wave (V), cycle wave III may not be the shortest actionary wave. Because cycle wave III is shorter than cycle wave I, this limits cycle wave V to no longer than equality in length with cycle wave III at 3,477.39. A target is calculated for cycle wave V to end prior to this point.
Cycle wave V must subdivide as a five wave motive structure, either an impulse or an ending diagonal. An impulse is much more common and that will be how it is labelled. A diagonal would be considered if overlapping suggests it.
Within the five wave structure for cycle wave V, primary wave 1 would be incomplete. Within primary wave 1, intermediate wave (1) may be incomplete. The degree of labelling within cycle wave V may need to be adjusted as it unfolds further.
Within cycle wave V, no second wave correction may move beyond the start of its first wave below 2,346.58.
At this stage, a new high by any amount at any time frame above 2,631.09 would invalidate the alternate wave count below and provide confidence in this main wave count.
HOURLY CHART
Click chart to enlarge.
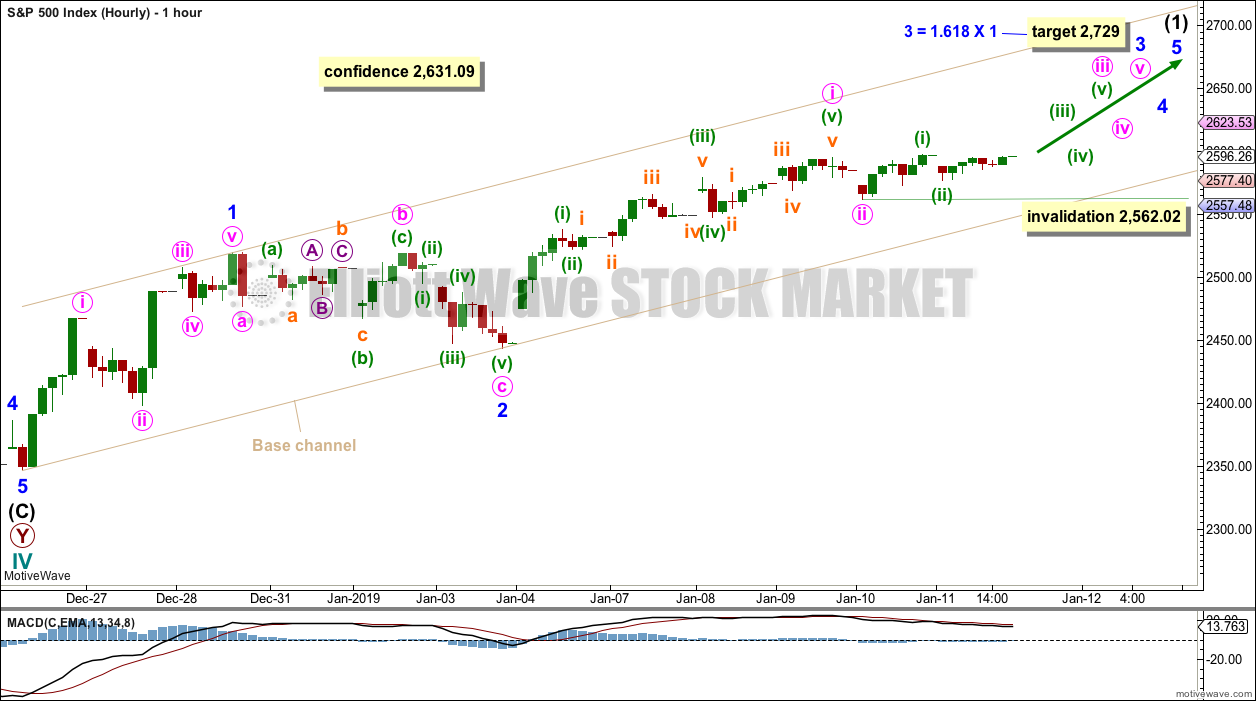
Intermediate wave (1) may be incomplete and may be unfolding as an impulse.
Within the impulse, minor waves 1 and 2 may now be complete. A target is calculated for minor wave 3 which expects the most common Fibonacci ratio to minor wave 1.
Minor wave 3 may only subdivide as an impulse.
Within minor wave 3, minute waves i and ii may be complete. Within minute wave iii, minuette waves (i) and (ii) may now be complete. This wave count now expects to see an increase in upwards momentum as the middle of a third wave unfolds higher.
SECOND HOURLY CHART
Click chart to enlarge.
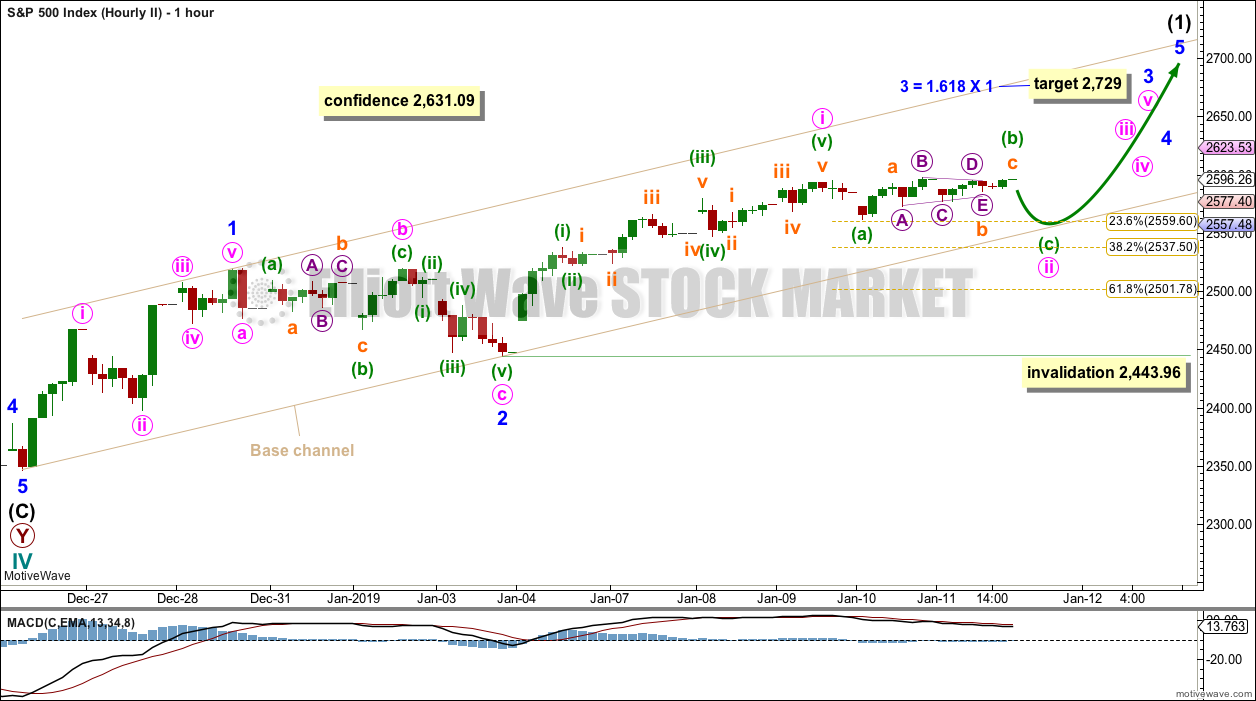
This wave count is possible but has slightly less support today from classic technical analysis.
It is possible that minute wave ii is an incomplete expanded flat correction. Within minute wave ii, minuette wave (b) is 1.12 the length of minuette wave (a). Minuette wave (c) may end about the 0.382 Fibonacci ratio, and about support at the lower edge of the base channel.
Minute wave ii may not move beyond the start of minute wave i below 2,443.96.
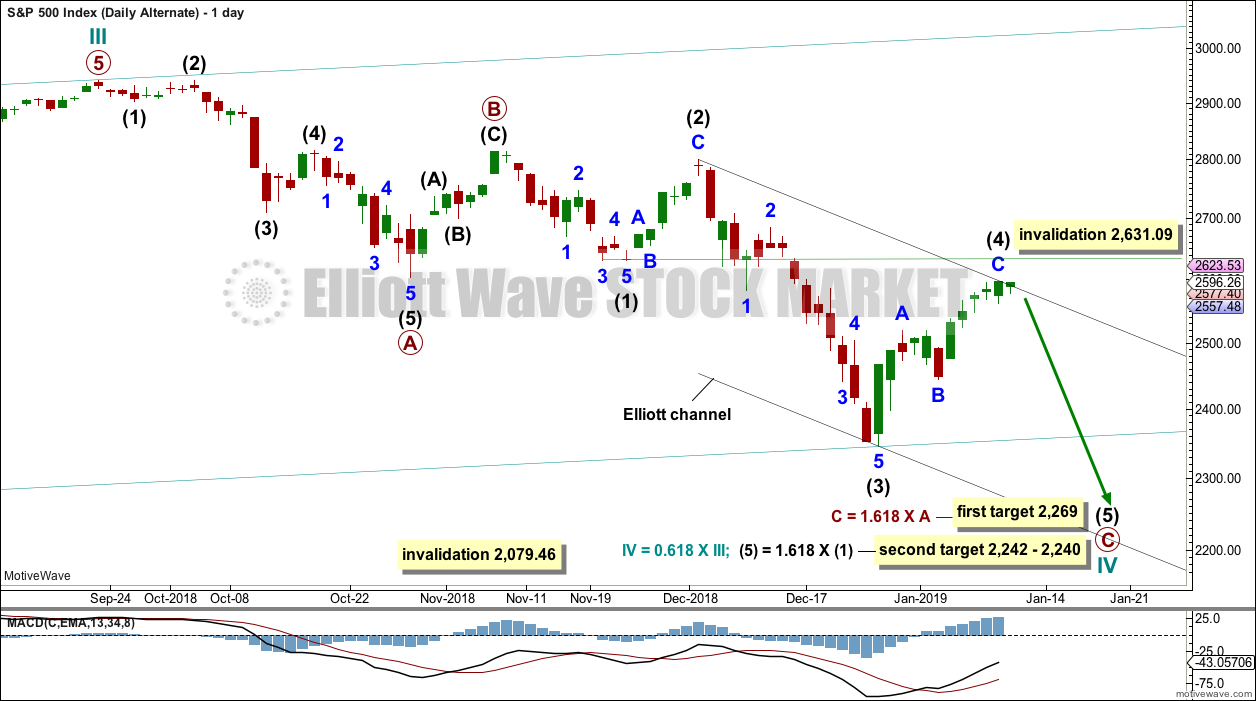
ALTERNATE DAILY CHART
Click chart to enlarge.
Cycle wave IV may be a an incomplete single zigzag. This would provide perfect alternation with the combination of cycle wave II. Zigzags are the most common corrective structures.
Within this zigzag, primary wave C may be completing as a five wave impulse.
Intermediate wave (2) shows up on the weekly and daily charts. Intermediate wave (4) now also shows on weekly and daily charts. This wave count has the right look.
Intermediate wave (4) may not move into intermediate wave (1) price territory above 2,631.09.
Targets are calculated for cycle wave IV to end. If price gets to the first target and the structure is incomplete, or if price falls through the first target, then the second target may be used.
Redraw the channel about primary wave C using Elliott’s second technique. Draw the first trend line from the high of intermediate wave (2) to the high of intermediate wave (4), then place a parallel copy on the low of intermediate wave (3). If intermediate wave (4) continues higher, then redraw the channel using the same technique. The lower edge may then provide support for intermediate wave (5).
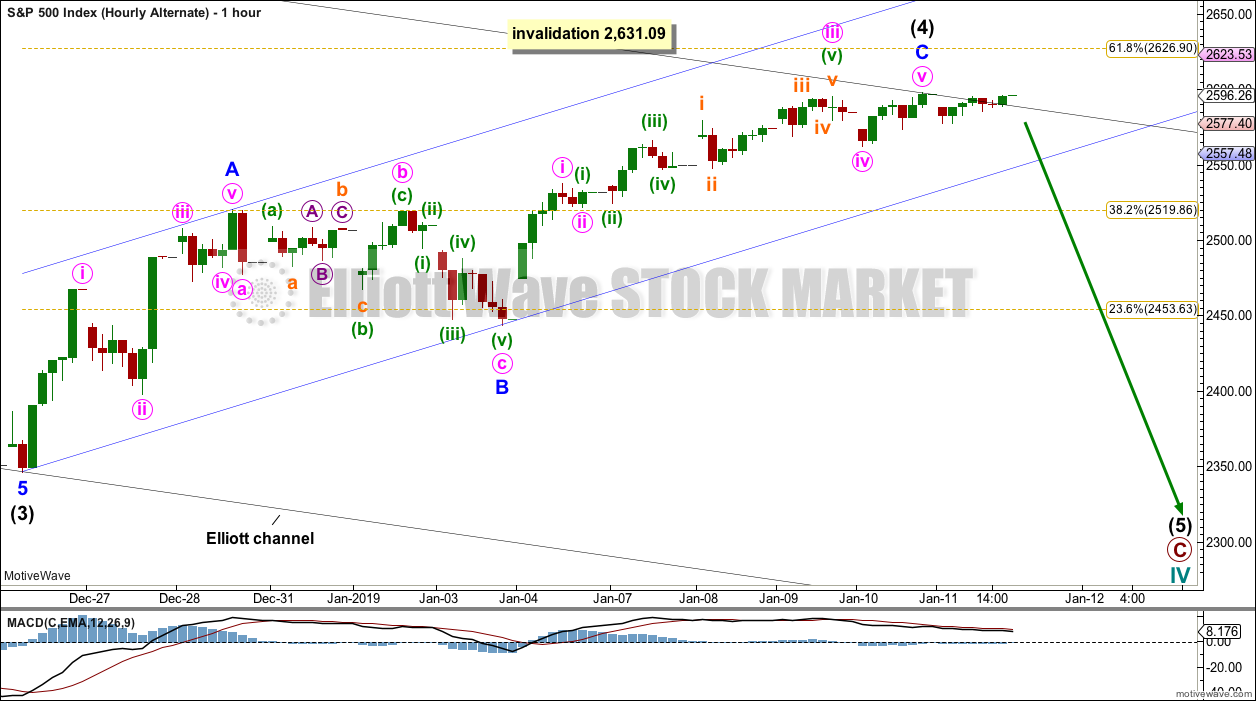
ALTERNATE HOURLY CHART
Click chart to enlarge.
Intermediate wave (4) may be a complete zigzag. A trend change would be expected for this alternate wave count down to the targets given on the daily chart.
A channel is drawn using Elliott’s technique about the zigzag of intermediate wave (4). If this channel is breached by downwards movement, then that would be the first indication that this alternate wave count may be correct and the main wave count may be wrong.
Although minute wave v looks like a three wave structure on the hourly chart, on the five minute chart it fits well as an ending contracting diagonal.
TECHNICAL ANALYSIS
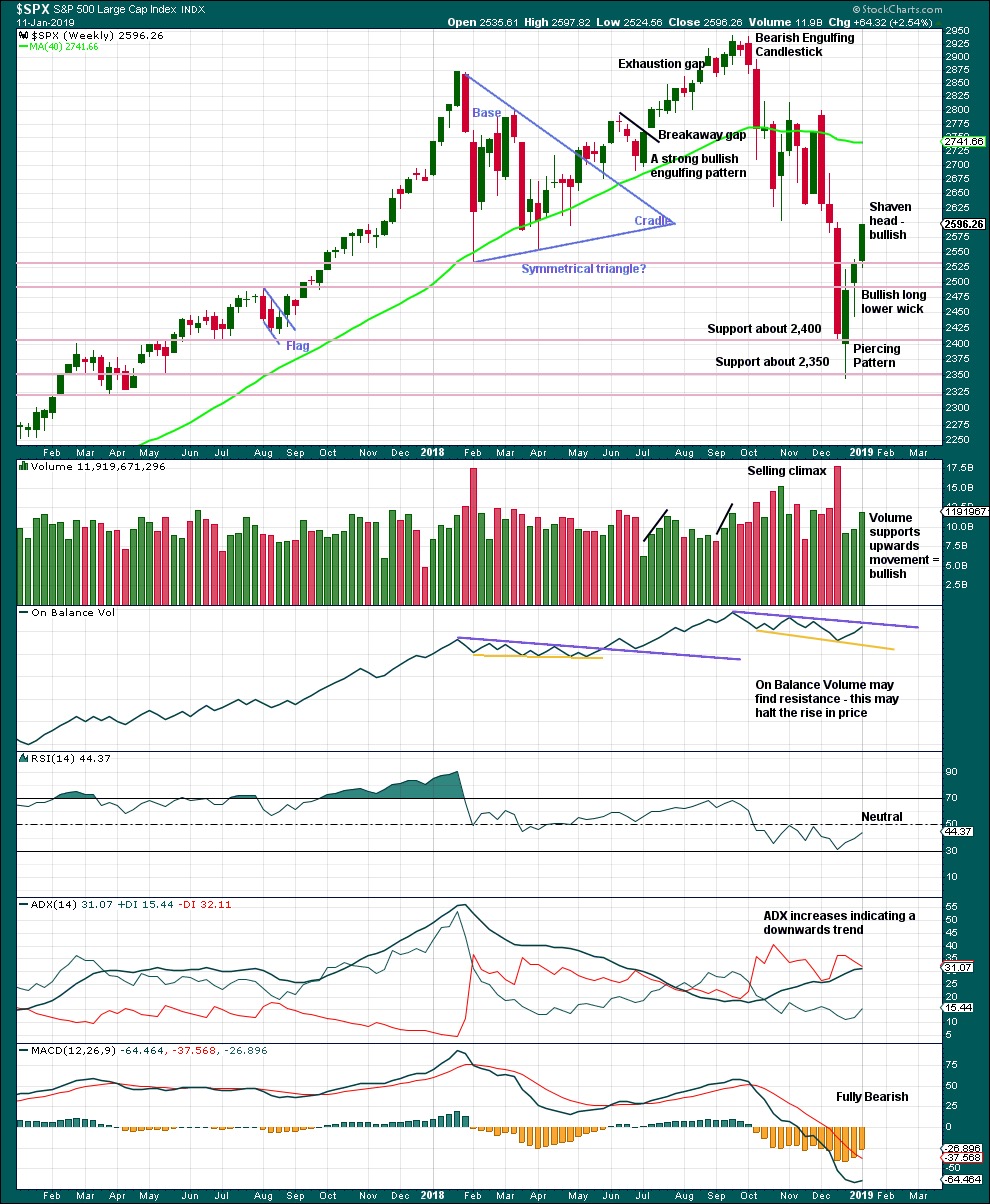
WEEKLY CHART
Click chart to enlarge. Chart courtesy of et=”_blank”>StockCharts.com.
From the all time high to the low of last week, price moved lower by 20.2% of market value meeting the definition for a bear market.
It should be noted that the large fall in price from May 2011 to October 2011 also met this definition of a bear market, yet it was only a very large pullback within a bull market, which so far has lasted almost 10 years.
This weekly candlestick with a shaven head and good support from volume strongly suggests more upwards movement next week.
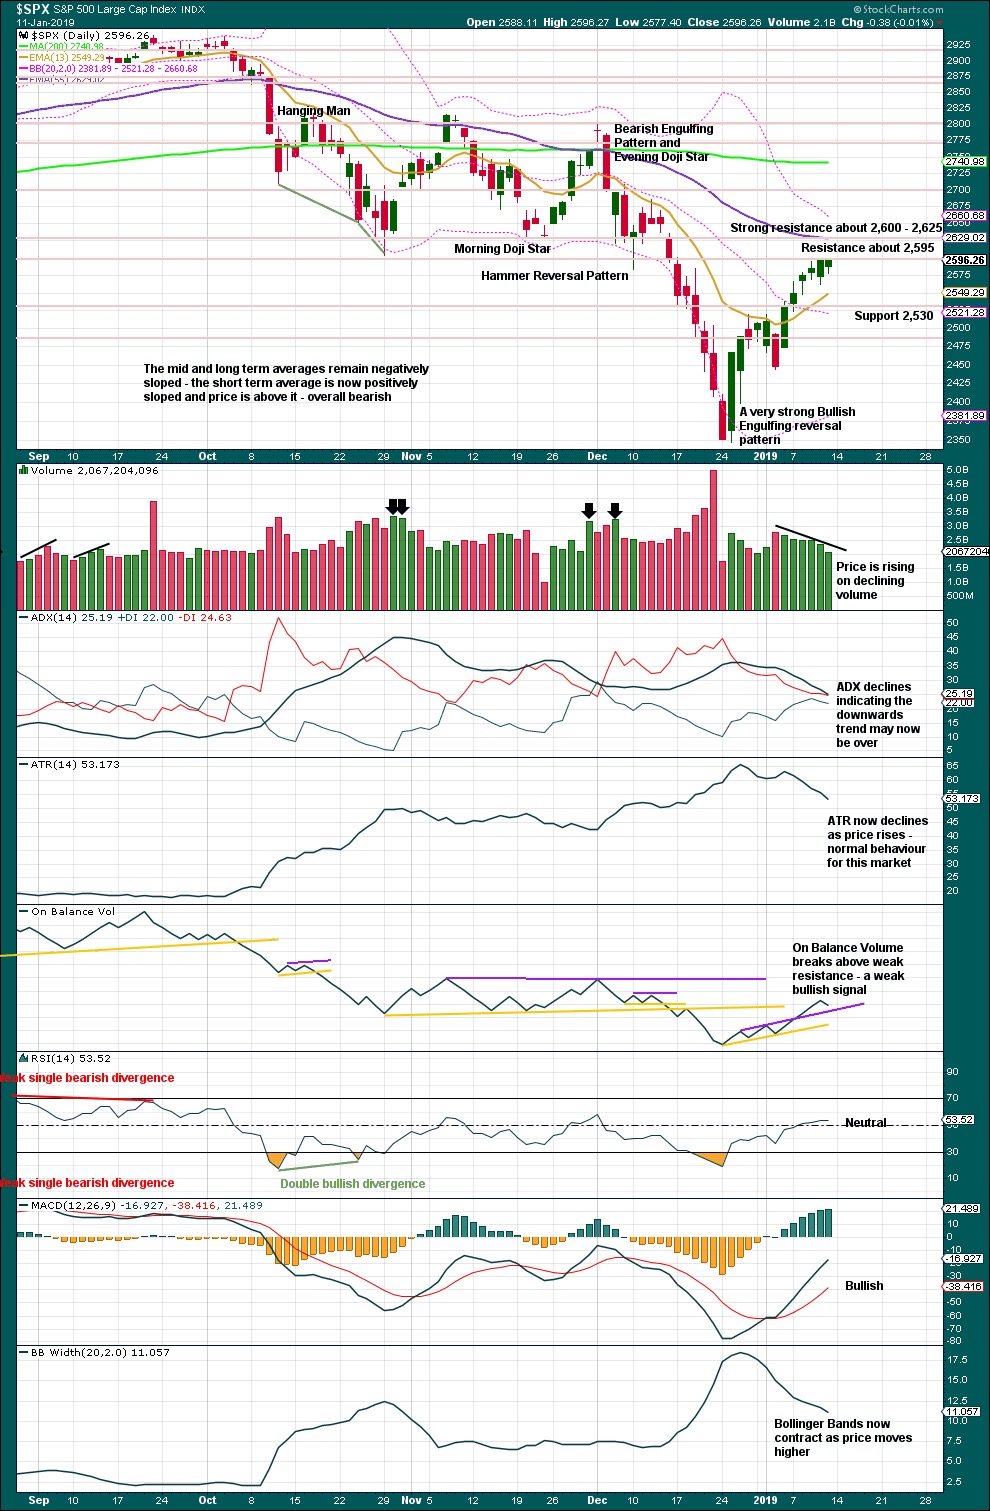
DAILY CHART
Click chart to enlarge. Chart courtesy of StockCharts.com.
Over a fairly long period of time this ageing bull market has been characterised by upwards movement on light and declining volume and low ATR. For the short to mid term, little concern may be had if price now rises again on declining volume. Current market conditions have allowed for this during a sustained rise in price.
It is also normal for this market to have lower ATR during bullish phases, and strongly increasing ATR during bearish phases. Currently, declining ATR is normal and not of a concern.
Considering the larger picture from the Elliott wave count, some weakness approaching the end of Grand Super Cycle wave I is to be expected.
From Kirkpatrick and Dhalquist, “Technical Analysis” page 152:
“A 90% downside day occurs when on a particular day, the percentage of downside volume exceeds the total of upside and downside volume by 90% and the percentage of downside points exceeds the total of gained points and lost points by 90%. A 90% upside day occurs when both the upside volume and points gained are 90% of their respective totals”…
and “A major reversal is singled when an NPDD is followed by a 90% upside day or two 80% upside days back-to-back”.
The current situation saw two 80% downside days on December 20th and 21st, then a near 90% downside day with 88.97% downside on December 24th. This very heavy selling pressure on three sessions very close together may be sufficient to exhibit the pressure observed in a 90% downside day.
This has now been followed by two 90% upside days: on December 26th and again on 4th January.
The current situation looks very much like a major low has been found.
BREADTH – AD LINE
WEEKLY CHART
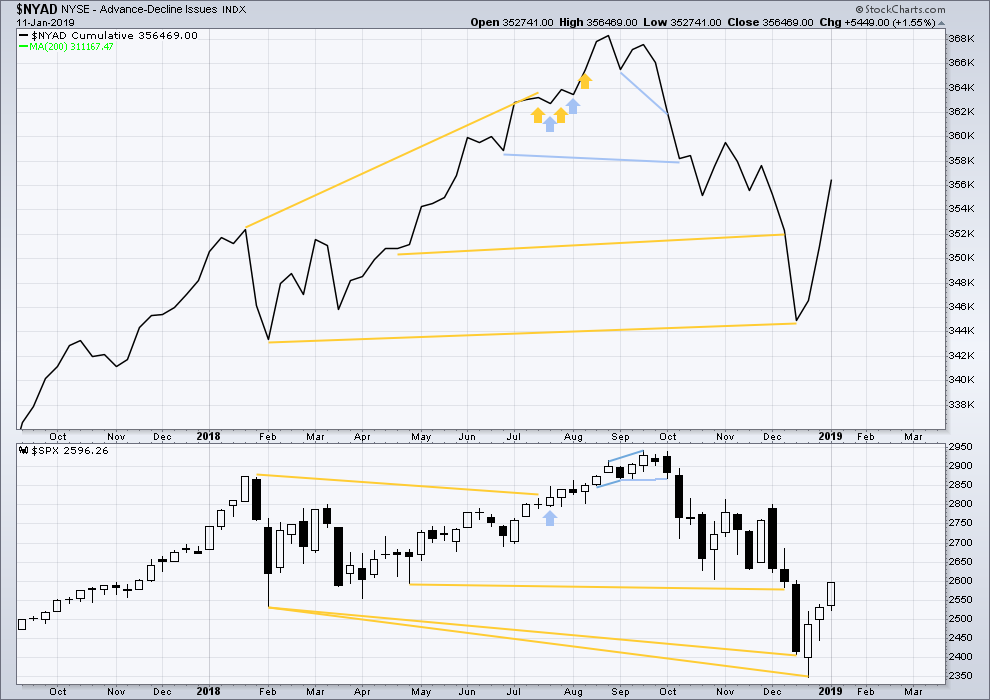
Click chart to enlarge. Chart courtesy of StockCharts.com. So that colour blind members are included, bearish signals
will be noted with blue and bullish signals with yellow.
Upwards movement has support from rising market breadth.
DAILY CHART
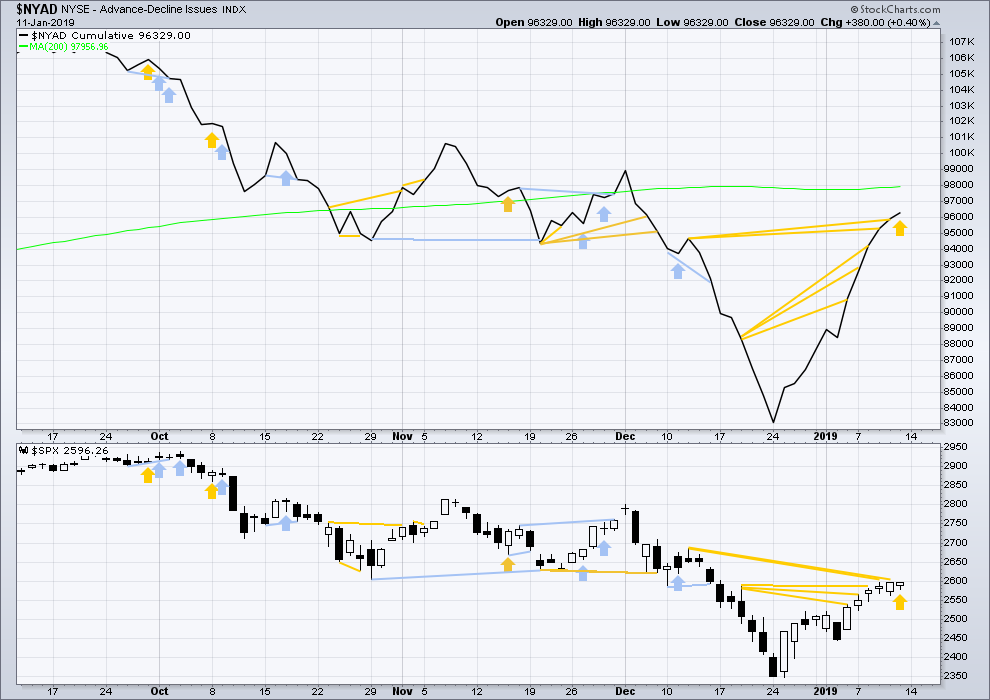
Click chart to enlarge. Chart courtesy of StockCharts.com. So that colour blind members are included, bearish signals
will be noted with blue and bullish signals with yellow.
Breadth should be read as a leading indicator.
Bullish divergence continues on Friday. The AD line has moved higher although price did not quite make a new high. The AD line is rising faster than price. This upwards movement has support from underlying rising market breadth.
Both mid and small caps have made new highs on Friday.
VOLATILITY – INVERTED VIX CHART
WEEKLY CHART
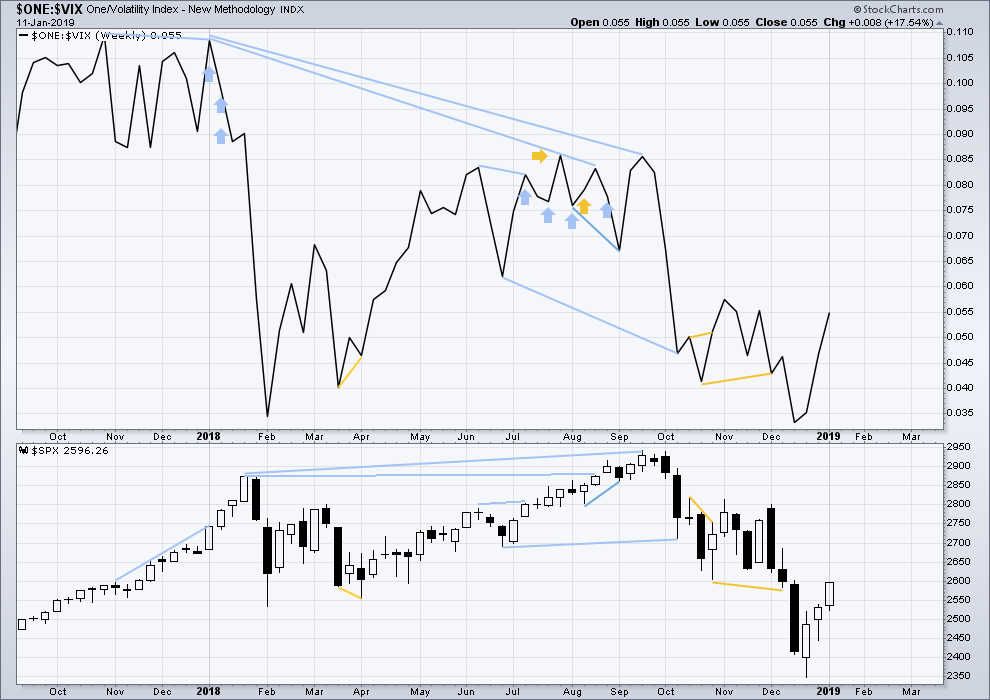
Click chart to enlarge. Chart courtesy of StockCharts.com. So that colour blind members are included, bearish signals
will be noted with blue and bullish signals with yellow.
Upwards movement has support from a corresponding decline in VIX. There is no divergence.
DAILY CHART
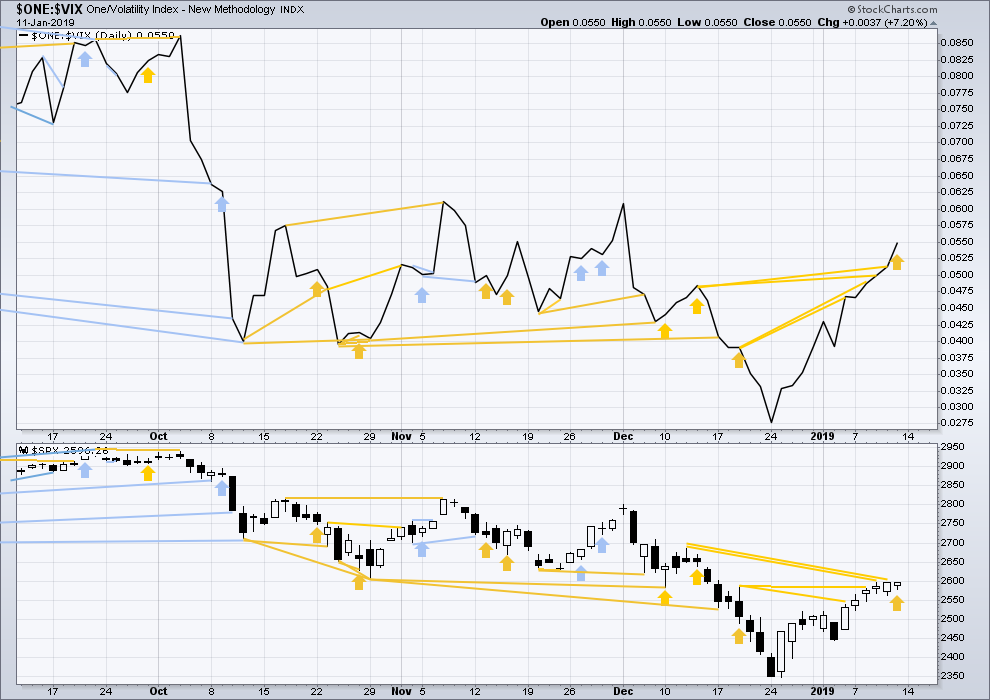
Click chart to enlarge. Chart courtesy of StockCharts.com. So that colour blind members are included, bearish signals
will be noted with blue and bullish signals with yellow.
Inverted VIX moved strongly higher on Friday, but price did not quite make a new high. This is another instance of bullish divergence; volatility is declining faster than price is rising.
DOW THEORY
Dow Theory confirms a bear market. This does not necessarily mean a bear market at Grand Super Cycle degree though; Dow Theory makes no comment on Elliott wave counts. On the 25th of August 2015 Dow Theory also confirmed a bear market. The Elliott wave count sees that as part of cycle wave II. After Dow Theory confirmation of a bear market in August 2015, price went on to make new all time highs and the bull market continued.
DJIA: 23,344.52 – a close on the 19th of December at 23,284.97 confirms a bear market.
DJT: 9,806.79 – price has closed below this point on the 13th of December.
S&P500: 2,532.69 – a close on the 19th of December at 2,506.96 provides support to a bear market conclusion.
Nasdaq: 6,630.67 – a close on the 19th of December at 6,618.86 provides support to a bear market conclusion.
Published @ 10:53 p.m. EST.
—
Careful risk management protects your trading account(s).
Follow my two Golden Rules:
1. Always trade with stops.
2. Risk only 1-5% of equity on any one trade.
Here is a pretty picture of the Bull run. I am very jazzed about Lara’s Teal V target of 3,045 that is shown on her daily chart (above). It makes complete sense to me and fits the bull run narritive nicely.
PS — my chart is drawn using linear scaling
narrative not narritive
here is the pretty picture in log scaling
rising wedge
Good morning everybody.
I’m changing the second hourly to see minor 3 over and a possible triangle for minor 4. This makes more sense in light of the last three sideways sessions.
That means minor 3 is shorter than minor 1. Third waves may not be the shortest actionary waves within impulses. For this core rule to be met minor 5 would be limited to no longer than 151.36 points.
I’m packing up my computer now and I’m on the road. Your analysis may be quite late today, and there is a chance that after a big house move I may be too exhausted to do a full analysis.
If that is the case I may update daily Elliott wave and technical charts here in comments. So you’ll still get analysis, it may only be more brief today.
Tomorrow, back to normal.
Wow… No Volume… No One around! All of Wall Street partying with the Democrats in Puerto Rico!
I suspect it’s the big money waiting to see which direction this market is going to go. Hourly TF squeezes on each on SPX, NDX and RUT, some now several days and counting. At some point there’s going to be a fast and hard move out of this congestion. Right now the hourly trend across all three indexes is down.
Nothing about this action today so far looks consistent with the hourly main. Consistent with the alternate hourly for the main, or the alternate daily. Meaning, some significant down just ahead…at least. We’ll see.
SPX is now in in hour 9 of a squeeze at the hourly time frame. With price action that looks very much like “churning at a top”. Which just happens to be right at key pivot resistance (10/29 low) and a major roundie (2600). Now a gap down open and real hesitance to fill the gap. The evidence is slowing growing in my book that a bit of selling may be right around the corner.
The last 4 sessions have started with gaps, gap up the first 2 days, gap downs the last 2 days… all of which have been filled within the first 2 hours after open. Today so far, it looks like the upwards momentum to fill the gap down is fading… Will be interesting how this plays out…
The gap will be filled at some point for sure, the question is when…
Hi everybody. I have to move house tomorrow, and it’s a big move, a 4.5 hour drive.
I will be doing my absolute best to get your analysis published as soon as I can, but if it is late then it will be because I’m on the road.
I thank you all very much for your patience and understanding.
You’re certainly allowed to have a life Lara. Speaking for myself, If I were you, it would be okay to skip a day.
Moving day is stressful enough without having this stuff hanging over your head. Incorporate your analysis into Tuesday’s evaluation.
… a 4 1/2 hour drive assuming everything goes right. Seriously, take a day off.
Hope it all goes smoothly!
At the very least I’ll be able to provide updated charts.
We shall see, how much time I have tomorrow. But I’ll certainly have time in the morning while my house is quiet to look at charts and go through my process.
I agree with chartmonkey, take a day or two off.
Friday’s ES big picture chart
The weekly chart show something rather interesting.
The price action since the Dec low is extremely similar to the price action immediately following the cycle II low around Feb of ’16. Though to be fair, it also mirrors the B of the X wave in 2015, the led shortly thereafter to a whopper of Y down. I guess the next 2-3 weeks will inform us a lot about what to expect over the rest of Q1.
Looking for a couple of down days before more upside.
2 Q’s Timo,
Why are you looking for the down days?
Would you trust a gap up that takes us higher?
Hey chartmonkey
I was looking for a retrace of the abc up from christmas. It looked like its momentum was spent. I would not b surprised by a gap up after retrace.
Timo