
Again, upwards movement has continued as expected for the main Elliott wave count.
Today a candlestick pattern suggests the direction for price tomorrow.
Summary: A low may now be in place. Confidence in this view may be had if price makes a new high above 2,631.09. The target is at 3,045 with a limit at 3,477.39. This primary view has support from strongly rising market breadth and a 90% up day on the 4th of January.
The alternate wave count expects one more low before cycle wave IV is complete. Targets are either 2,269 or 2,242 – 2,240, although when intermediate wave (4) may be complete the target would be recalculated.
New updates to this analysis are in bold.
The biggest picture, Grand Super Cycle analysis, is here.
The monthly chart was last published here.
MAIN ELLIOTT WAVE COUNT
WEEKLY CHART
Click chart to enlarge.
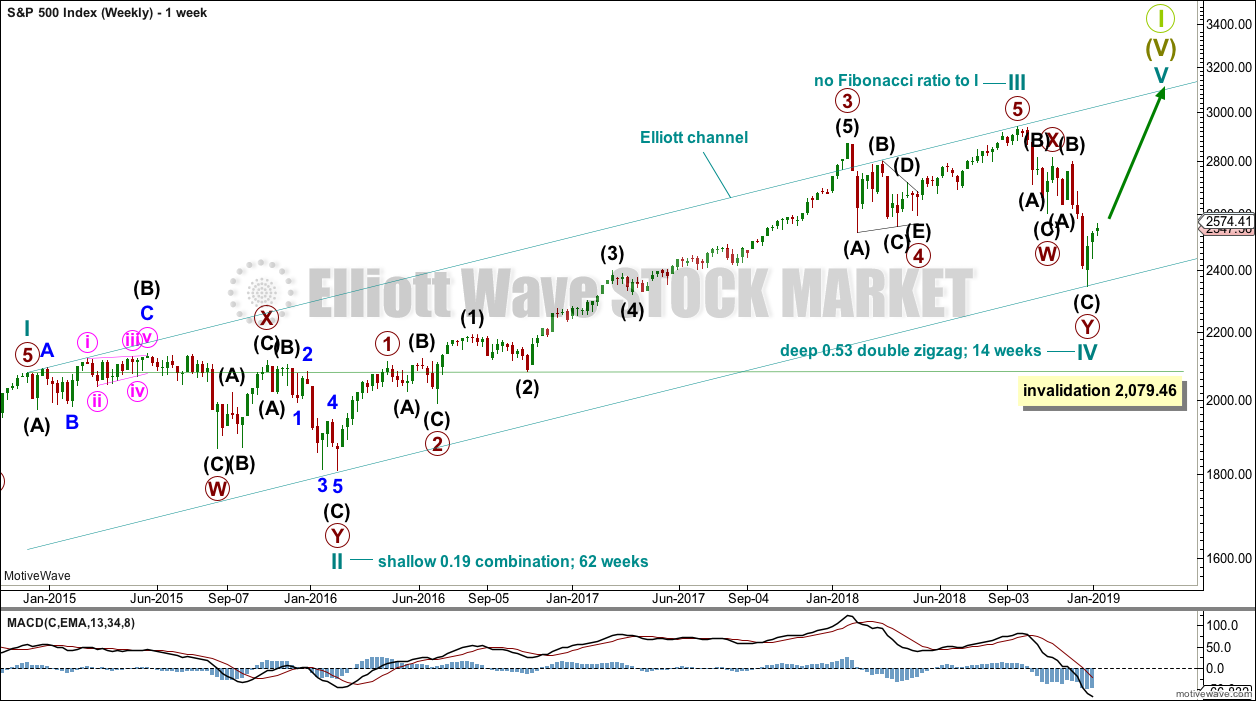
This weekly chart shows all of cycle waves II, III and IV so far.
Cycle wave II fits as a time consuming double combination: flat – X – zigzag. Combinations tend to be more time consuming corrective structures than zigzags. If cycle wave IV completes as a single or multiple zigzag, then it should be expected to be more brief than cycle wave II.
Cycle wave IV may have ended at the lower edge of the Elliott channel. Fourth waves are not always contained within Elliott channels. If the alternate daily wave count below is correct, then cycle wave IV may breach this channel.
Cycle wave IV may not move into cycle wave I price territory below 2,079.46.
Although both cycle waves II and IV are labelled W-X-Y, they are different corrective structures. There are two broad groups of Elliott wave corrective structures: the zigzag family, which are sharp corrections, and all the rest, which are sideways corrections. Multiple zigzags belong to the zigzag family and combinations belong to the sideways family. There is perfect alternation between the possible double zigzag of cycle wave IV and the combination of cycle wave II.
Although there is gross disproportion between the duration of cycle waves II and IV, the size of cycle wave IV in terms of price makes these two corrections look like they should be labelled at the same degree. Proportion is a function of either or both of price and time.
Draw the Elliott channel about Super Cycle wave (V) as shown. Cycle wave V may find resistance about the upper edge.
DAILY CHART
Click chart to enlarge.
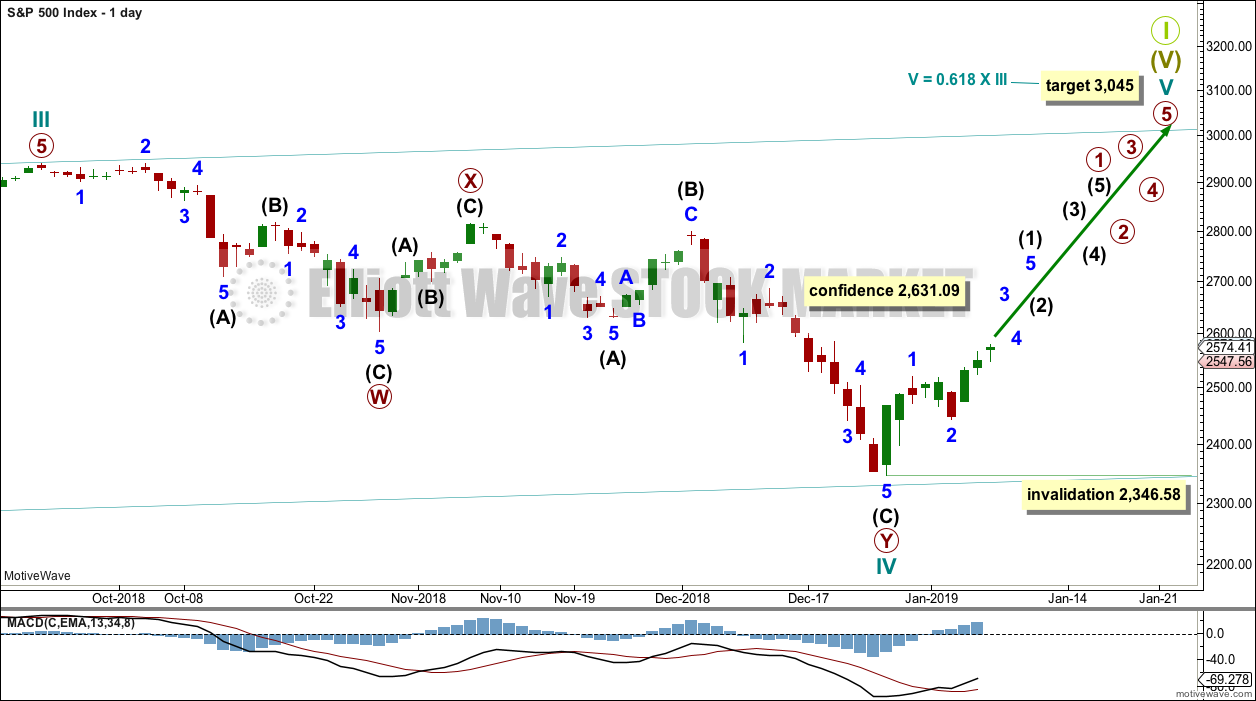
The daily chart will focus on the structure of cycle wave IV.
Cycle wave IV may be a complete double zigzag. This would provide perfect alternation with the combination of cycle wave II. Double zigzags are fairly common corrective structures.
Within Super Cycle wave (V), cycle wave III may not be the shortest actionary wave. Because cycle wave III is shorter than cycle wave I, this limits cycle wave V to no longer than equality in length with cycle wave III at 3,477.39. A target is calculated for cycle wave V to end prior to this point.
Cycle wave V must subdivide as a five wave motive structure, either an impulse or an ending diagonal. An impulse is much more common and that will be how it is labelled. A diagonal would be considered if overlapping suggests it.
Within the five wave structure for cycle wave V, primary wave 1 would be incomplete. Within primary wave 1, intermediate wave (1) may be incomplete. The degree of labelling within cycle wave V may need to be adjusted as it unfolds further.
Within cycle wave V, no second wave correction may move beyond the start of its first wave below 2,346.58.
At this stage, a new high by any amount at any time frame above 2,631.09 would invalidate the alternate wave count below and provide confidence in this main wave count.
FIRST HOURLY CHART
Click chart to enlarge.
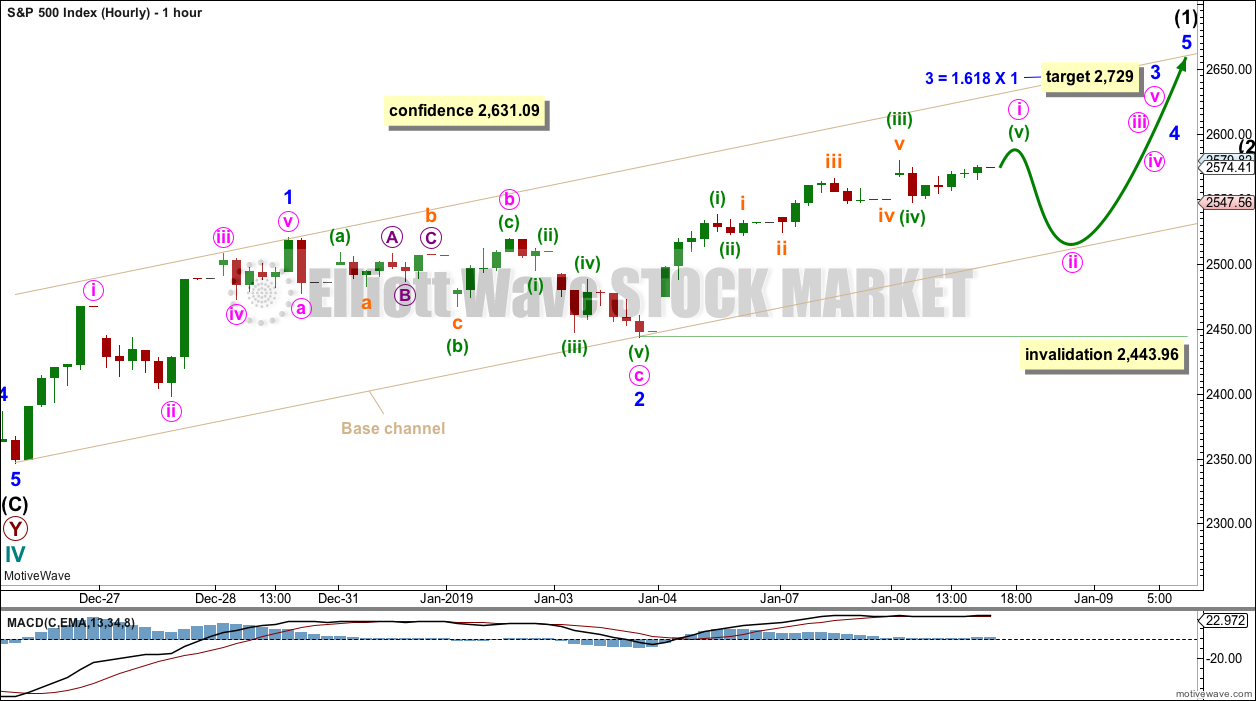
Intermediate wave (1) may be incomplete and may be unfolding as an impulse.
Within the impulse, minor waves 1 and 2 may now be complete. A target is calculated for minor wave 3 which expects the most common Fibonacci ratio to minor wave 1.
Minor wave 3 may only subdivide as an impulse.
Two hourly charts are provided today which label minor wave 3 in two different ways. This first hourly chart sees minute wave i as almost complete. As soon as minuette wave (v) makes a new high above the high of minuette wave (iii) at 2,579.82, then a truncation would be avoided and minute wave iii may be complete.
Thereafter, minute wave ii may unfold lower over one to three sessions. It may find support at the lower edge of the base channel.
Minute wave ii may not move beyond the start of minute wave i below 2,443.96.
Draw a base channel about minor waves 1 and 2 as shown. The lower edge of this channel may provide support.
SECOND HOURLY CHART
Click chart to enlarge.
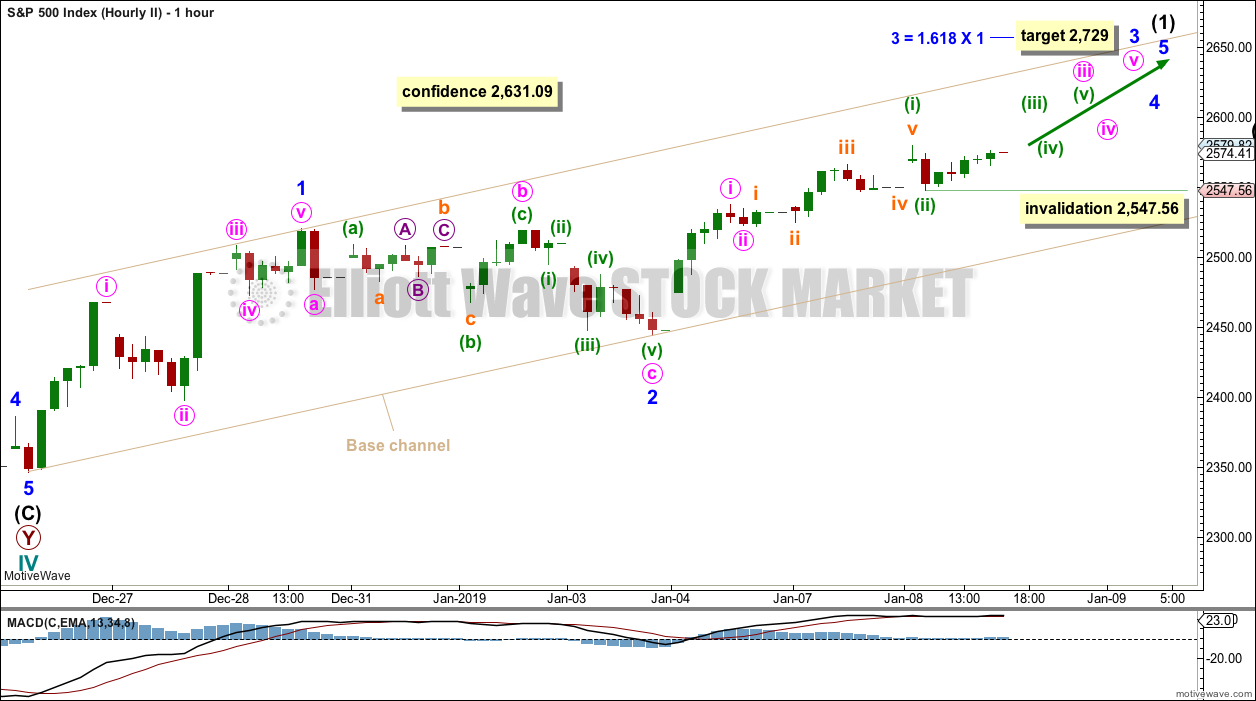
This second hourly chart labels minor wave 3 differently.
Within minor wave 3, minute waves i and ii may be complete.
Within minute wave iii, minuette waves (i) and (ii) may be complete.
This wave count now expects to see an increase in upwards momentum tomorrow as the middle of a third wave unfolds upwards.
Within minuette wave (iii), no second wave correction may move beyond the start of its first wave below 2,547.56.
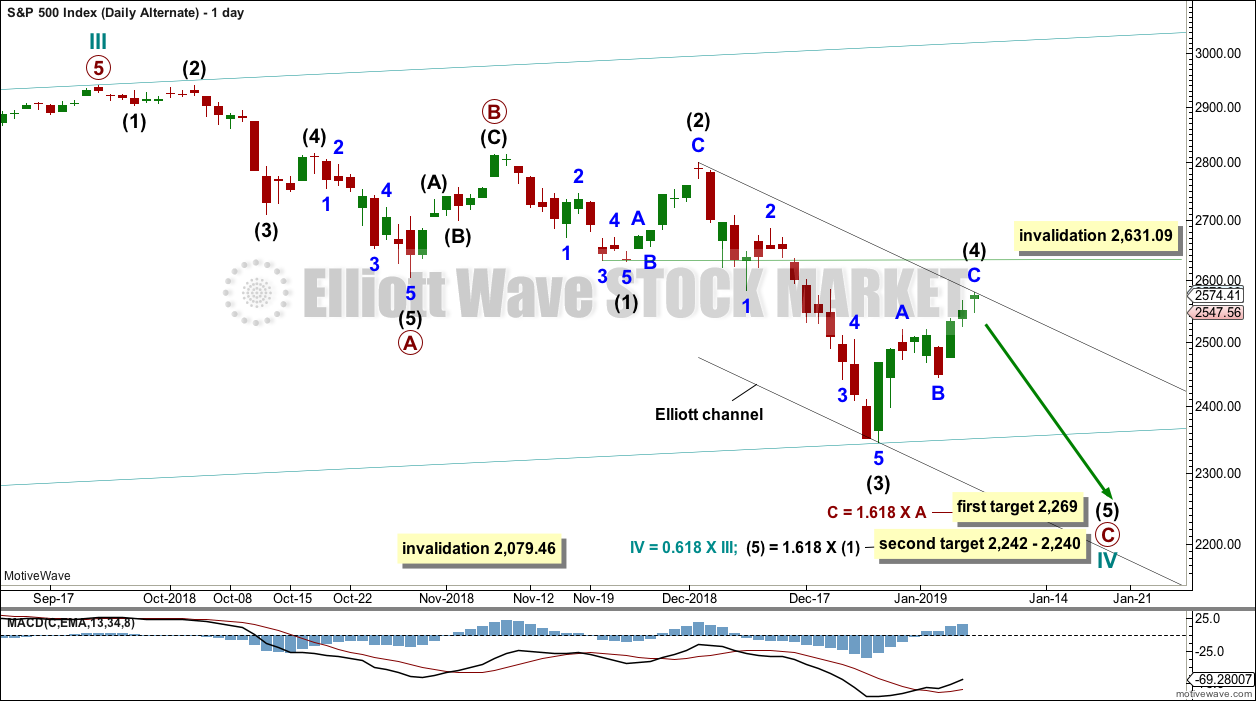
ALTERNATE DAILY CHART
Click chart to enlarge.
Cycle wave IV may be a an incomplete single zigzag. This would provide perfect alternation with the combination of cycle wave II. Zigzags are the most common corrective structures.
Within this zigzag, primary wave C may be completing as a five wave impulse.
Intermediate wave (2) shows up on the weekly and daily charts. Intermediate wave (4) now also shows on weekly and daily charts. This wave count has the right look.
Intermediate wave (4) may not move into intermediate wave (1) price territory above 2,631.09.
Targets are calculated for cycle wave IV to end. If price gets to the first target and the structure is incomplete, or if price falls through the first target, then the second target may be used.
Redraw the channel about primary wave C using Elliott’s second technique. Draw the first trend line from the high of intermediate wave (2) to the high of intermediate wave (4), then place a parallel copy on the low of intermediate wave (3). If intermediate wave (4) continues higher, then redraw the channel using the same technique. The lower edge may then provide support for intermediate wave (5).
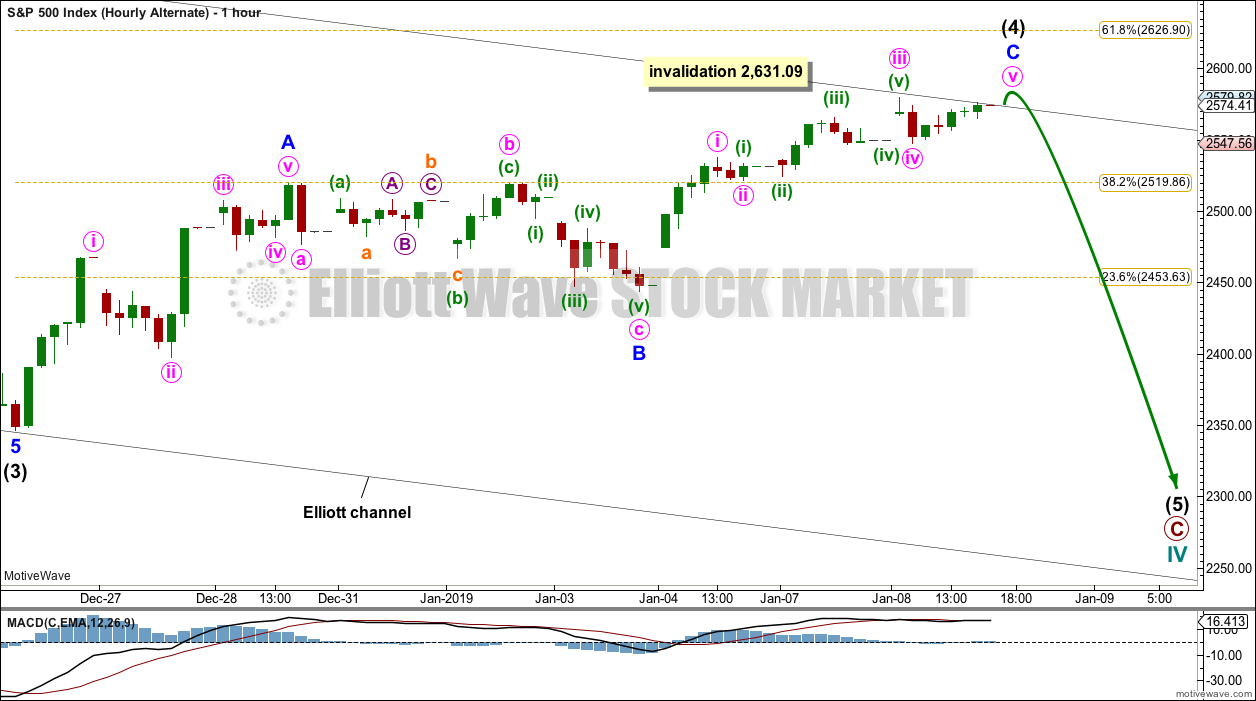
ALTERNATE HOURLY CHART
Click chart to enlarge.
Intermediate wave (4) may be an incomplete zigzag. A final fifth wave upwards for minute wave v may be required to complete minor wave C.
Thereafter, a trend change would be expected for this alternate wave count down to the targets given on the daily chart.
TECHNICAL ANALYSIS
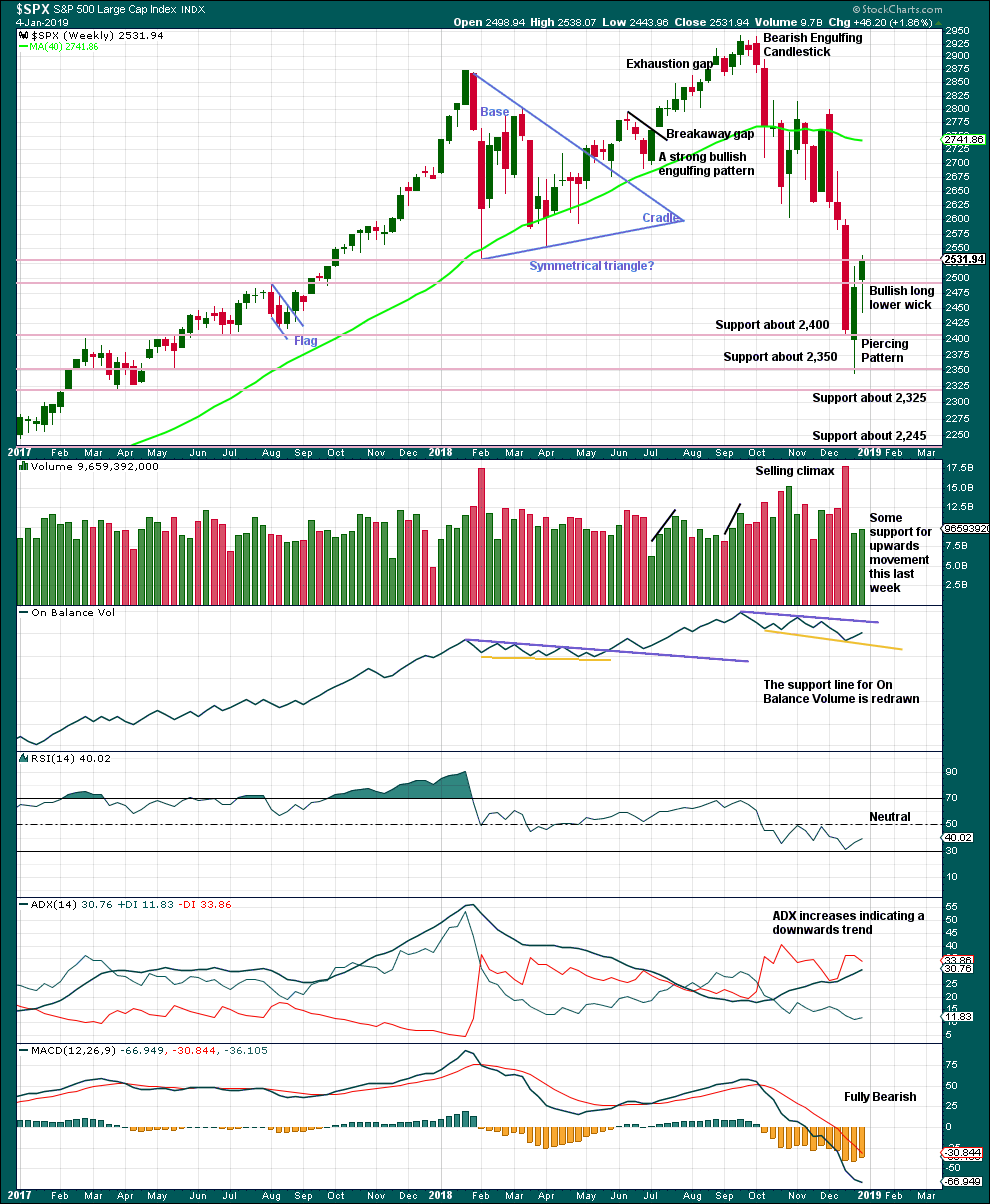
WEEKLY CHART
Click chart to enlarge. Chart courtesy of et=”_blank”>StockCharts.com.
From the all time high to the low of last week, price moved lower by 20.2% of market value meeting the definition for a bear market.
It should be noted that the large fall in price from May 2011 to October 2011 also met this definition of a bear market, yet it was only a very large pullback within a bull market, which so far has lasted almost 10 years.
Last week has support from volume and a long lower wick. This is bullish at least for the short term.
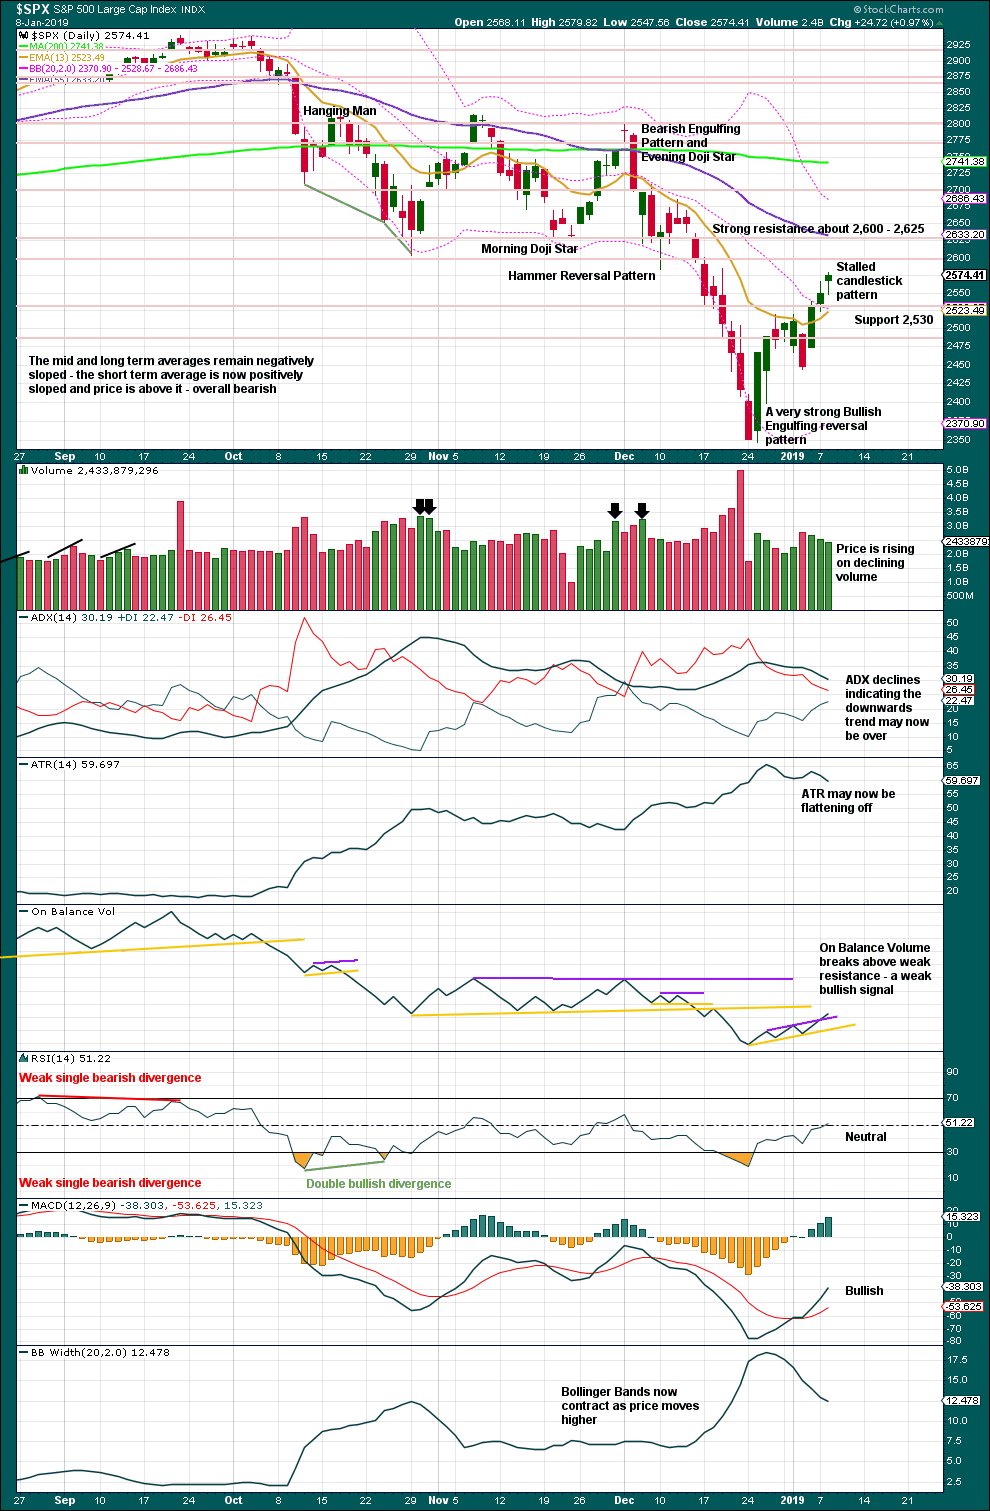
DAILY CHART
Click chart to enlarge. Chart courtesy of StockCharts.com.
Over a fairly long period of time this ageing bull market has been characterised by upwards movement on light and declining volume and low ATR. For the short to mid term, little concern may be had if price now rises again on declining volume. Current market conditions have allowed for this during a sustained rise in price.
Considering the larger picture from the Elliott wave count, some weakness approaching the end of Grand Super Cycle wave I is to be expected.
The 4th of January was a 90% upward day from Lowry’s data. This is an indication of strength underlying this rise in price.
This last three daily candlesticks complete a Stalled pattern, which is a bearish reversal pattern. This is contradicted by a bullish signal today from On Balance Volume, but the signal is very weak.
BREADTH – AD LINE
WEEKLY CHART
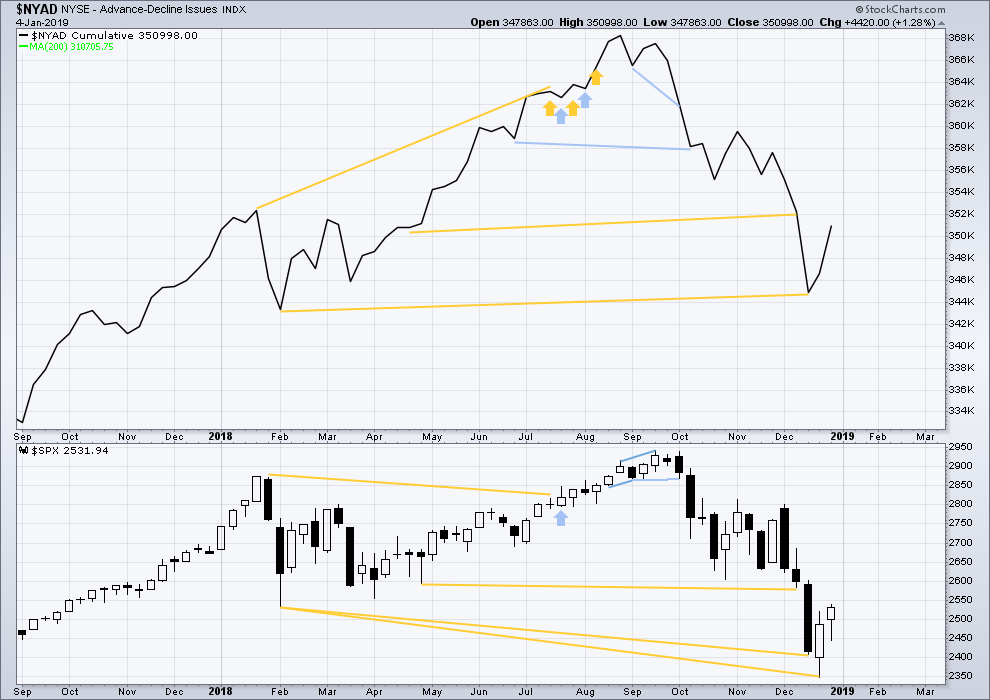
Click chart to enlarge. Chart courtesy of StockCharts.com. So that colour blind members are included, bearish signals
will be noted with blue and bullish signals with yellow.
Upwards movement has support from rising market breadth.
DAILY CHART
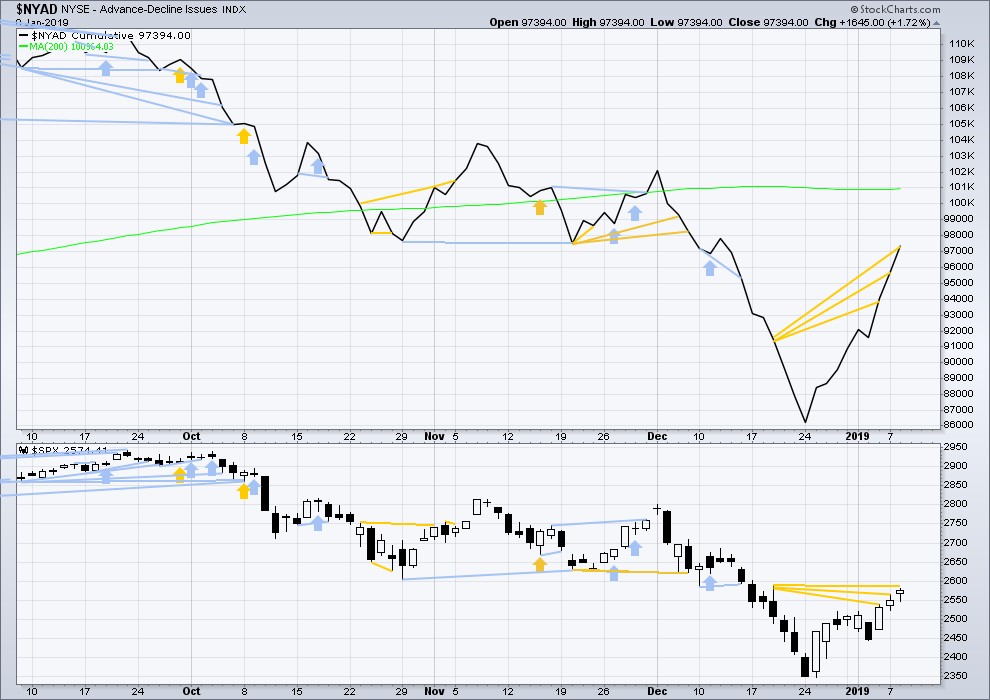
Click chart to enlarge. Chart courtesy of StockCharts.com. So that colour blind members are included, bearish signals
will be noted with blue and bullish signals with yellow.
Breadth should be read as a leading indicator.
For the short term, the AD line has made another new high above a prior small swing high on the 19th of December 2018, but price has not. This divergence has now occurred three sessions in a row. This divergence is bullish; the AD line is rising faster than price.
VOLATILITY – INVERTED VIX CHART
WEEKLY CHART
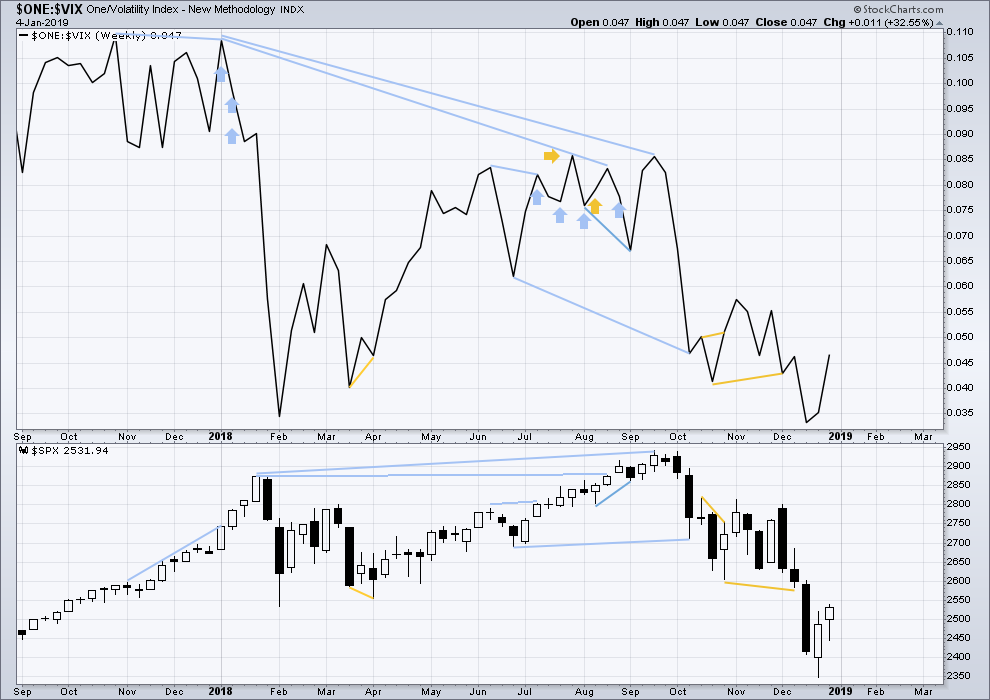
Click chart to enlarge. Chart courtesy of StockCharts.com. So that colour blind members are included, bearish signals
will be noted with blue and bullish signals with yellow.
Upwards movement has support from a corresponding decline in VIX. There is no divergence.
DAILY CHART
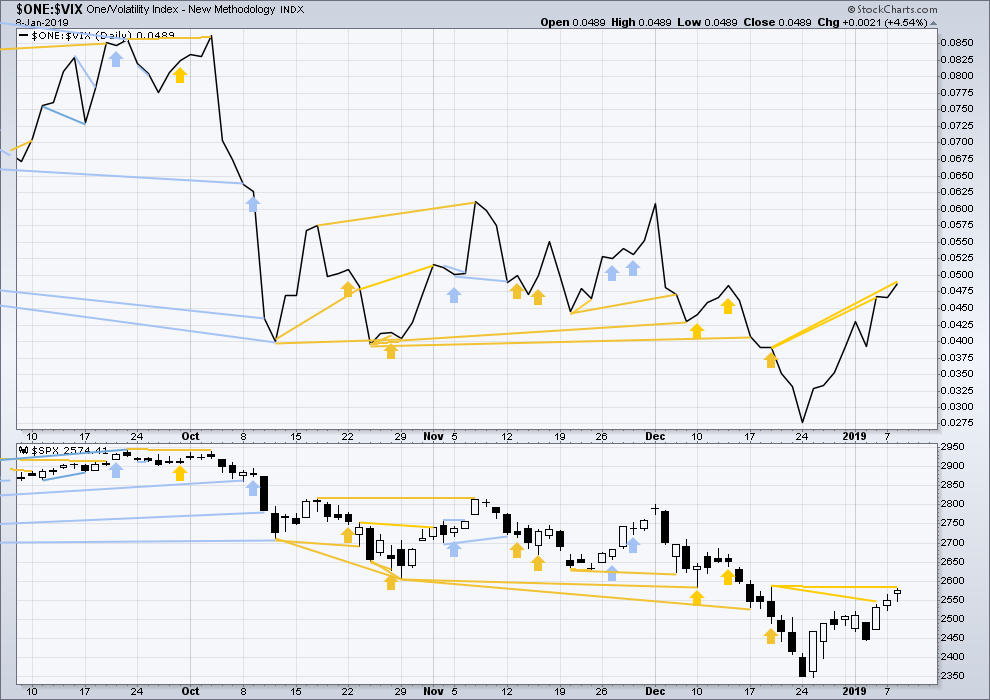
Click chart to enlarge. Chart courtesy of StockCharts.com. So that colour blind members are included, bearish signals
will be noted with blue and bullish signals with yellow.
Inverted VIX has made another new high above the prior high of the 19th of December 2018, but price has not. This divergence is bullish.
DOW THEORY
Dow Theory confirms a bear market. This does not necessarily mean a bear market at Grand Super Cycle degree though; Dow Theory makes no comment on Elliott wave counts. On the 25th of August 2015 Dow Theory also confirmed a bear market. The Elliott wave count sees that as part of cycle wave II. After Dow Theory confirmation of a bear market in August 2015, price went on to make new all time highs and the bull market continued.
DJIA: 23,344.52 – a close on the 19th of December at 23,284.97 confirms a bear market.
DJT: 9,806.79 – price has closed below this point on the 13th of December.
S&P500: 2,532.69 – a close on the 19th of December at 2,506.96 provides support to a bear market conclusion.
Nasdaq: 6,630.67 – a close on the 19th of December at 6,618.86 provides support to a bear market conclusion.
Published @ 09:34 p.m. EST.
—
Careful risk management protects your trading account(s).
Follow my two Golden Rules:
1. Always trade with stops.
2. Risk only 1-5% of equity on any one trade.
I sure like this set up in XOP. This is weekly. The historical swing structure indicates to me this is a very high reward potential set up. I’ve bought some Sept calls. I’m aware of the risk that oil slams back into down trend mode…but it won’t take much more up to get into certain break even or better status here.
RUT is now in it’s second daily of an up trend (as I measure trend) on the daily chart. Haven’t seen that since late September!!
That said, it’s fast approaching key overlapped fibo’s and pivot resistance. RUT continues yet again at the market leader (side by side with NDX today). RUT perhaps benefits from the most from Powell’s recent dovish statement, but if interest rates start moving up again here anyway, that could dampen the party spirit a bit.
They are monkey hammering the vix and vix futures
Tried and true way to get buying..
And making people feel the pain of a long vol trade
I’ve been there
Does make for a window of risk
It feels like the last time they did it to vxx last month and got it to 32… and then it exploded over 50
It’s also retiring … so maybe they feel they can short with impunity as it will be a cash settlement
Best wishes and good thoughts brother
Just because I am going to be out of commission for several days, I have moved everything to 100% cash. I will just sleep better.
Have a great day all. I’ll be checking back with you all in a few days or so.
Blessings.
Good luck Rodney 🙂
Updated second hourly chart:
The middle of the third wave count have passed today.
*could
NDX getting into some overlapped fibo’s here. And there’s the down trend line over head. The two upward lines are symmetric projections of prior up moves, suggesting possible time/price ending points for this move as well. Overall, I’d tend to say there’s more to go here…but it time to be a bit careful on the long side too.
chartmonkey, I am wondering what signal would invalidate that very bullish call? Sorry if that is a stupid question.
Debbie, great question! I was wondering the same thing myself.
Like they say, “it takes a lot of ocean to turn the Queen Mary around”. I suppose one thing that might do it is a bigger bearish 3 candle signal.
I’m not sure what it would take. In poker a straight flush beat four of a kind. I wonder if this signal requires the same kind of thing: like a more powerful counter signal?
Things looking a little tired…
The pushes down on the vix and up on the markets are losing momentum
You can feel it…but that being said.. the machines definitely seemed to be turned in the up direction ..
Selling out of money short term calls in the s and p and Tesla
Covered a little of my vol shorts …
There’s a multi-day rise under way in interest rates that I suspect is goosing this market due to it’s support of the financials. If it’s just a short trend and /ZB and TLT start moving up again, I expect the market to do some corresponding pullback/consolidation.
But if this is a resumption of the secular interest rate trend, that could goose this market yet more. If there’s some kind (any kind) of China trade deal, that could be explosive. However, I would expect that is many weeks away, and frankly…more likely to terminate this bull run if/as it fails.
Kevin, the question you asked about price target and rate of price movement really got me thinking. Here are some ideas along these lines.
• SPX Price target: 3045 — Taken directly from Lara’s research.
• ES Price target on this move / leg / wave: 2860 — Generated from a proprietary algorithm that I developed with a hedge fund manager. She is fine with mentioning the target if how we derived it isn’t part of the discussion.
• ETA at ES price of 2860: Jan 16, next Wednesday — Very ballparkish number. No science involved here, just visually deconstructing what the market algo has been doing over the last 3 months. This is like using three data points to analyze a trend. Low confidence guess.
Here is a chart that marks 3 of this type of signal that have come across the daily ES chart over the last 3 months
Thanks chartmonkey for that info. I am wondering if you have a name for the 3 candlestick pattern you have identified which indicates a “monster rally” underway. Also, is this a pattern you have discovered or is it something well known among those who use Heiken-Ashi charts? Do you have any information as to its frequency and reliability?
Any information is helpful and appreciated. By the way, I’ve been reading about the Heiken-Ashi charts off internet sites. Do you have any book recommendations which might be the ‘definitive’ source?
BTW, a 300 point SPX rally in a week is a bold prediction and certainly will be called a monster rally if it materializes. The only thing I can think of that could precipitate such a move is a trade agreement between the USA and China.
Have a great day.
Rodney, I discovered this unnamed pattern. I have not back tested it for frequency or reliability. I’m thinking of calling it the some-guy-on-the-internet-pattern-who-doesn’t-know-how-well-it-works-pattern. Or maybe something less wordy.
I am self-taught using free Heikin-Ashi online resources. I would like to find a definitive Heikin-Ashi book also.
The bold upside target got my attention too. I use ES and think in ES, so these comments are all from ES-ville. The top-to-bottom 500 point downside move that we just finished required 6 days to complete after the signal had printed on a daily chart. The upside move is targeting a bottom-to-top total 550 point move. Right now, we are 290 points away from the upside target. That is an average of 58 points per day for each of the next five days. Let’s say that it takes longer than that, say it takes until next week on Friday to reach the upside trade target. That would require an average of 42 points per day.
I really like the target of 2860. The time frame is a big fat guess.
One thing I need to clarify
When I said “some-guy-on-the-internet-pattern-who-doesn’t-know-how-well-it-works-pattern” I meant that I was naming the pattern after me. I am that “some-guy”
Absolutely no snarkyness intended.
Your target for ES at 2860 next Wednesday is pretty aggressive-another 10% from here. That could happen if we get a trade deal! In addition, there’s a full moon on 21st-I’m hoping your target is hit around there so take my longs off and short the markets.
rvila, true enough! This has been an aggressive market. Very forceful moves up. A lot of vertical. Another thing that could make 2860 happen is if there is a healthy supply of bears who insist on shorting all the way up until they throw in the towel at 2820.
P.S.— I love it that a trader keeps an eye on the moon phases!
Nice! My hunch that minute ii hasn’t passed yet fits today’s main count analysis first chart. 🙂