Upwards movement continues as expected for the main Elliott wave count. The alternate Elliott wave count still remains valid, but it does not have support from classic technical analysis at this time.
Summary: A low may now be in place. Confidence in this view may be had if price makes a new high above 2,631.09. The target is at 3,045 with a limit at 3,477.39. This primary view has support from strongly rising market breadth and a 90% up day on the 4th of January.
The alternate wave count expects one more low before cycle wave IV is complete. Targets are either 2,269 or 2,242 – 2,240, although when intermediate wave (4) may be complete the target would be recalculated.
New updates to this analysis are in bold.
The biggest picture, Grand Super Cycle analysis, is here.
The monthly chart was last published here.
MAIN ELLIOTT WAVE COUNT
WEEKLY CHART
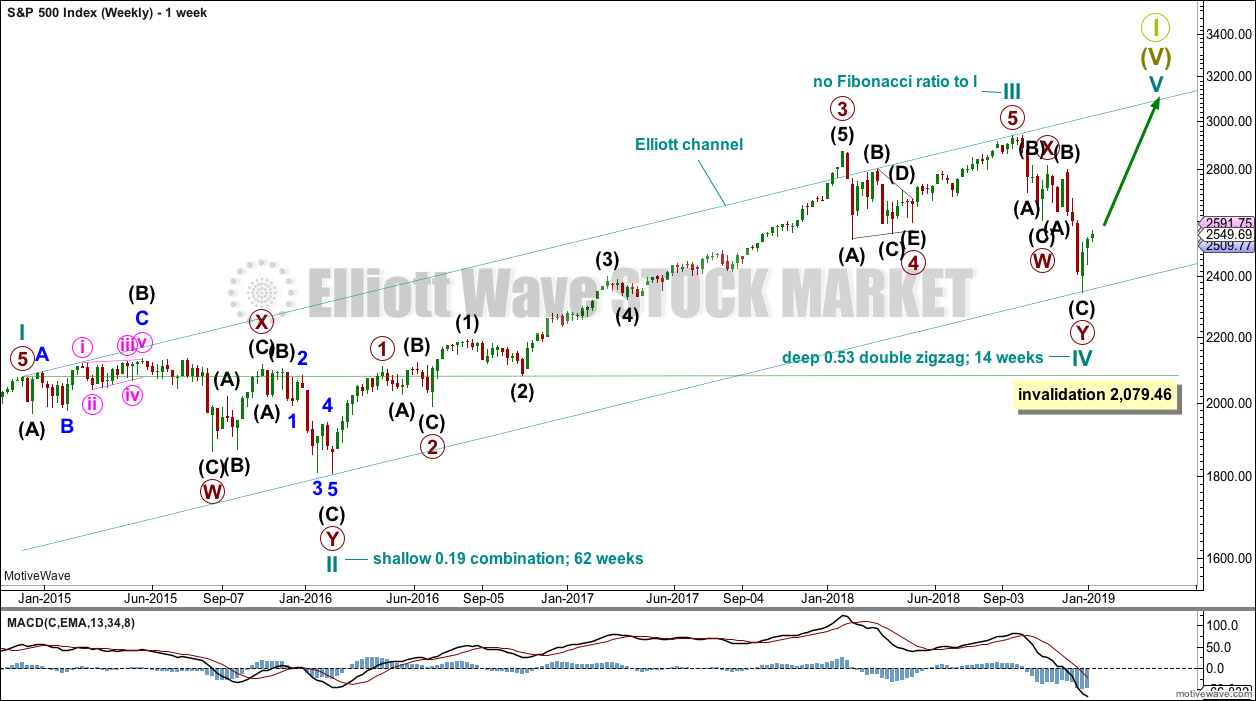
This weekly chart shows all of cycle waves II, III and IV so far.
Cycle wave II fits as a time consuming double combination: flat – X – zigzag. Combinations tend to be more time consuming corrective structures than zigzags. If cycle wave IV completes as a single or multiple zigzag, then it should be expected to be more brief than cycle wave II.
Cycle wave IV may have ended at the lower edge of the Elliott channel. Fourth waves are not always contained within Elliott channels. If the alternate daily wave count below is correct, then cycle wave IV may breach this channel.
Cycle wave IV may not move into cycle wave I price territory below 2,079.46.
Although both cycle waves II and IV are labelled W-X-Y, they are different corrective structures. There are two broad groups of Elliott wave corrective structures: the zigzag family, which are sharp corrections, and all the rest, which are sideways corrections. Multiple zigzags belong to the zigzag family and combinations belong to the sideways family. There is perfect alternation between the possible double zigzag of cycle wave IV and the combination of cycle wave II.
Although there is gross disproportion between the duration of cycle waves II and IV, the size of cycle wave IV in terms of price makes these two corrections look like they should be labelled at the same degree. Proportion is a function of either or both of price and time.
Draw the Elliott channel about Super Cycle wave (V) as shown. Cycle wave V may find resistance about the upper edge.
DAILY CHART
The daily chart will focus on the structure of cycle wave IV.
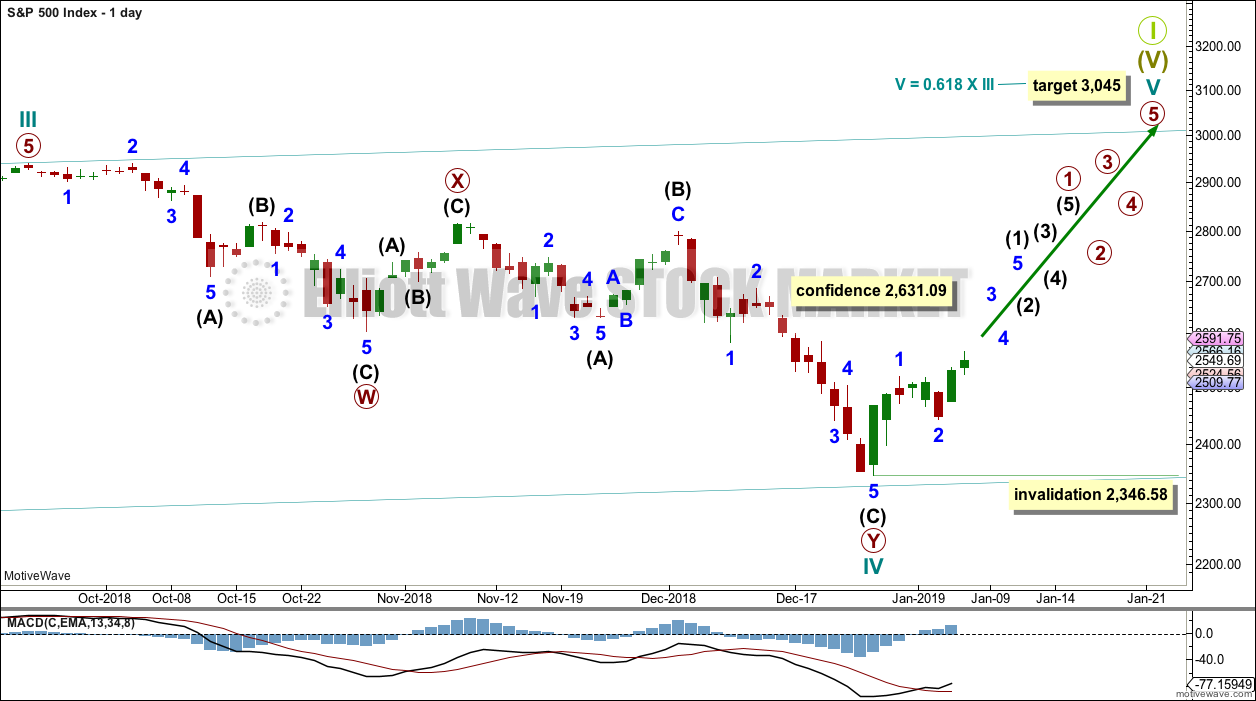
Cycle wave IV may be a complete double zigzag. This would provide perfect alternation with the combination of cycle wave II. Double zigzags are fairly common corrective structures.
Within Super Cycle wave (V), cycle wave III may not be the shortest actionary wave. Because cycle wave III is shorter than cycle wave I, this limits cycle wave V to no longer than equality in length with cycle wave III at 3,477.39. A target is calculated for cycle wave V to end prior to this point.
Cycle wave V must subdivide as a five wave motive structure, either an impulse or an ending diagonal. An impulse is much more common and that will be how it is labelled. A diagonal would be considered if overlapping suggests it.
Within the five wave structure for cycle wave V, primary wave 1 would be incomplete. Within primary wave 1, intermediate wave (1) may be incomplete. The degree of labelling within cycle wave V may need to be adjusted as it unfolds further.
Within cycle wave V, no second wave correction may move beyond the start of its first wave below 2,346.58.
At this stage, a new high by any amount at any time frame above 2,631.09 would invalidate the alternate wave count below and provide confidence in this main wave count.
HOURLY CHART
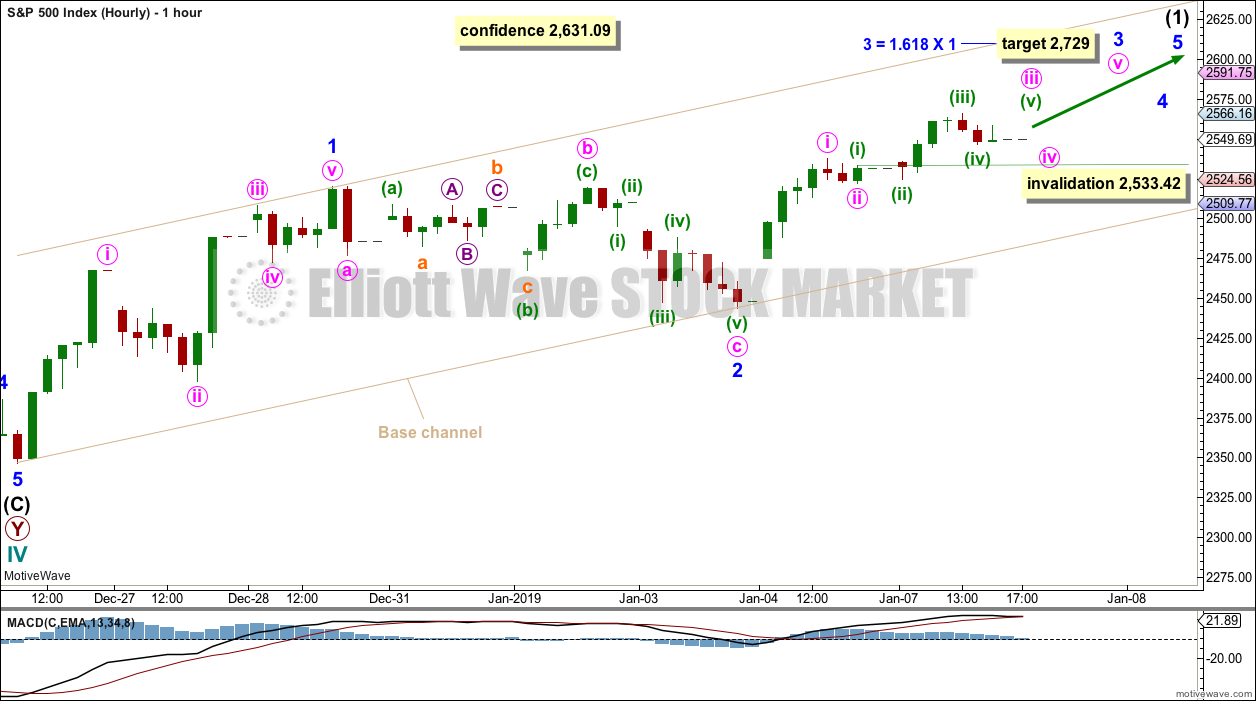
Intermediate wave (1) may be incomplete and may be unfolding as an impulse.
Within the impulse, minor waves 1 and 2 may now be complete. A target is calculated for minor wave 3 which expects the most common Fibonacci ratio to minor wave 1.
Minor wave 3 may only subdivide as an impulse. Within minor wave 3, minute waves i and ii may be complete. Minute wave iii may be incomplete.
Within minute wave iii, minuette wave (iv) may not move into minuette wave (i) price territory below 2,533.42.
Draw a base channel about minor waves 1 and 2 as shown. The lower edge of this channel may provide support.
ALTERNATE DAILY CHART
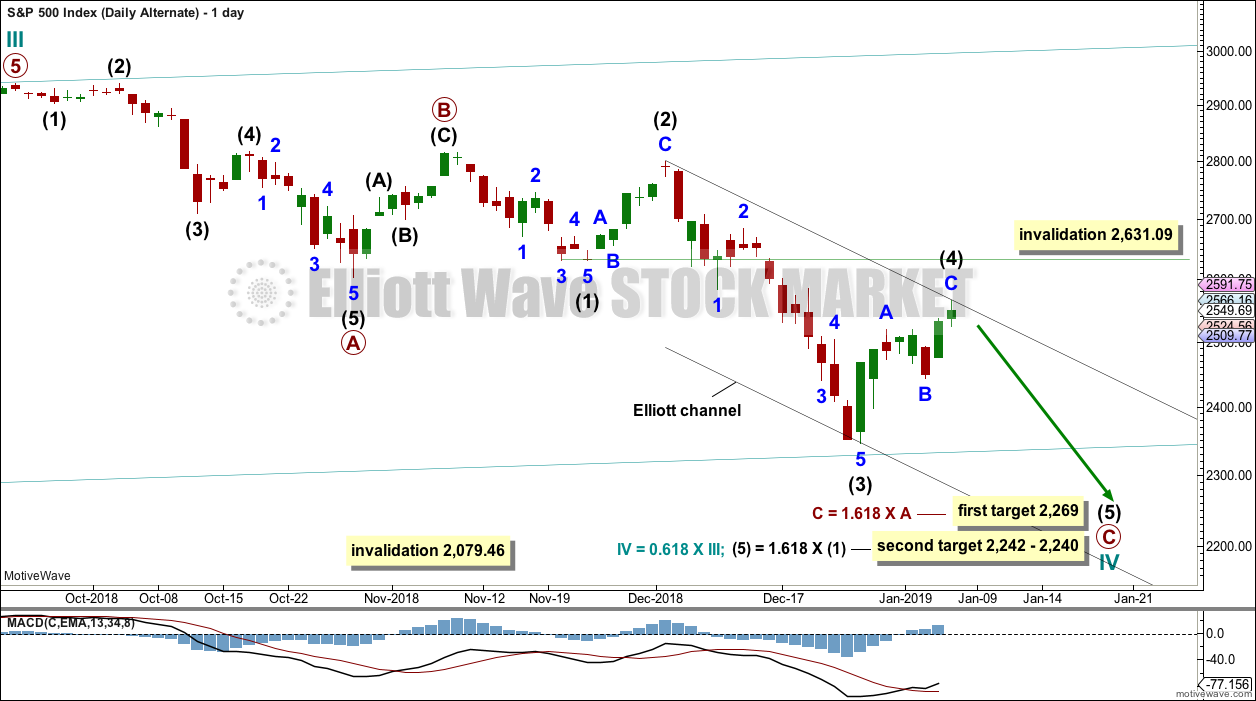
Cycle wave IV may be a an incomplete single zigzag. This would provide perfect alternation with the combination of cycle wave II. Zigzags are the most common corrective structures.
Within this zigzag, primary wave C may be completing as a five wave impulse.
Intermediate wave (2) shows up on the weekly and daily charts. Intermediate wave (4) now also shows on weekly and daily charts. This wave count has the right look.
Intermediate wave (4) may not move into intermediate wave (1) price territory above 2,631.09.
Targets are calculated for cycle wave IV to end. If price gets to the first target and the structure is incomplete, or if price falls through the first target, then the second target may be used.
Redraw the channel about primary wave C using Elliott’s second technique. Draw the first trend line from the high of intermediate wave (2) to the high of intermediate wave (4), then place a parallel copy on the low of intermediate wave (3). If intermediate wave (4) continues higher, then redraw the channel using the same technique. The lower edge may then provide support for intermediate wave (5).
ALTERNATE HOURLY CHART
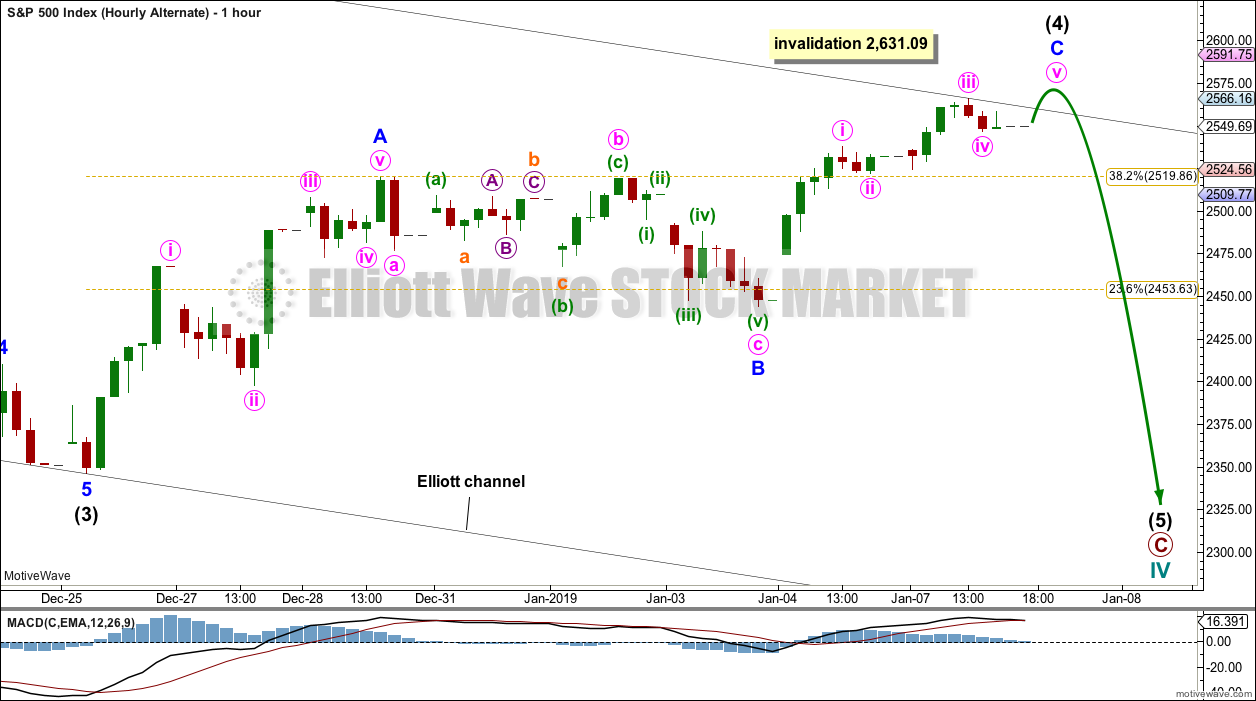
Intermediate wave (4) may be an incomplete zigzag. A final fifth wave upwards for minute wave v may be required to complete minor wave C.
Thereafter, a trend change would be expected for this alternate wave count down to the targets given on the daily chart.
TECHNICAL ANALYSIS
WEEKLY CHART
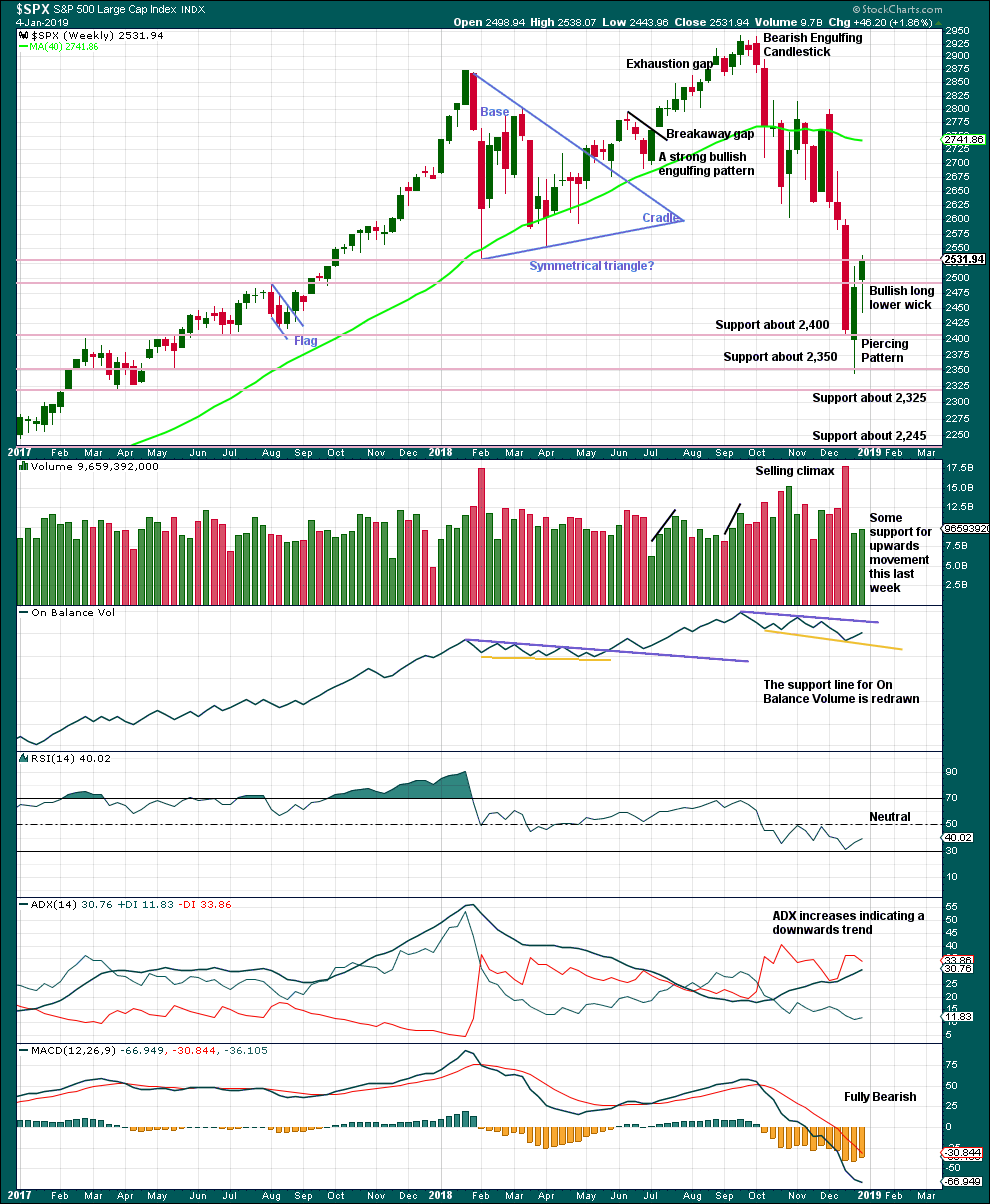
Click chart to enlarge. Chart courtesy of et=”_blank”>StockCharts.com.
From the all time high to the low of last week, price moved lower by 20.2% of market value meeting the definition for a bear market.
It should be noted that the large fall in price from May 2011 to October 2011 also met this definition of a bear market, yet it was only a very large pullback within a bull market, which so far has lasted almost 10 years.
Last week has support from volume and a long lower wick. This is bullish at least for the short term.
DAILY CHART
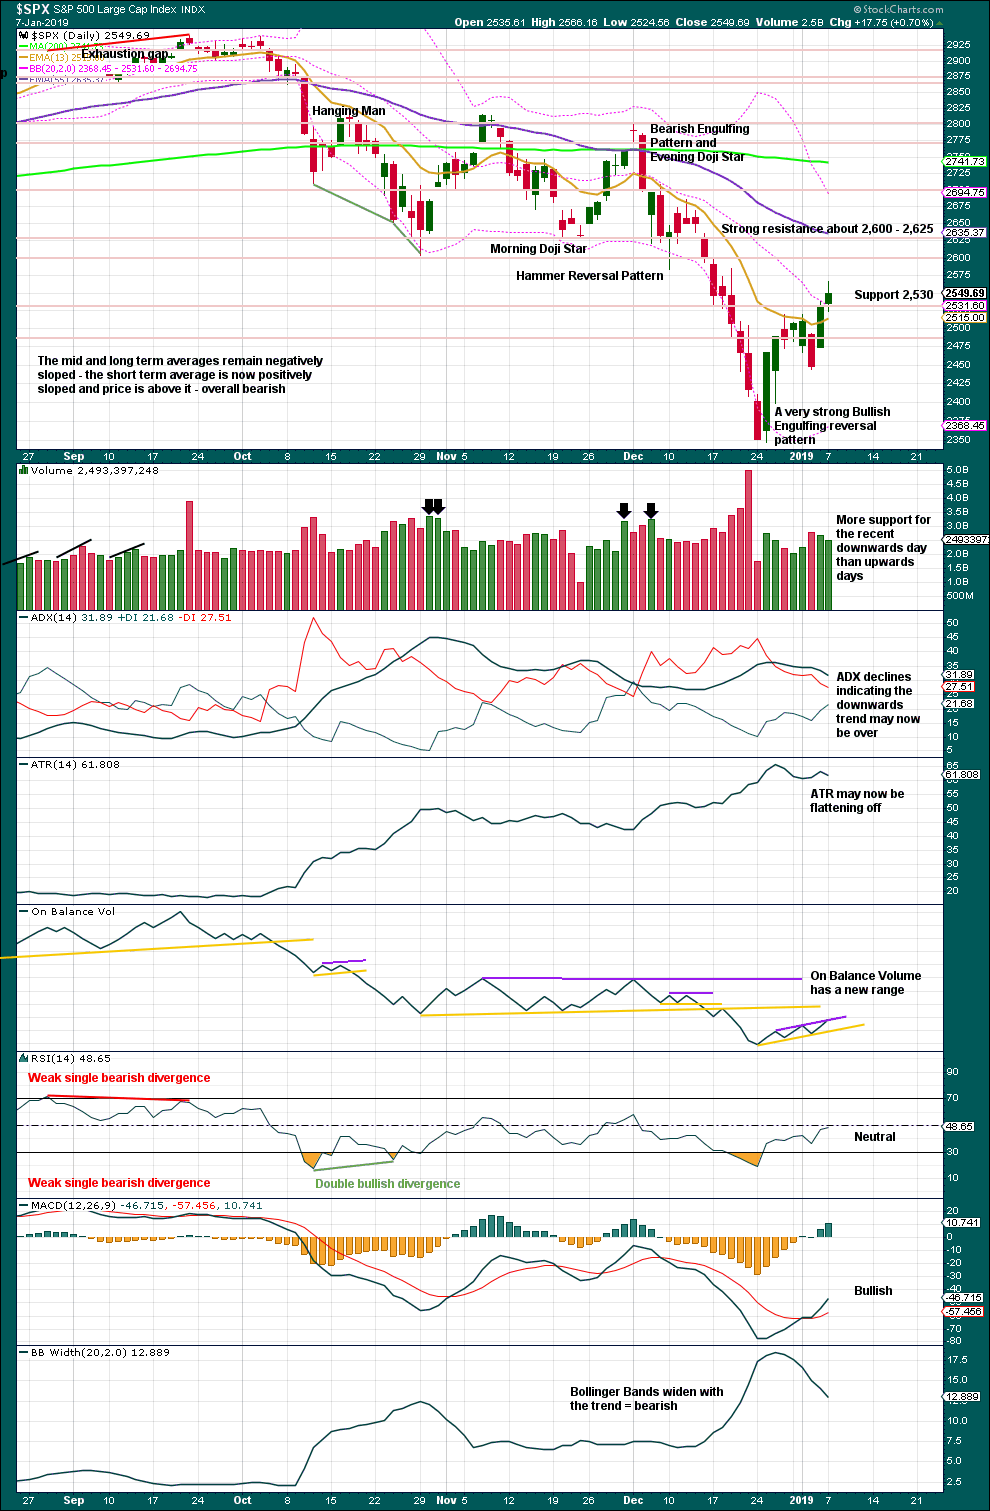
Click chart to enlarge. Chart courtesy of StockCharts.com.
Over a fairly long period of time this ageing bull market has been characterised by upwards movement on light and declining volume and low ATR. For the short to mid term, little concern may be had if price now rises again on declining volume. Current market conditions have allowed for this during a sustained rise in price.
Considering the larger picture from the Elliott wave count, some weakness approaching the end of Grand Super Cycle wave I is to be expected.
The 4th of January was a 90% upward day from Lowry’s data. This is an indication of strength underlying this rise in price.
BREADTH – AD LINE
WEEKLY CHART
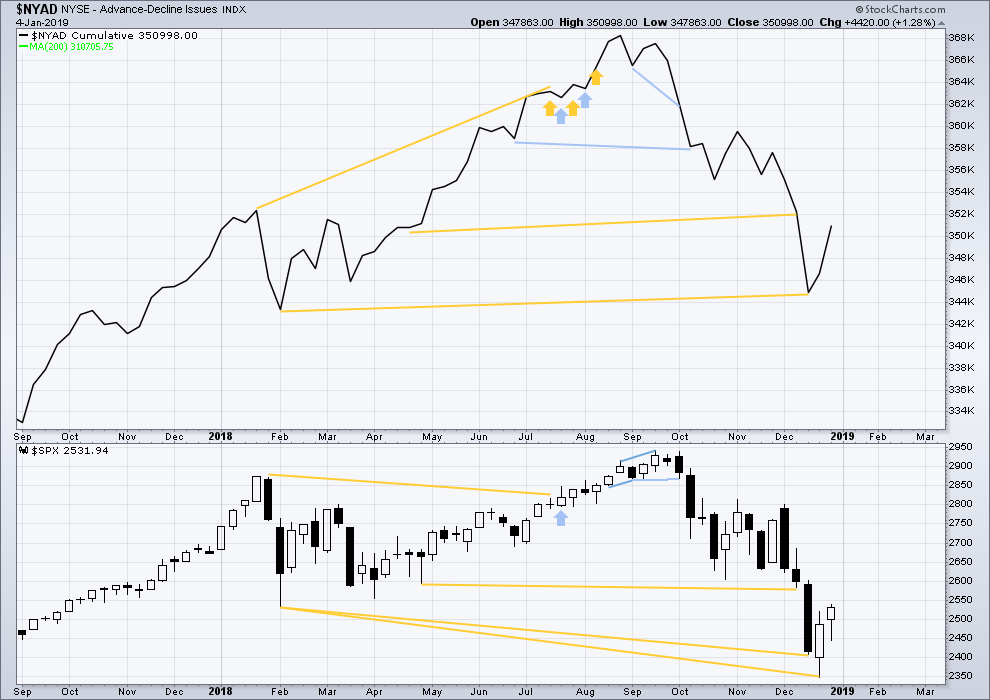
Click chart to enlarge. Chart courtesy of StockCharts.com. So that colour blind members are included, bearish signals
will be noted with blue and bullish signals with yellow.
Upwards movement has support from rising market breadth.
DAILY CHART
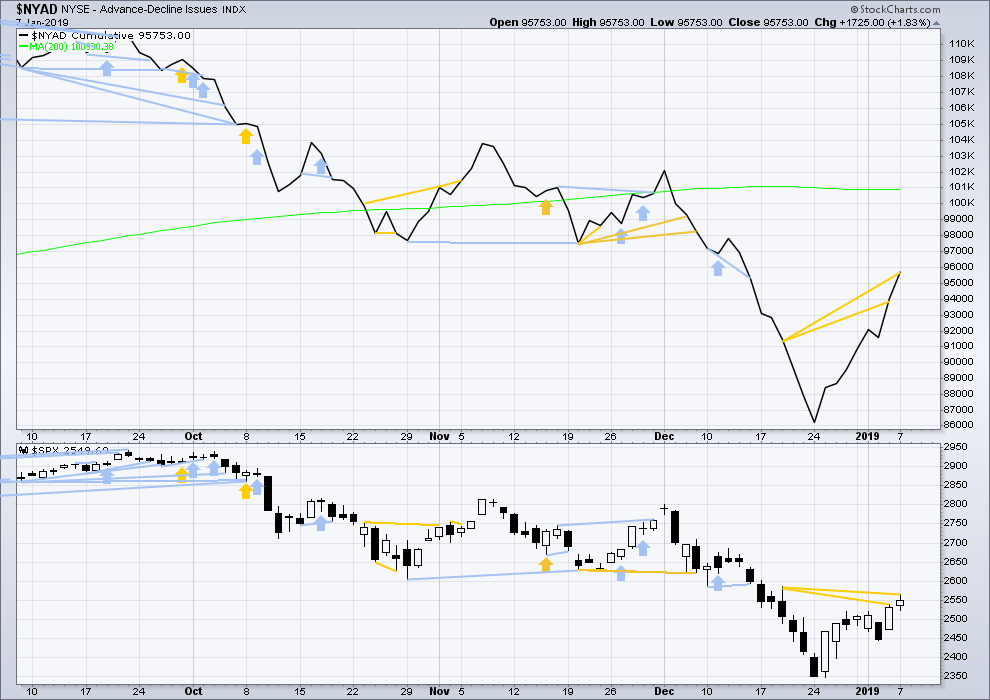
Click chart to enlarge. Chart courtesy of StockCharts.com. So that colour blind members are included, bearish signals
will be noted with blue and bullish signals with yellow.
Breadth should be read as a leading indicator.
For the short term, the AD line has made another strong new high above a prior small swing high on the 19th of December 2018, but price has not. This divergence is bullish; the AD line is rising faster than price.
VOLATILITY – INVERTED VIX CHART
WEEKLY CHART
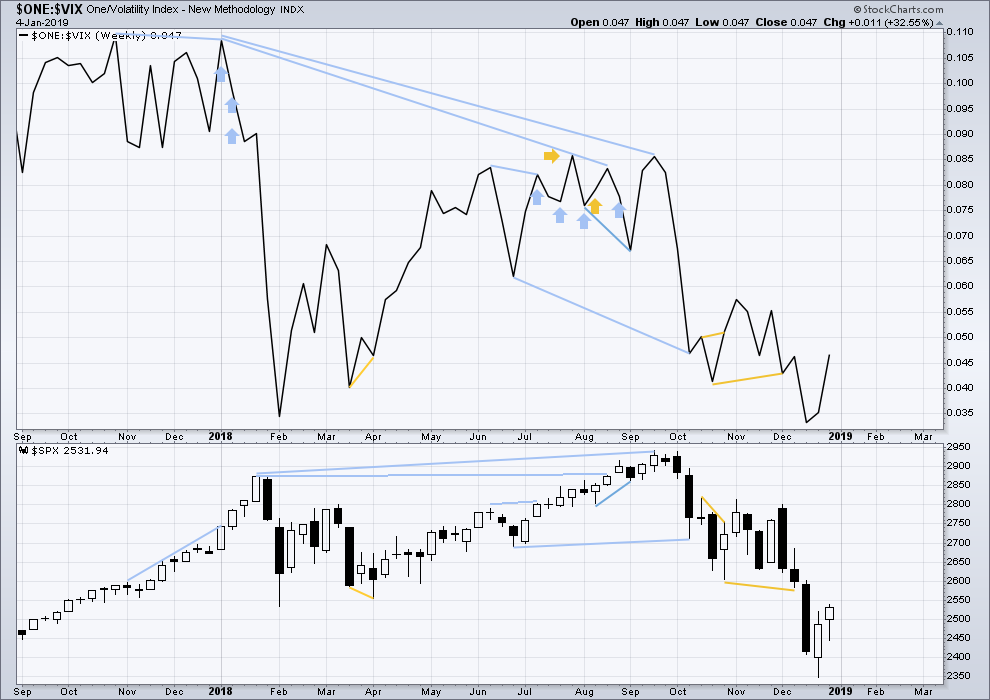
Click chart to enlarge. Chart courtesy of StockCharts.com. So that colour blind members are included, bearish signals
will be noted with blue and bullish signals with yellow.
Upwards movement has support from a corresponding decline in VIX. There is no divergence.
DAILY CHART
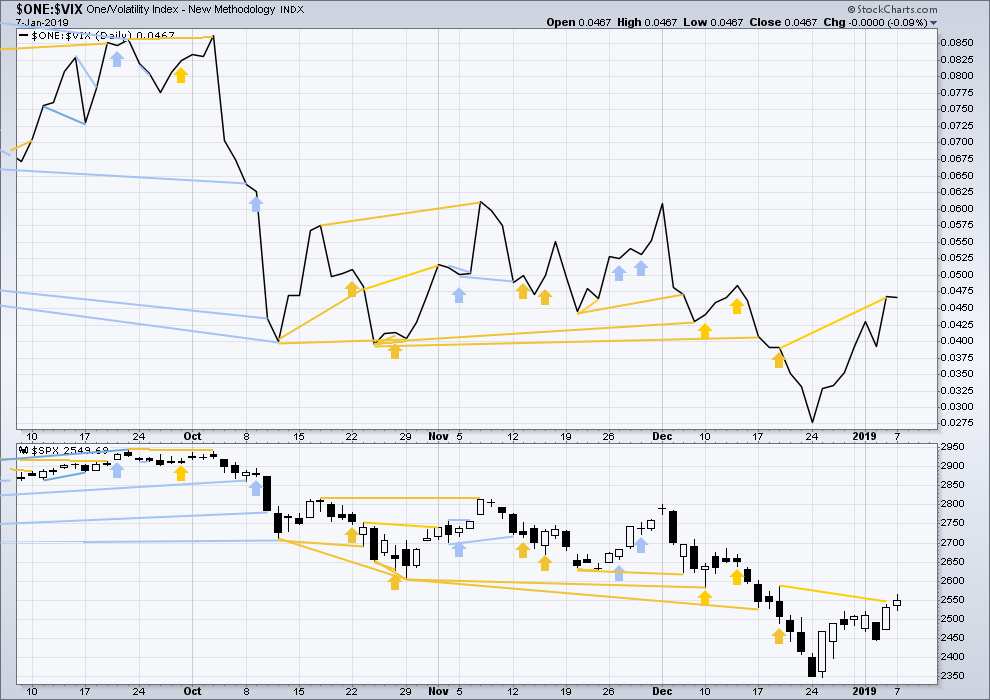
Click chart to enlarge. Chart courtesy of StockCharts.com. So that colour blind members are included, bearish signals
will be noted with blue and bullish signals with yellow.
Today price has moved higher, but inverted VIX is flat to slightly declining. There is weak bearish divergence here.
DOW THEORY
Dow Theory confirms a bear market. This does not necessarily mean a bear market at Grand Super Cycle degree though; Dow Theory makes no comment on Elliott wave counts. On the 25th of August 2015 Dow Theory also confirmed a bear market. The Elliott wave count sees that as part of cycle wave II. After Dow Theory confirmation of a bear market in August 2015, price went on to make new all time highs and the bull market continued.
DJIA: 23,344.52 – a close on the 19th of December at 23,284.97 confirms a bear market.
DJT: 9,806.79 – price has closed below this point on the 13th of December.
S&P500: 2,532.69 – a close on the 19th of December at 2,506.96 provides support to a bear market conclusion.
Nasdaq: 6,630.67 – a close on the 19th of December at 6,618.86 provides support to a bear market conclusion.
Published @ 07:57 p.m. EST.
—
Careful risk management protects your trading account(s).
Follow my two Golden Rules:
1. Always trade with stops.
2. Risk only 1-5% of equity on any one trade.

Be nice if this day closed without a spinning top structure to the daily bar! A spinning top here on the daily chart would be awfully bearish in my book, similar to 12/3 and 11/8. The current high is right at the 12/10 low which is also a 50% fibo level, so it’s reasonable resistance right there.
I would think the market “wants” to get up to 2600 here, and then there’s strong resistance, the low of the 10/29 bar and a 78.6% at 2613 and of course the roundie itself.
I’m watching TLT (and /ZB) closely, it may be on the verge of changing trend to back down which would pump the financials which could juice the market.
Updated hourly chart:
I’m moving the degree of labelling within minute iii all down one degree today, that means the invalidation point has to be moved lower.
This is because if it were over at today’s high, then minute iii would be shorter than minute i by a large amount. That’s possible, but it’s not as likely as minute iii being longer than minute i. I’d also expect to see more of an increase in momentum for minute iii than we’re seeing so far.
This change makes a great deal of sense to me, Lara. Thanks. It resolves some of the issue I was seeing especially the target for Minor 3 at 2729.
True. I checked the target, and it would be invalid if minute iii was over at today’s high.
Any way to see minute i ending at today’s high Lara? Minute ii looks awfully short and small for a second wave at minute degree.
I’m also seeing a rising wedge in the ES and NQ (futures markets) that broke to downside today and now it looks like its back testing its trend line that it broke…
lol think we charted the same wedge on ES. Broke and then rode up the bottom trend? Rather annoying.
Hey everybody, there may be a problem with the weekly video not remaining in focus.
Rodney is having this problem, and so we would like to resolve it.
Is anyone else having a problem with my video coming in and out of focus?
If you are, please could you email Cesar a quick description of the problem, along with your operating system and browser you’re using. Then he can start to trouble shoot.
Cesar’s email is webmaster@elliottwavestockmarket.com
Thanks everybody 🙂
You know …… I am getting old and it could just be my eyes (he-he). Also, in the state I live in, pot is legal (another he-he).
The past few weeks, I have been watching the videos with MS Internet Explorer. It is an ancient web browser so that may be the issue. It would be a good thing if I am the only one. I will start using Google Chrome to see if it resolves the problem for me. I hope that is all it is.
I hope so too. Let me know if Chrome resolves the issue.
And if Chrome doesn’t do it, I suggest a shot or two of Jack as a chaser Rodney. Should sharpen things up for you!
Hi Lara,
The video starts out blurry at 408 dpi but cleans up quickly (screenshot).
However video runs at 726 dpi instead of the usual 720 dpi, that might be forcing blurriness from anti-aliasing for some.
FWIW blurriness fading in and out might also be internet speed issues.
Dave
RUT the leader again today. Probably headed to fibo cluster 1444.5 to 1453 area.
This morning’s gap up was the completion of Minute iii (pink) on Lara’s hourly chart. The gap is now filled indicating an exhaustion gap. If this hourly count is correct, then we have Minute iv underway to be followed by Minute v and the completion of Minor 3. The target for Minor three is at 2729 which may be too high in my opinion.
This is an interesting and significant inflection point as the Alternate Count calls for the completion of Minor C of Intermediate 4 at today’s high. If the Alternate count is correct, it could get quite ugly quite fast as we head towards the 2270 target. Yikes!
My short term trading account is now 100% cash. I am long in my longer term positional trading account. But that may change today depending on market action.
Tomorrow I head towards the hospital of a major medical school four hours away. Thursday morning I go under the surgeon’s scalpel to receive a full replacement of my left shoulder. I am thinking it might be best to be 100% cash in all accounts when that takes place. I don’t want to wake up from surgery and ask the attending nurse, “What happened in the markets?”
Have a great day all. I will be out of commission for a while starting sometime tomorrow afternoon. My ability to comment will be hampered as I will only have one working arm / hand. As my wife always says, “Be safe.”
Best of luck with your surgery, we will miss your comments while you are out.
Rodney all the best and speedy recovery to you!
ps: I always appreciate your analyses!
Best wishes to you, Rodney!
Good luck Rodney! Hope you have a rapid recovery.
My best wishes too Rodney. May you come back renewed with a new bionic shoulder 🙂
Market showing turn off the top of the cluster of 3 fibos, the 50% of the 11/6 top to 12/26 bottom (2582).
How deep a retrace is now the question of the hour/day/week. If it’s a nominal 4 per the main it should stay above 2533. If it under cuts that…watch out bulls.
Why are you using 11/6 top not 10/3? Using 10/3 top and the recent low we’re into 38.2 fib
Thanks, Chartmonkey, we learn every day, cheers
YW, me too
: )
My feeling is that the one more low count may prove to be the one.
Plus being a contrarian vs this guy has been a money play… Of Course until it changes….
Late yesterday on Zero H: Gartman Makes “Watershed” Bullish Call: “The Game Has Changed; Stocks Are Headed Higher”
even a broken clock is right twice per 24 hours.
Lol
I mentioned that a couple days ago Joseph
Thought the same thing …
That was the day before the market went down big… so it panned out.
I am not sure all the Hedge Funds that received redemption requests have completely liquidated those requests + other! I still think market has one more low or near low to go. If it occurs it will be over the next week or two.
Something to share…
I do my technical analysis using Heikin-Ashi charts. There is a very useful signal that comes across in the charts. It’s a 3 candlestick signal. Which is: an uncertainty candle followed by a directional candle followed by a confirmation candle. There are specific criteria that I use to meet the definition of each. This is the most reliable signal that I have ever seen.
The reason I’m mentioning it here is because today printed the first 2 of the 3 candles. The size of these things indicates that if we get the confirmation candle tomorrow (on the daily chart), we will have begun a monster rally. So, here’s what I’m looking at.
The chart I’m using is the ES chart, the SPX futures chart; which is what I trade. And this is the only chart that you will see these signals on. The uncertainty candle is a spinning top. This one is a one hundred point candle. A real whopper.
The directional candle needs to be flat bottomed with a close outside of the uncertainty candle’s range.
The confirmation candle also needs to be flat bottomed but with a close beyond the directional candle’s close. Okay, not a great explanation here but you’ll see what I mean in the chart.
What we need is for tomorrow’s daily candle print to have a close above 2545.
Here’s the chart
These signals will work on various timeframes. Here is a chart using 2 hour candles that was useful in day trades.
I hope this isn’t too tiny to see …
I presume a “confirming” day today would be an up day with a higher close than yesterday? Or is more required?
Hi Kevin,
If the trend is going up, like in this instance, the confirming candle needs to make a higher high than the directional candle. The confirming candle also needs to make a higher close than the directional candle. Both candles need to be flat bottomed.
Here is a clear illustration from today’s session (in progress)
You can see the 3 candle bullish signal. Then the next candle shows retracement back into the uncertainty candle’s range for long entries. Then the next candle is a move higher.
This is on the ES chart.
Thank you very much chartmonkey for sharing your charts. Interesting. I like how Heikin-Ashi charts remove a lot of noise.
YW
: )
Hey chartmonkey nice work. U have determined a convincing confirmation for my count. I am seeing a dead cat bounce off christmas. None of this feels like an impulse wave to me. I go along with Laras alternate count except i expect more upside tomorrow. I am wondering what the Heiken Ashi candles have to say about that. And any perspective on the time or price movement of what i am experiencing as this b wave back up from christmas.
Timo
Hey Timo,
I am not experienced enough to correlate the signal with a target. All I see is a very bullish signal from a long duration (daily) chart. I don’t know how this relates to speed or price.
I wish I had more insight into this.
Here is the chart