
Upwards movement was expected for last week, which is exactly what has happened.
Both Elliott wave counts remain valid, but the main Elliott wave count has more support from classic technical analysis, particularly market breadth.
Summary: A low may now be in place. Confidence in this view may be had if price makes a new high above 2,631.09. It it does, then at that stage the target would be 3,045 with a limit at 3,477.39. This primary view has support from strongly rising market breadth and a 90% up day on the 4th of January.
The alternate wave count expects one more low before cycle wave IV is complete. Targets are either 2,269 or 2,242 – 2,240, although when intermediate wave (4) may be complete the target would be recalculated.
New updates to this analysis are in bold.
The biggest picture, Grand Super Cycle analysis, is here.
The monthly chart was last published here.
MAIN ELLIOTT WAVE COUNT
WEEKLY CHART
Click chart to enlarge.
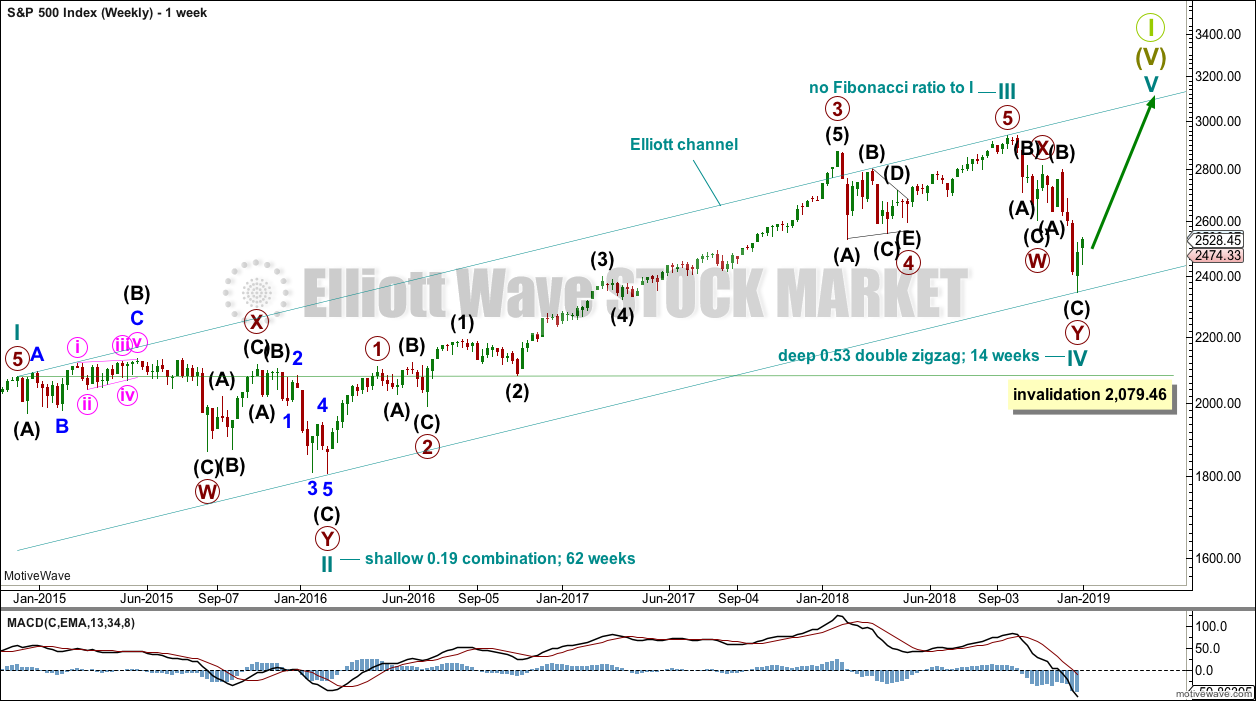
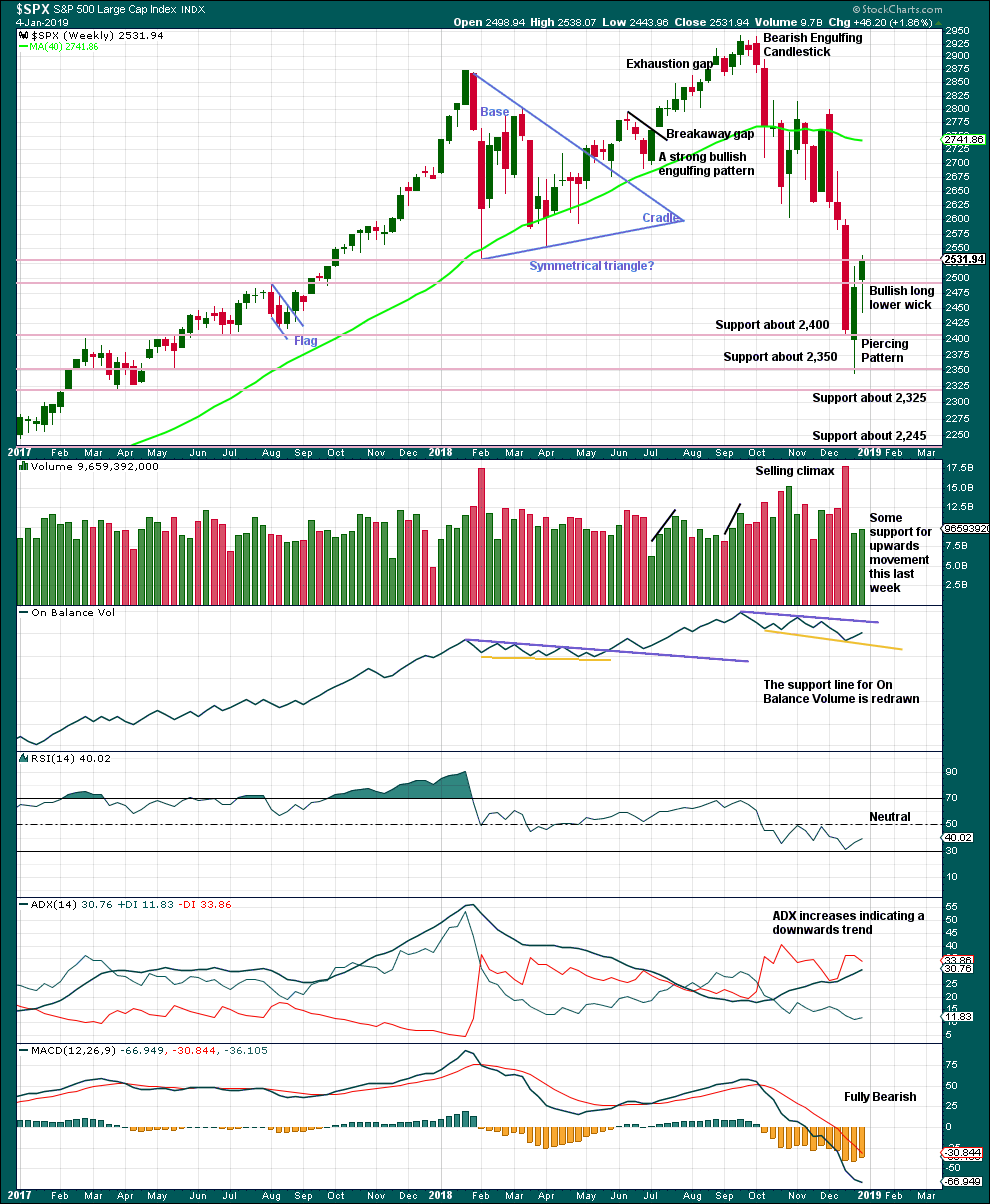
This weekly chart shows all of cycle waves II, III and IV so far.
Cycle wave II fits as a time consuming double combination: flat – X – zigzag. Combinations tend to be more time consuming corrective structures than zigzags. If cycle wave IV completes as a single or multiple zigzag, then it should be expected to be more brief than cycle wave II.
Cycle wave IV may have ended at the lower edge of the Elliott channel. Fourth waves are not always contained within Elliott channels. If the alternate daily wave count below is correct, then cycle wave IV may breach this channel.
Cycle wave IV may not move into cycle wave I price territory below 2,079.46.
Although both cycle waves II and IV are labelled W-X-Y, they are different corrective structures. There are two broad groups of Elliott wave corrective structures: the zigzag family, which are sharp corrections, and all the rest, which are sideways corrections. Multiple zigzags belong to the zigzag family and combinations belong to the sideways family. There is perfect alternation between the possible double zigzag of cycle wave IV and the combination of cycle wave II.
Although there is gross disproportion between the duration of cycle waves II and IV, the size of cycle wave IV in terms of price makes these two corrections look like they should be labelled at the same degree. Proportion is a function of either or both of price and time.
Draw the Elliott channel about Super Cycle wave (V) as shown. Cycle wave V may find resistance about the upper edge.
DAILY CHART
Click chart to enlarge.
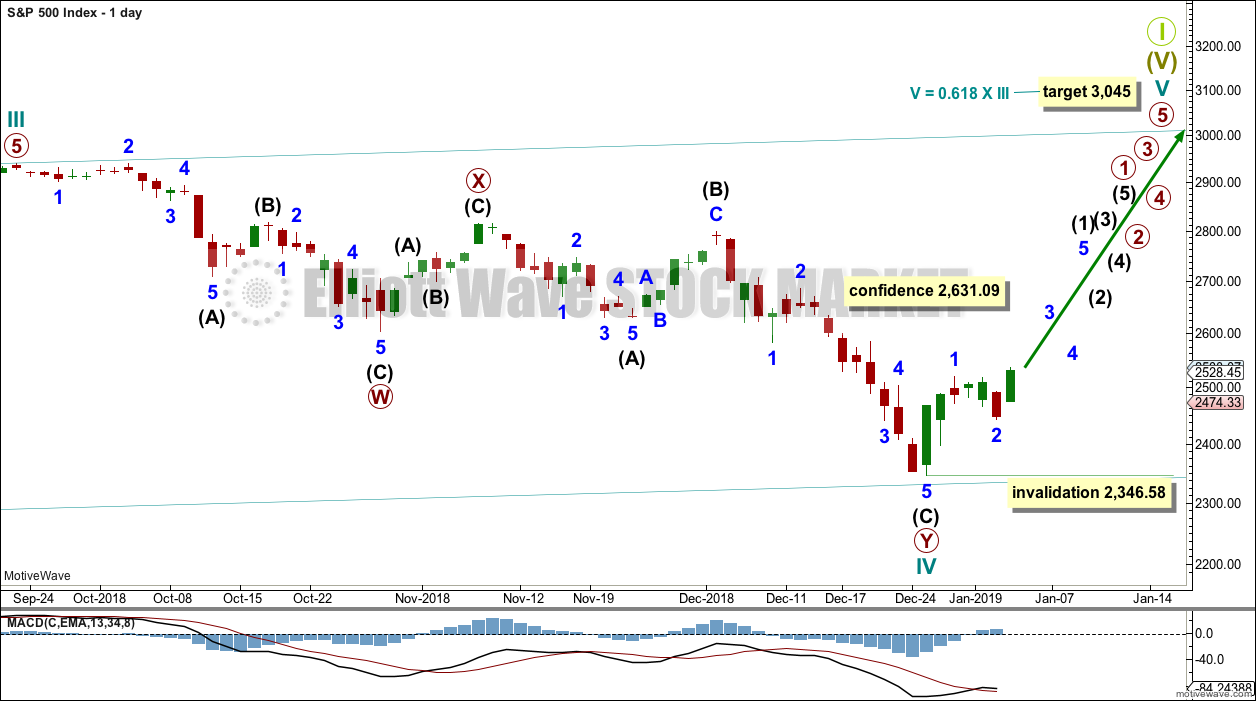
The daily chart will focus on the structure of cycle wave IV.
Cycle wave IV may be a complete double zigzag. This would provide perfect alternation with the combination of cycle wave II. Double zigzags are fairly common corrective structures.
Within Super Cycle wave (V), cycle wave III may not be the shortest actionary wave. Because cycle wave III is shorter than cycle wave I, this limits cycle wave V to no longer than equality in length with cycle wave III at 3,477.39. A target is calculated for cycle wave V to end prior to this point.
Cycle wave V must subdivide as a five wave motive structure, either an impulse or an ending diagonal. An impulse is much more common and that will be how it is labelled. A diagonal would be considered if overlapping suggests it.
Within the five wave structure for cycle wave V, primary wave 1 would be incomplete. Within primary wave 1, intermediate wave (1) may be incomplete. The degree of labelling within cycle wave V may need to be adjusted as it unfolds further.
Within cycle wave V, no second wave correction may move beyond the start of its first wave below 2,346.58.
At this stage, a new high by any amount at any time frame above 2,631.09 would invalidate the alternate wave count below and provide confidence in this main wave count.
HOURLY CHART
Click chart to enlarge.
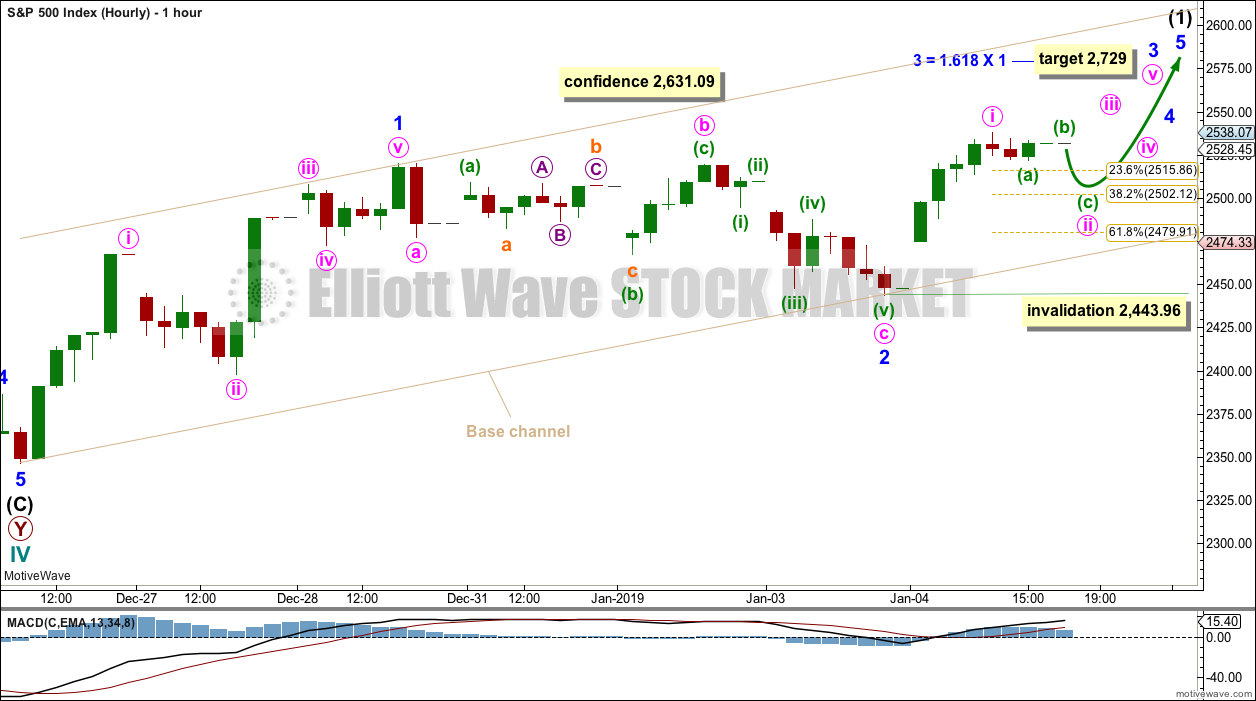
Intermediate wave (1) may be incomplete and may be unfolding as an impulse.
Within the impulse, minor waves 1 and 2 may now be complete. A target is calculated for minor wave 3 which expects the most common Fibonacci ratio to minor wave 1.
Minor wave 3 may only subdivide as an impulse. Within minor wave 3, minute wave ii may not move beyond the start of minute wave i below 2,443.96. Minute wave ii may end about the 0.382 Fibonacci ratio of minute wave i.
Draw a base channel about minor waves 1 and 2 as shown. The lower edge of this channel may provide support for minute wave ii if it is deep.
ALTERNATE DAILY CHART
Click chart to enlarge.
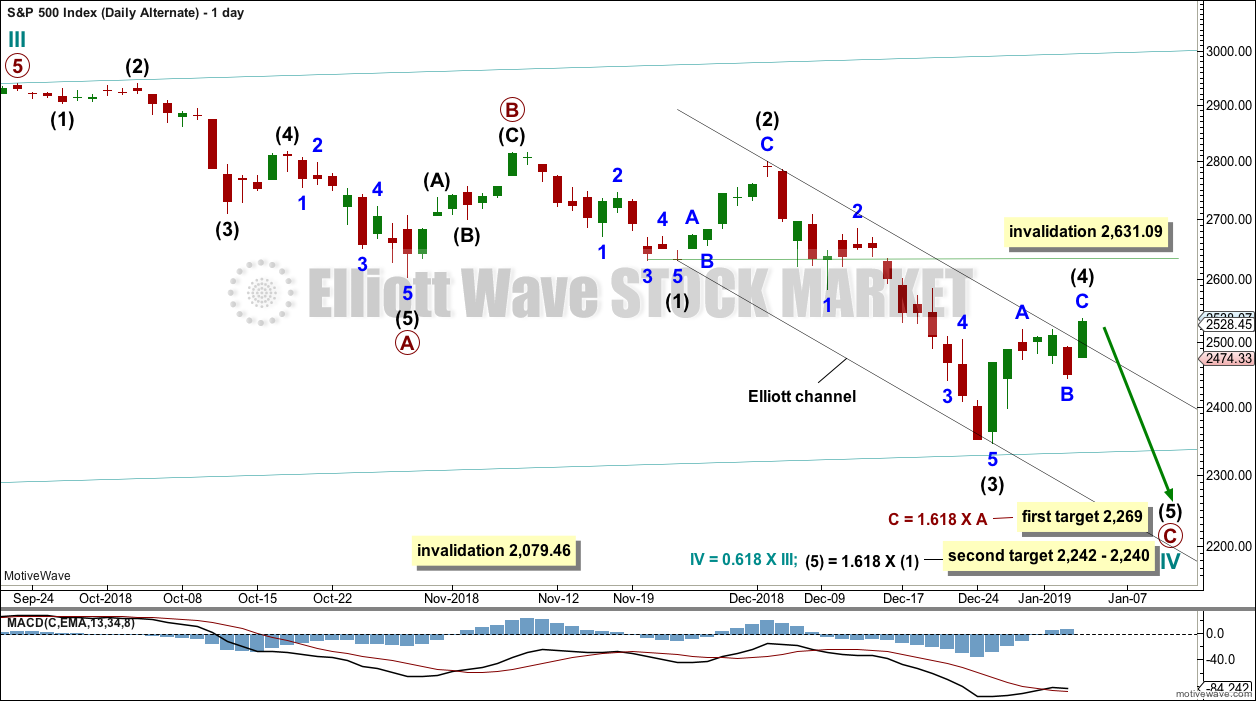
Cycle wave IV may be a an incomplete single zigzag. This would provide perfect alternation with the combination of cycle wave II. Zigzags are the most common corrective structures.
Within this zigzag, primary wave C may be completing as a five wave impulse.
Intermediate wave (2) shows up on the weekly and daily charts. Intermediate wave (4) now also shows on weekly and daily charts. This wave count has the right look.
Intermediate wave (4) may not move into intermediate wave (1) price territory above 2,631.09.
Targets are calculated for cycle wave IV to end. If price gets to the first target and the structure is incomplete, or if price falls through the first target, then the second target may be used.
Draw a channel about primary wave C. Draw the first trend line from the low of intermediate wave (1) to the low of intermediate wave (3), then place a parallel copy on the high of intermediate wave (2). Intermediate wave (4) has now breached the upper edge of this channel. Fourth waves are not always contained within channels drawn using this technique; when intermediate wave (4) may be more clearly complete, then the channel may be redrawn using Elliott’s second technique.
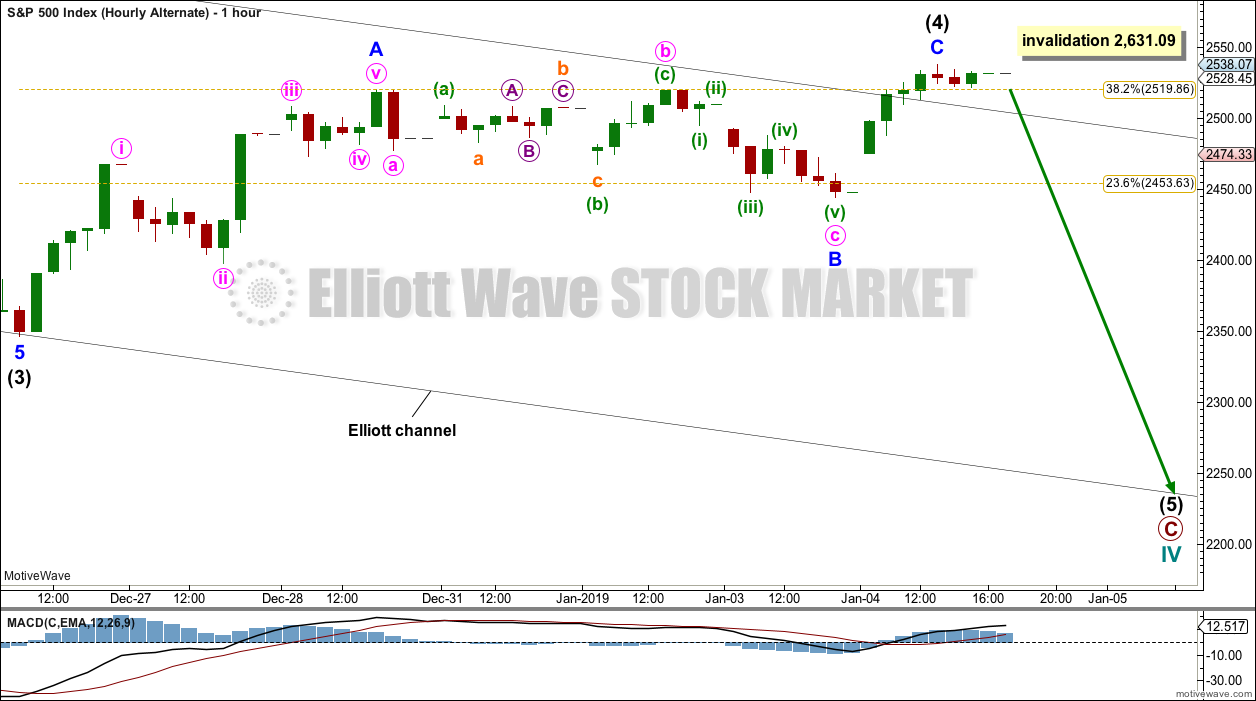
ALTERNATE HOURLY CHART
Click chart to enlarge.
Intermediate wave (4) may be a complete zigzag. Intermediate wave (5) may now begin to move price to new lows.
TECHNICAL ANALYSIS
WEEKLY CHART
Click chart to enlarge. Chart courtesy of et=”_blank”>StockCharts.com.
From the all time high to the low of last week, price moved lower by 20.2% of market value meeting the definition for a bear market.
It should be noted that the large fall in price from May 2011 to October 2011 also met this definition of a bear market, yet it was only a very large pullback within a bull market, which so far has lasted over 10 years.
This week has support from volume and a long lower wick. This is bullish at least for the short term.
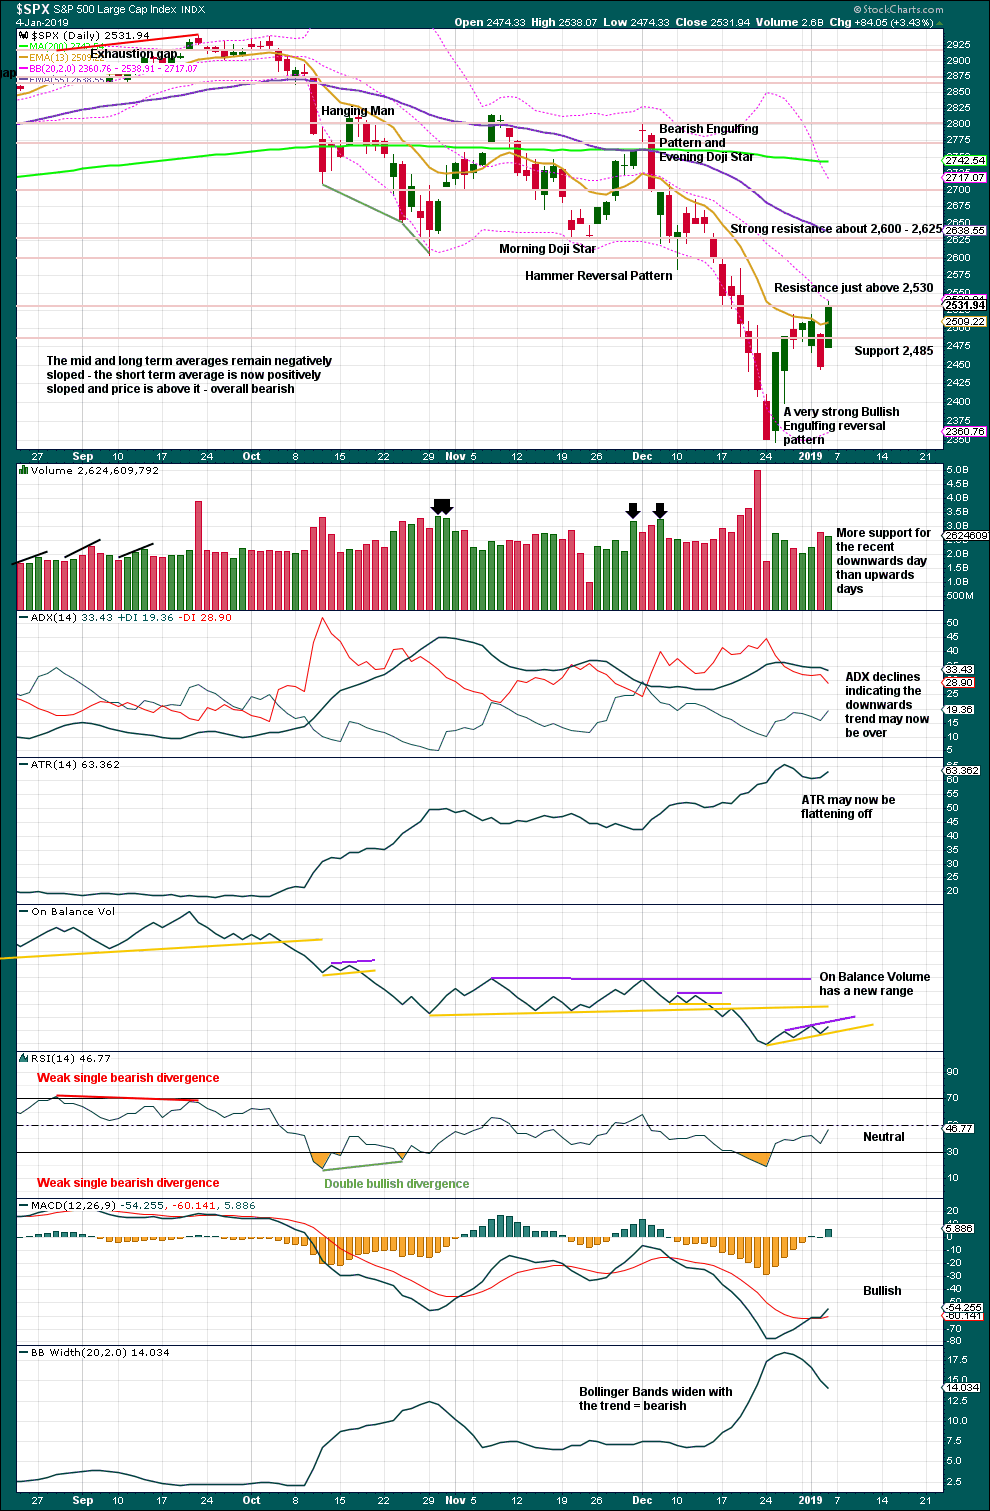
DAILY CHART
Click chart to enlarge. Chart courtesy of StockCharts.com.
Over a fairly long period of time this ageing bull market has been characterised by upwards movement on light and declining volume and low ATR. For the short to mid term, little concern may be had if price now rises again on declining volume. Current market conditions have allowed for this during a sustained rise in price.
Considering the larger picture from the Elliott wave count, some weakness approaching the end of Grand Super Cycle wave I is to be expected.
Friday was a 90% upward day from Lowry’s data. This is an indication of strength underlying this rise in price.
BREADTH – AD LINE
WEEKLY CHART
Click chart to enlarge. Chart courtesy of StockCharts.com. So that colour blind members are included, bearish signals
will be noted with blue and bullish signals with yellow.
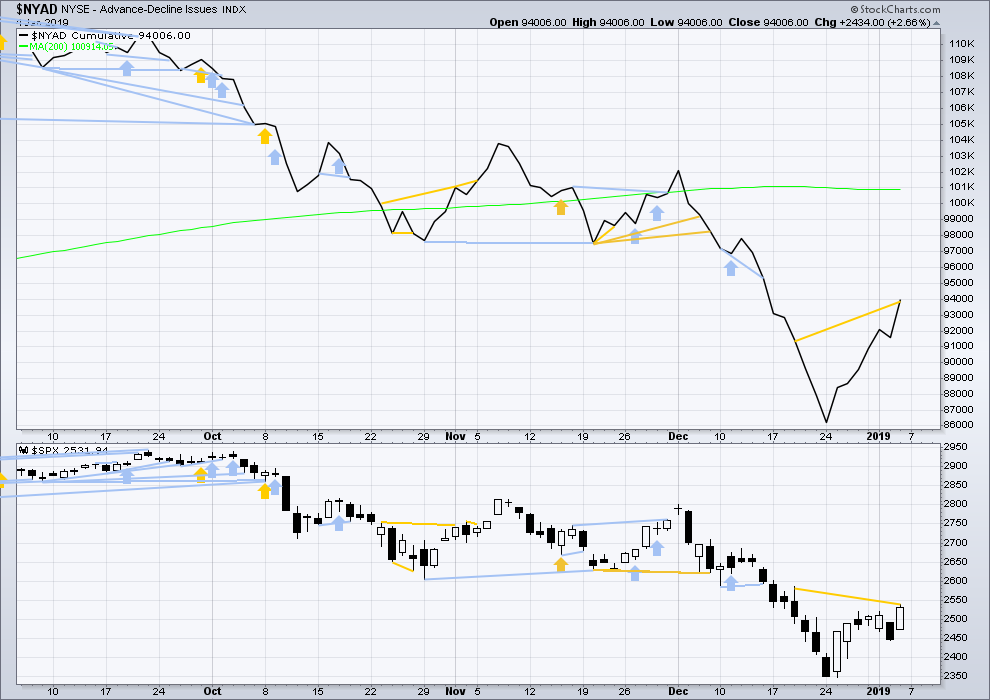
Upwards movement has support from rising market breadth.
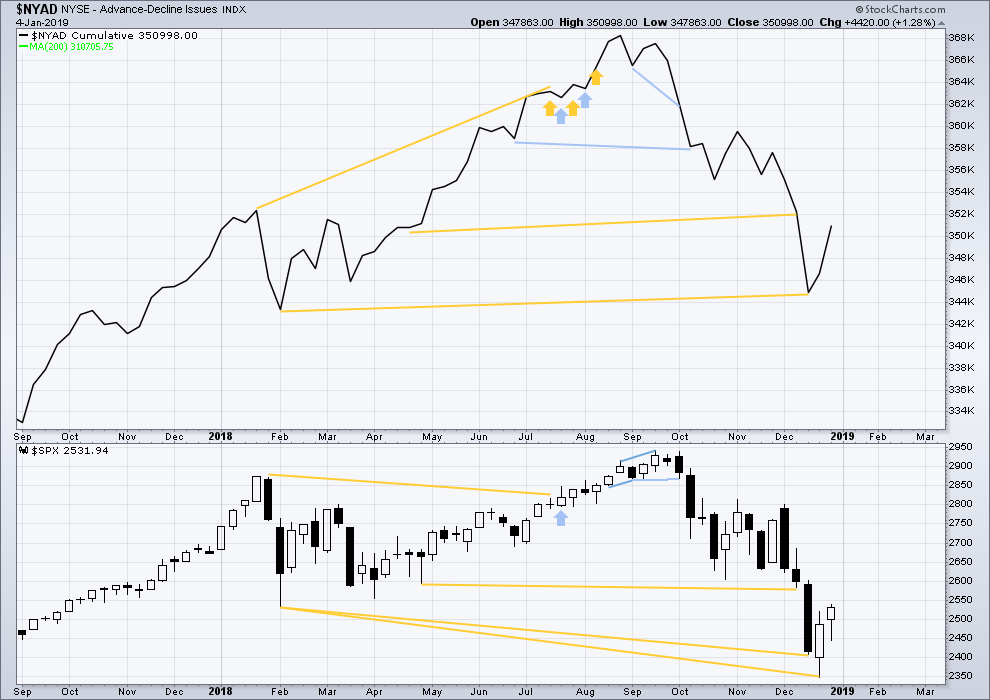
DAILY CHART
Click chart to enlarge. Chart courtesy of StockCharts.com. So that colour blind members are included, bearish signals
will be noted with blue and bullish signals with yellow.
Breadth should be read as a leading indicator.
For the short term, the AD line has made a strong new high above a prior small swing high on the 19th of December 2018, but price has not. This divergence is bullish; the AD line is rising faster than price.
VOLATILITY – INVERTED VIX CHART
WEEKLY CHART
Click chart to enlarge. Chart courtesy of StockCharts.com. So that colour blind members are included, bearish signals
will be noted with blue and bullish signals with yellow.
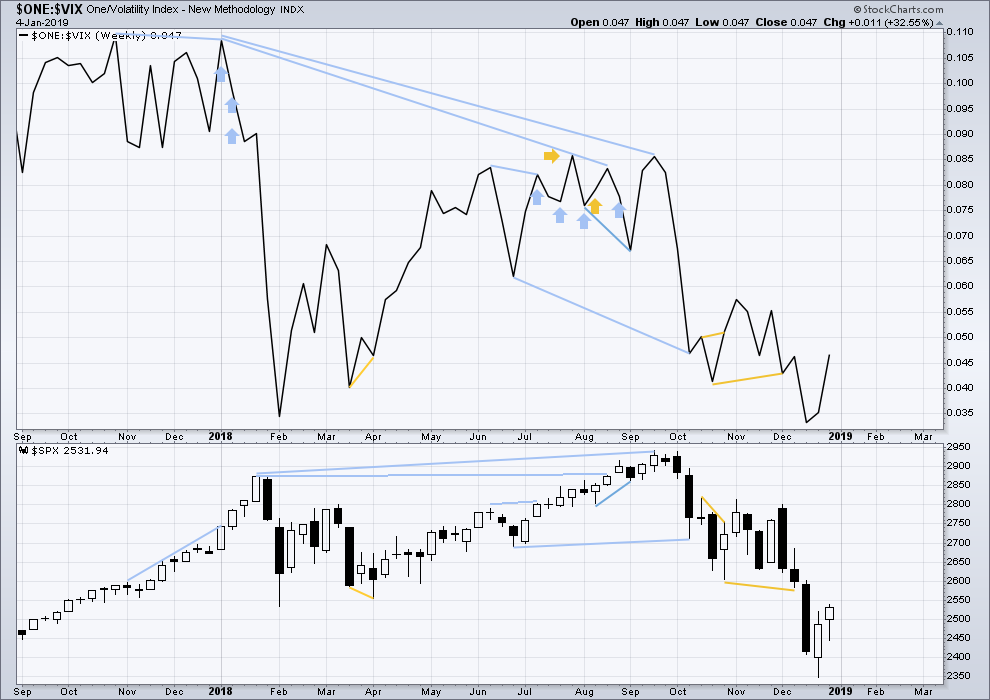
Upwards movement has support from a corresponding decline in VIX. There is no divergence.
DAILY CHART
Click chart to enlarge. Chart courtesy of StockCharts.com. So that colour blind members are included, bearish signals
will be noted with blue and bullish signals with yellow.
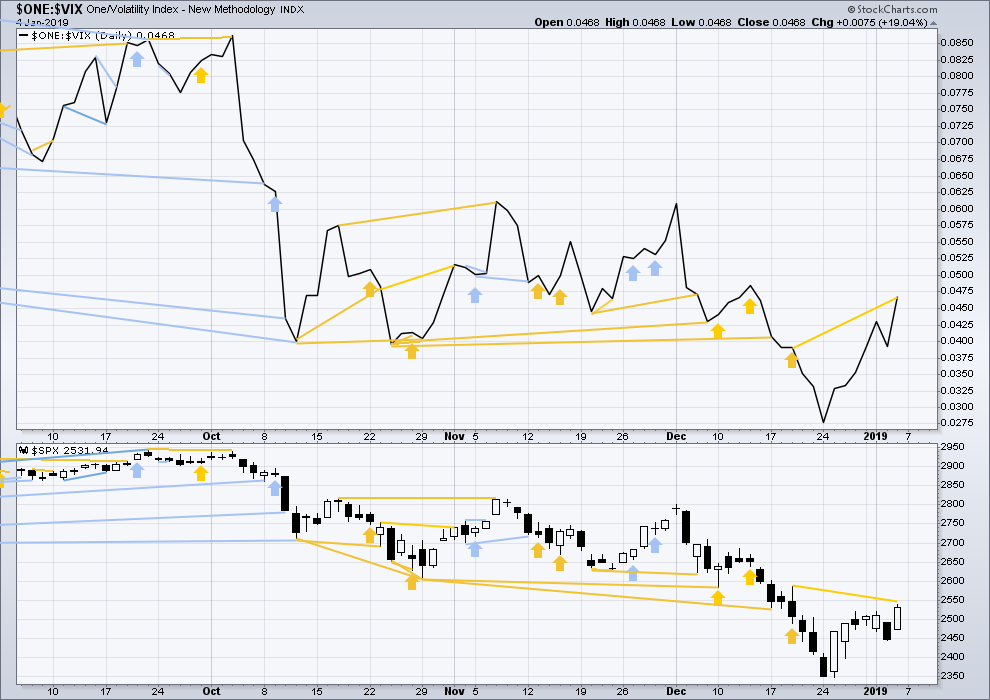
Inverted VIX has made a new high above the prior small swing high of the 19th of December 2018, but price has not. This divergence is bullish.
DOW THEORY
Dow Theory confirms a bear market. This does not necessarily mean a bear market at Grand Super Cycle degree though; Dow Theory makes no comment on Elliott wave counts. On the 25th of August 2015 Dow Theory also confirmed a bear market. The Elliott wave count sees that as part of cycle wave II. After Dow Theory confirmation of a bear market in August 2015, price went on to make new all time highs and the bull market continued.
DJIA: 23,344.52 – a close on the 19th of December at 23,284.97 confirms a bear market.
DJT: 9,806.79 – price has closed below this point on the 13th of December.
S&P500: 2,532.69 – a close on the 19th of December at 2,506.96 provides support to a bear market conclusion.
Nasdaq: 6,630.67 – a close on the 19th of December at 6,618.86 provides support to a bear market conclusion.
Published @ 09:22 p.m. EST.
—
Careful risk management protects your trading account(s).
Follow my two Golden Rules:
1. Always trade with stops.
2. Risk only 1-5% of equity on any one trade.
There is a cluster of 3 fibo’s (62%, 38%, 50%) from 3 different measured moves that price penetrated into and is now sitting on the low side of (2556, 2573, 2582).
This area strikes me as a high potential for a pivot high on the hourly. Turns at clusters are very common. My daily trend has moved to neutral with today’s bar so far, but weekly/monthly are decidedly down trend. Six days now of strong upward movement…might be time for some profit taking.
If price breaks below today’s low, I will tactically short. I don’t expect it, and am ready to participate again/more on the upside. But I’m staying ready to take it the other way for a few hours to days.
I’m fully back this week, normal daily analysis resumes. Luckily (unluckily?) the waves in the ocean are gone, so I don’t have distractions 🙂
Updated hourly chart:
For the main wave count. Minute ii was unexpectedly brief and shallow. Look now for an increase in upwards momentum for the middle of minor wave 3, the strongest part may be the end of minute iii. Look for corrections to continue to be relatively brief and shallow now as it nears the middle of a third wave.
The base channel remains the same. The invalidation point remains the same.
If the SPX closes here (2560 or so) or higher, the Zweig Breadth Thrust Indicator will be triggered. This is a significantly bullish and relatively rare signal. Of course, we must still clear many hurdles most important of which is the 2631.09 invalidation point of the alternate count. But, today’s action is adding to the evidence that an important and at least interim term low has been achieved.
Another piece of bullish evidence that I did not mention was that last week’s closing high was higher than the previous week’s close. This is support for the main count.
I am still aware that a ‘dead cat’ bounce is often seen after a market decline like the one we have experienced in the last three months. So I must remind myself to not get too overly excited with bullish possibilities and remain open to all possibilities.
Let’s see how this session closes.
So far, there is a fair amount of strength in this upwards movement from the low. It’s not looking like a weak Dead Cat Bounce. Not with a 90% up day within it.
One other little piece of bullish evidence: the price advance in SPX off the low has now broken the bearish symmetry through the downmove from the ATH (i.e., it’s the largest counter trend move…and hence, potentially the start of a new trend up).
RUT today also strongly broke bearish symmetry today. NDX is still a tad below its.
But we have this signal….
https://www.zerohedge.com/news/2019-01-07/gartman-makes-watershed-bullish-call-game-has-changed-stocks-are-headed-higher
Scott,
How are you interpreting this signal / article?
Hi Rodney
Gartman is notorious for his terrible public calls at all the wrong times …
I was having a little fun
https://www.google.com/amp/s/seekingalpha.com/amp/article/4072588-oops
Just some background 🙂
GLD tagged and is stalling just under a major 61.8% treace of the Apr’18 high to Aug’18 low (weekly shown). High reward/risk spot for a short…but counter-trend (monthly neutral, weekly strong up, daily strong up, hourly is neutral).
2555 is the 61.8% retrace of the 12/12 to 12/26 move down and has real potential to form a pivot high.
The swing highs and lows around 2579 (12/10 and 12/19) look like the next likely resistance. After that, the next high potential pivot high price is 2613, the 78.6% of the 12/12-26 downswing.
I have discovered my charting software has the Heikin-Ashi chart style available. I will start playing around with it as time allows. Thanks people.
And here is the Heikin-Ashi chart
Thanks to you too chartmonkey along with all the others who are new to posting here. I am not familiar with Heikin-Ashi charts. A brief introduction would be helpful and appreciated. Thanks again for your posts. Keep it up.
I’ve been using Heikin-Ashi bars quite extensively for the last year or so. They depict an averaged representation of price action that filters out some noise. But most helpful to me, they help guide me in setting stops to exit trades.
Hi Rodney,
I think of the Heikin-Ashi candlesticks as synthetic candlesticks. Once a candlestick has completed, then the next candlestick’s real body begins from the middle of the completed candlestick’s real body … and so on and so on.
The trick here is realizing that a Heikin-Ashi candlestick might not display the actual trading range for that candlestick’s time period. If the candlestick has shadows above and below its real body, then you are looking at the entire range from high to low. However, if it has a flat top or a flat bottom then it may have traded in a smaller range than the area that the candlestick covers on the chart.
Another thing that’s unusual is the candlestick will change its shape a few seconds before its time frame will finish. Previous candles are used to generate the final print of a Heikin-Ashi candlestick.
These things are great for showing trends! They are a very useful smoothing tool. I bet that your charting software has this option. If you dig around it’s probably in there somewhere!
PS — tons of stuff online about Heikin-Ashi
The reason Heikin-Ashi candlesticks are so helpful in seeing trends is because of this characteristic.
Picture any two sequential candlesticks in a series of candlesticks. We’ll call them “the previous candlestick” and “the next candlestick”. Find the exact middle of the “previous candlestick’s” real body and draw a horizontal line through that point.
The following rule is always true:
The “next candlestick’s” real body can only exist either above the horizontal line or below the horizontal line, but never both above and below.
When a trend develops, the chart shows a series of red real bodies going down or a series of green real bodies going up.
Cool stuff. So easy that even a chart monkey can see it!
To bring it full circle, Heikin-Ashi candlesticks are useful to me because they make it easier to identify waves. That’s my reason for including the chart above. Intermediate waves 1 through 4 really pop for me on a daily Heikin-Ashi chart. On the above chart you can also see the alternation between wave 2 and wave 4. Wave 2 looks like it’s arching backwards, while wave 4 looks like it is bowing forward.
Smaller timeframe Heikin-Ashi charts are helpful in highlighting shorter duration waves. For me, this makes counting easier and boosts my overall confidence.
Hi,
I’m brand new to the site, like measured in hours new. I’m uncertain of the protocols regarding posting. If I’m crossing a line, please let me know.
I have a spin on the S&P 500 alternate daily chart. My chart is attached. I’m seeing a bit of a different trend channel. First different thing is that I use an arithmetic chart for this, so, no log chart. Next different thing is that I use the November 20 low, not the November 23 low.
I’m ignoring the November 23 data because:
• It was a half day of trading
• The 22nd was a U.S. holiday and the 24th was a Saturday
• The volume on the 23rd was the lowest daily volume in the last 3 months
• The difference between the two lows is .43 of a point ( the November 20 range, for example, was 37.92 points )
My approach is not entirely pure, and the chart is more art than science. I have also attached the same chart using Heikin-Ashi candlesticks. I find it easier to follow trends with Heikin-Ashi. But I am still holding out hope of finding point (4) and starting the 5th wave downwards. Are we at point (4)? Looking forward to an interesting week!
I like your channel.
Flexibility with drawing channels is entirely reasonable IMO.
Welcome to EWSM and this forum. You’ll find a bunch of very experienced traders here who are kind enough to share their knowledge. The comments policy is pretty simple, but really strict on tone. The bottom line, if you wouldn’t say it like that to your beloved Grandmother, don’t say it here. Most people are awesome with this guideline, and it means everyone is comfortable to share their ideas without fear of mean responses.
: )
The Zweig Breadth Thrust Indicator is a hair’s breadth (or is it a hare’s breadth) away from triggering a very bullish signal. I understand that it must do so within a ten day time frame which ends Wednesday of next week. Here is a brief explanation:
——————————————————————————————–
“To generate a signal, the 10-day EMA of NYSE Advances divided by Advances plus Declines needs to go from below 0.40 to above 0.615 within 10 trading days. The idea is that a sudden swing from really negative breadth to really positive breadth is a sign of initiation of a strong new rally.”
https://recessionalert.com/zweig-breadth-thrust-redux/
———————————————————————————————–
The indicator is currently at 0.58. If we have a couple more solid up days, it is most likely to exceed 0.615 and trigger the signal. This would be a very powerful bullish signal lending significant support to the main count. If it triggers, I will not be surprised to see new ATH’s. Nor would I be surprised to see the SPX make it near Lara’s limit to Cycle V of 3477.
By the way, the link above is to an article that is a good primmer on the subject as well as introducing two modified versions of the ZBTI. And NOTE: the ZBTI is not perfect just like all other indicators. But it is one piece of evidence to be taken seriously.
Until the 2631 price point is exceeded, however, I am approaching this move up with a healthy dose of suspicion. If we get the Zweig Breadth Thrust signal next week and then exceed 2631, I will be quite confident we are headed to 3000+ on the SPX.
Finally, the next good opportunity to enter long positions will come at the low of Minutte ii as shown on the main hourly chart. This will be around 2500. I suspect it will come Monday. Just my thoughts and never to be taken as trading / investing advice.
Thanks Rodney for that. That’s not one I’ve heard of before (at least not that I remember) but the premise certainly looks sound.
It’s quite similar to what Lowry’s are looking for right now. A 90% down day at or just before the low, or a few 80% down days. Followed by a low, then a 90% up day.
That’s what we have now after Friday.
I deleted the repost now that the original is published.
Thanks Rodney for the infor.
Rodney, interesting stuff. I’m wondering if the ZBTI could generate a false positive because of end of month/quarter/year shuffling and beginning of month/quarter/year gusher of fresh money flow. Please let us know what you’re keeping an eye on.
Posted last week and I don’t post very often-I said that we had a short term low due to all the pessimism. I said the first stage of the rally would be rebalancing from the big boys(mutual funds) and tax selling was ending. The second stage would be some the type of resolution from the Fed-which is now more accommodating and next week if we get any good news from the US-China meeting would be the next catalyst since a lot of investors are off side. Once everybody including CNBC say that the bottom is in…I’ll be taking all my chips off the table from my longs and start shorting the market based on resistance levels and Lara’s great analysis! I trade on TA not emotions-with stops. Just my 2cents as a trader for 27 years.
Thanks for posting rvila. It is certainly true that we had a slew of bad news / reports through Nov. & Dec. of last year. It has been a negative onslaught. The percentage bears last week and before was quite high relatively with very few bulls. If I recall properly it was similar to 2009-2009. I suppose Cycle degree waves can produce such pessimism. Thanks for you posting and I look forward to hearing from you again.
Hi Rvila I am resonating with your read. Ty for the confirmation. Lets see if we r right.
Kevin (new guy see other post)
It looks like today’s gap up won’t be closed until P5 is over. I don’t see minute 2 coming down to close the gap from today…
And minor 2 did it’s job as a second wave correction. Most people (including myself) thought we would at least retest the lows, if not go lower. Very unlikely after today…
I wonder if Verne is a Bull at the moment opening bullish positions. Hmmmm 🙂
Hey Ari u presented some interesting questions.
Shouldnt we have retested the lows?
Yes of course. On some counts. But not on my count. At least not yet. We will be retesting later, in the c wave down. Right now we are at the bottom of an a wave. Either from 1/22/18 or 10/1/18. Thats why u can see 535’s all over the place. Up and down. People are seeing them as 123’s so they make the wave fit the count. Lara catches most of them on her alternate counts. Try looking for single zig zags combined with doubles and c what you come up with. I admit I came up with a big dead cat. That was Thursday afternoon when I was short tech like everybody else. I sold my paltry but saught after positions and got ilong tech with TECL. Yeah its leveraged. So I avoided a big loss day yesterday and nailed a nice gainer. Took some profits after the first 535 up, and the rest is parlayed into the next one.
Anyway Im new here too so hey chartmonkey ur a regular now and im the new guy so congratulations. Lmk what u think about my answer ari meanwhile i wii reread your other question. I remember that tghey both struck on important points that i have been using as landmarks.
I hope everyone has a great Sunday. Lot of upside out there. Im actually thrilled to be submitting a post. Not something i normally do. Thank you guys for having the open forum. I appreciate the nod to civility in the forum style. Maybe thats whi i finally posted something somewhere.
Timo
Timo is my spiritual name. I usually am called Kevin in America.
Well Kevin-Timo, thanks for your post and welcome to all the new members posting. I appreciate it greatly. Over the years I have learned a lot from posts on this forum. I am always interest in what others are thinking.
Thanks Rodney very nice to b here. I actually thought my comments might not get posted but i just saw they were so i am reminded that i judge myself so much more harshly than others do. Now i can c how i was more arrogant than immoderate.
I feel kind of funny about having a different count so i become arrogant go figure right.
Anyway i have us on a c wave of an abc of the first abc back up.
I am looking for a double zigzag since it would fit the pattern . Alternation between a and c waves seems fairly consistent. A double zigzag tending to partner up with a single zigzag.
At the same time, I am watching for confirmations of your count as well since i cant help myself. But somehow i feel so sure that i tapped into some kind of social psychology read-i mean those go in 5 waves too right-and i have become totally convinced that i am actually tracking this index.
And the only kind of footprints i am finding are 535 and not 12345 with a first wave as big as most third waves. Third waves are bigger. period. So that means u have a 12 12 and lookin for a third of a third which is exciting however, one day u notice that this is not how a corrective wave normally behaves. Omg its a basing wave. Its all 535 waves. U checkk your momentum indicators and get consistent confirmations. And your macd offers longer term confirmations. So my question to myself now is just how much is this abc avalanche that finally just ended after weeks and weeks of puking going to tolerate a correction before it heaves again. Sorry for the graphic nature of the images, but niothing less offensive properly reminds of the true nature of the disease in the markets. Right? Or am I reading more into these huge monthly red candles than is actually there.
OK then Rodney I will keep an eye for your reads it looks like we r both expecting upside movement for tomorrow and i think Lara as well and Rvila if im not mistaken. So remember to take profits, and heres to an up day for all of us.
Timo
Welcome Timo to the forum.
I will ask please that if you are outlining an alternate Elliott wave count that you do so with a chart. It’s in the comments guidelines.
I find it very difficult to consider an idea without a chart, and lots of others are the same.
Cheers