
Two Elliott wave counts are published now for members. The main Elliott wave count has slightly more support from classic technical analysis.
Summary: A low may now be in place. Confidence in this view may be had if price makes a new high above 2,631.09. It it does, then at that stage the target would be 3,045 with a limit at 3,477.39.
The alternate wave count expects one more low before cycle wave IV is complete. Targets are either 2,269 or 2,242, although when intermediate wave (4) may be complete the target would be recalculated.
New updates to this analysis are in bold.
The biggest picture, Grand Super Cycle analysis, is here.
The monthly chart was last published here.
MAIN ELLIOTT WAVE COUNT
WEEKLY CHART
Click chart to enlarge.
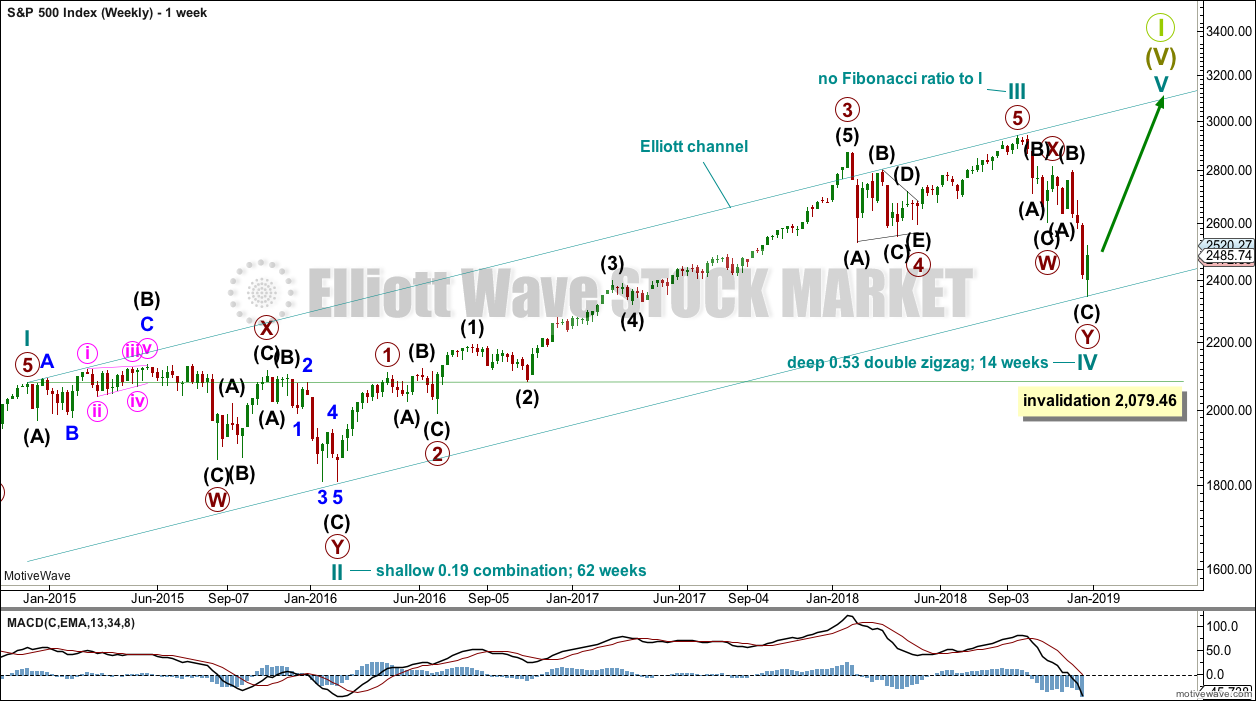
This weekly chart shows all of cycle waves II, III and IV so far.
Cycle wave II fits as a time consuming double combination: flat – X – zigzag. Combinations tend to be more time consuming corrective structures than zigzags. If cycle wave IV completes as a single or multiple zigzag, then it should be expected to be more brief than cycle wave II.
Cycle wave IV may have ended at the lower edge of the Elliott channel. Fourth waves are not always contained within Elliott channels. If the alternate daily wave count below is correct, then cycle wave IV may breach this channel.
Cycle wave IV may not move into cycle wave I price territory below 2,079.46.
Although both cycle waves II and IV are labelled W-X-Y, they are different corrective structures. There are two broad groups of Elliott wave corrective structures: the zigzag family, which are sharp corrections, and all the rest, which are sideways corrections. Multiple zigzags belong to the zigzag family and combinations belong to the sideways family. There is perfect alternation between the possible double zigzag of cycle wave IV and the combination of cycle wave II.
Draw the Elliott channel about Super Cycle wave (V) as shown. Cycle wave V may find resistance about the upper edge.
DAILY CHART
Click chart to enlarge.
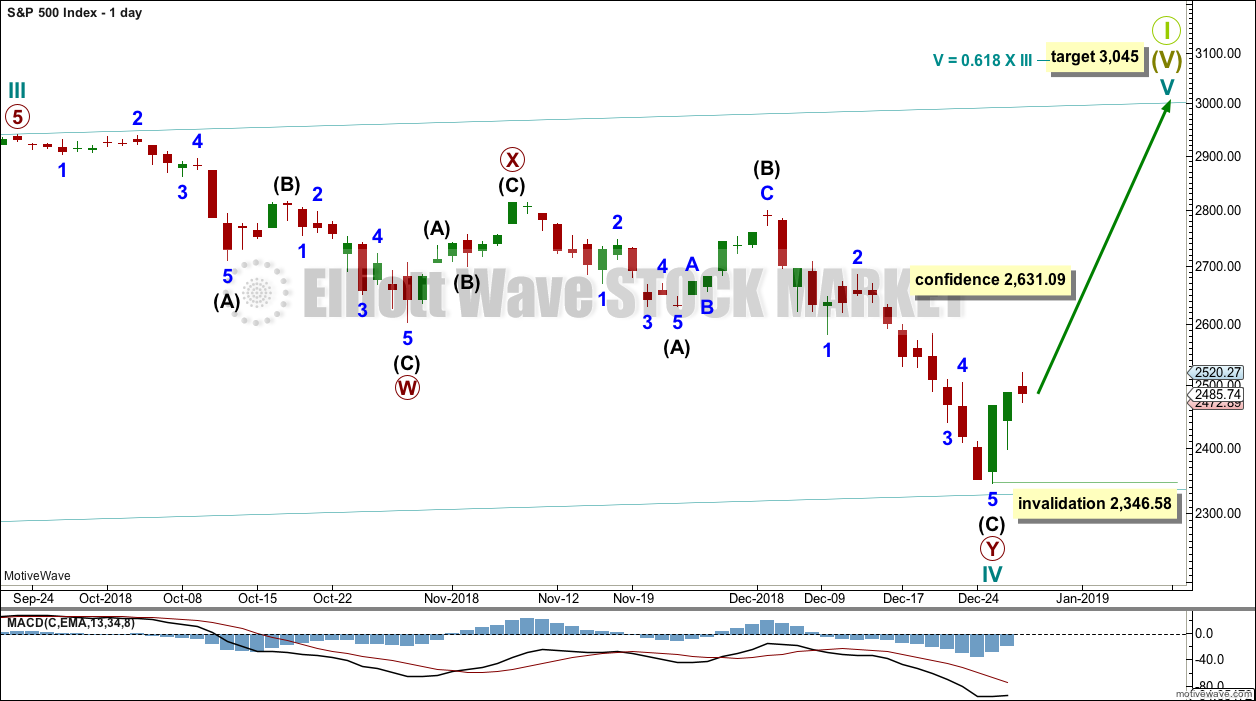
The daily chart will focus on the structure of cycle wave IV.
Cycle wave IV may be a complete double zigzag. This would provide perfect alternation with the combination of cycle wave II. Double zigzags are fairly common corrective structures.
Within Super Cycle wave (V), cycle wave III may not be the shortest actionary wave. Because cycle wave III is shorter than cycle wave I, this limits cycle wave V to no longer than equality in length with cycle wave III at 3,477.39. A target is calculated for cycle wave V to end prior to this point.
Within cycle wave V, no second wave correction may move beyond the start of its first wave below 2,346.58.
At this stage, a new high by any amount at any time frame above 2,631.09 would invalidate the alternate wave count below and provide confidence in this main wave count.
HOURLY CHART
Click chart to enlarge.
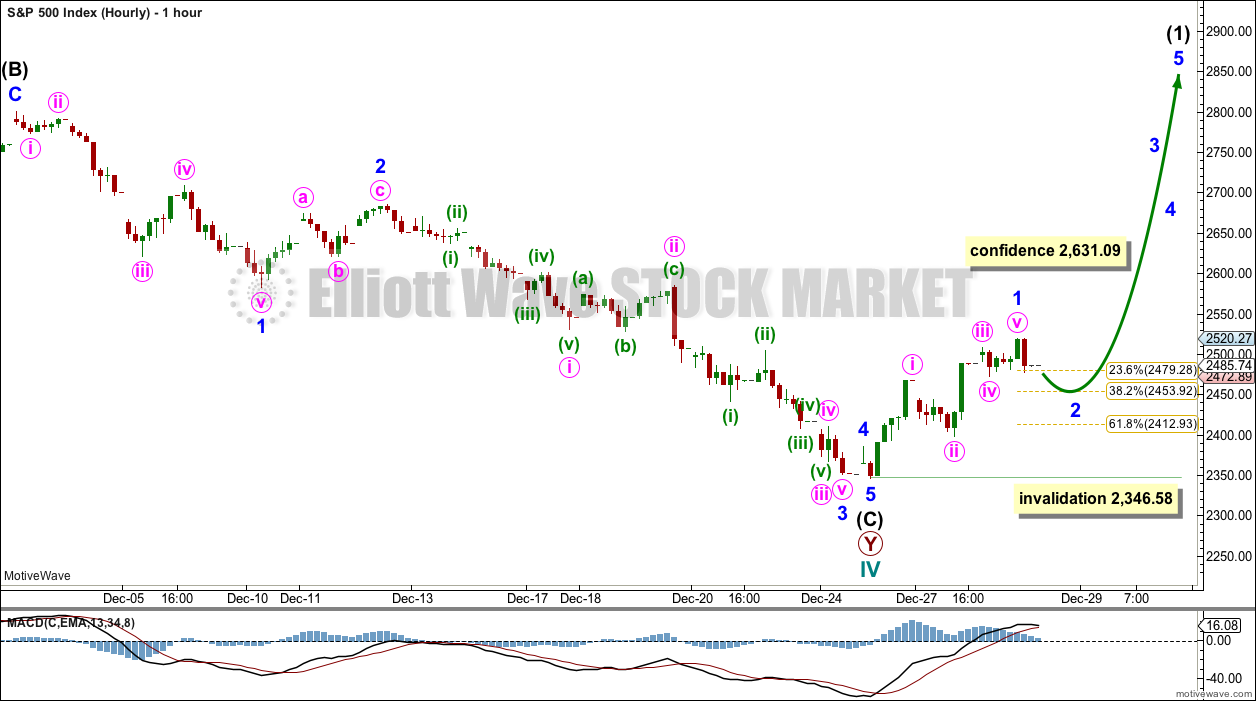
A five wave impulse within the new upwards trend may be complete for minor wave 1.
Minor wave 2 may move a little lower when markets open next week. Both the 0.382 and 0.618 Fibonacci ratios are targets.
Minor wave 2 may not move beyond the start of minor wave 1 below 2,346.58.
ALTERNATE DAILY CHART
Click chart to enlarge.
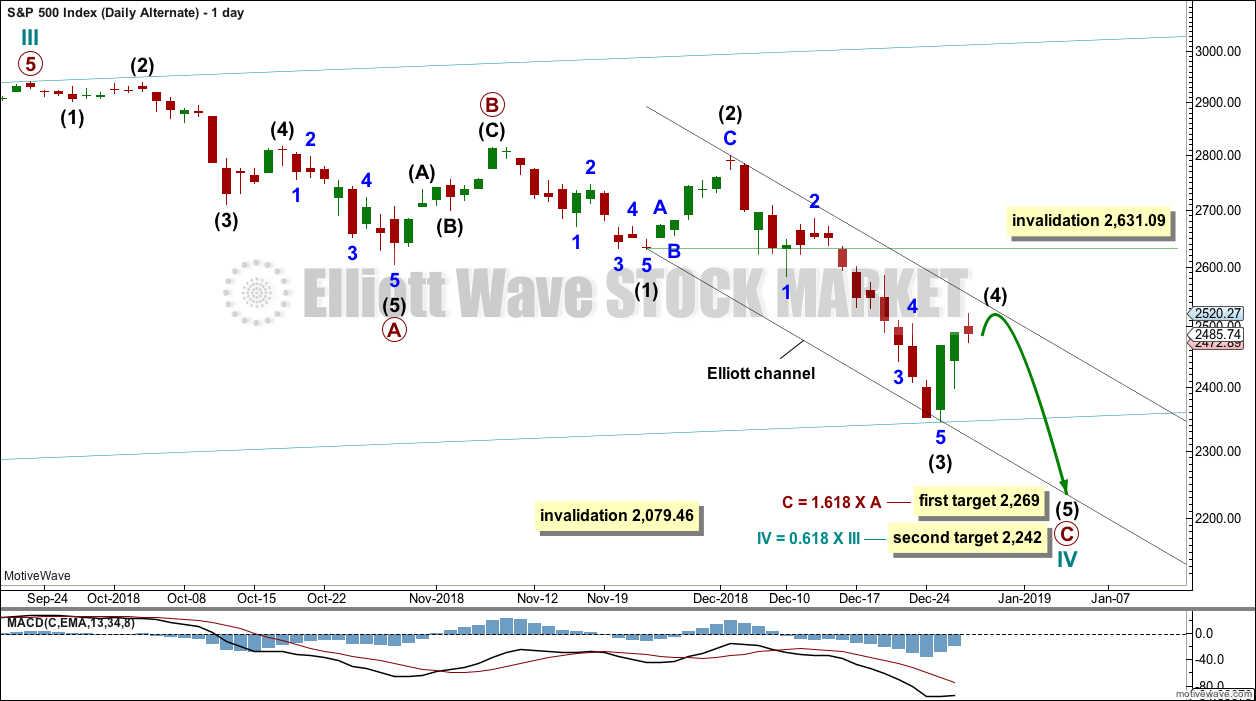
Cycle wave IV may be a an incomplete single zigzag. This would provide perfect alternation with the combination of cycle wave II. Zigzags are the most common corrective structures.
Within this zigzag, primary wave C may be completing as a five wave impulse.
A target is calculated for intermediate wave (3) to end using the most common Fibonacci ratio to intermediate wave (1).
Intermediate wave (2) shows up on the weekly and daily charts. Intermediate wave (4) now also shows on weekly and daily charts. This wave count has the right look.
Intermediate wave (4) may not move into intermediate wave (1) price territory above 2,631.09.
Targets are calculated for cycle wave IV to end. If price gets to the first target and the structure is incomplete, or if price falls through the first target, then the second target may be used.
When intermediate wave (4) may be complete, then the target may be calculated also at intermediate wave degree. The target may change at that stage.
Draw a channel about primary wave C. Draw the first trend line from the low of intermediate wave (1) to the low of intermediate wave (3), then place a parallel copy on the high of intermediate wave (2). Intermediate wave (4) may find resistance about the upper edge of the channel.
ALTERNATE HOURLY CHART
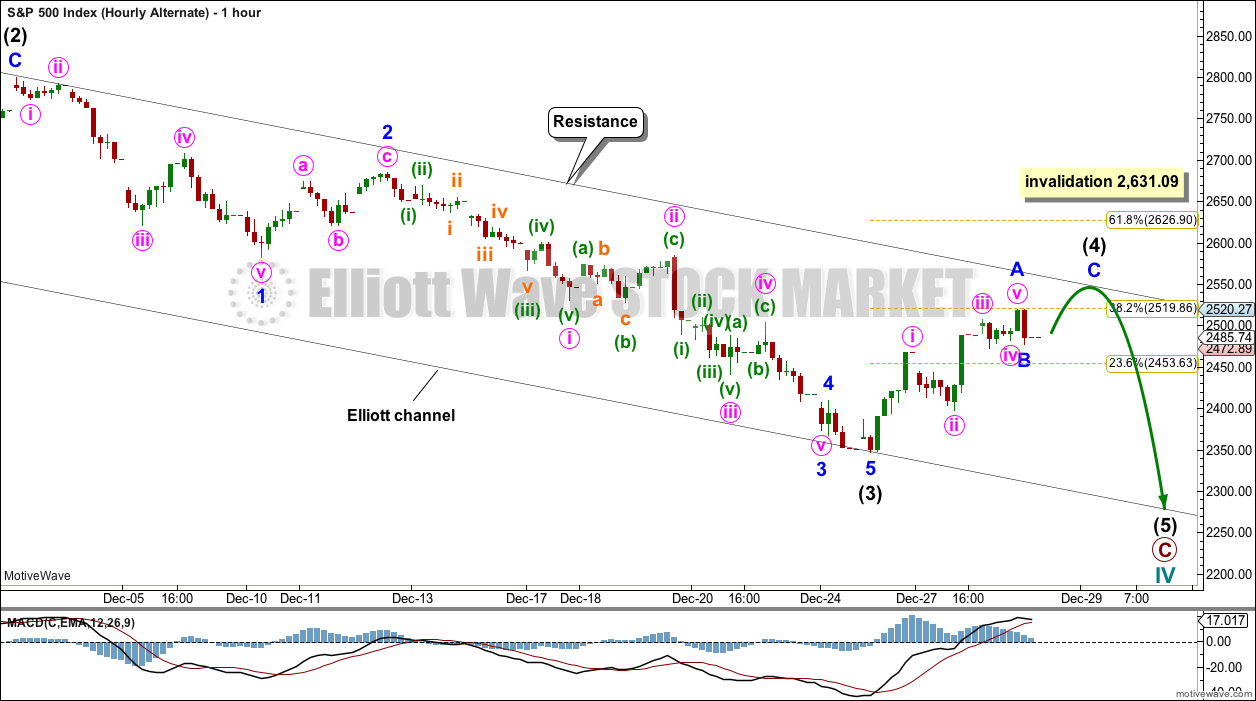
Click chart to enlarge.
Intermediate wave (4) may be unfolding as a zigzag. Within intermediate wave (4), minor waves A and B may be complete. Minor wave C may find resistance about the upper edge of the black Elliott channel.
TECHNICAL ANALYSIS
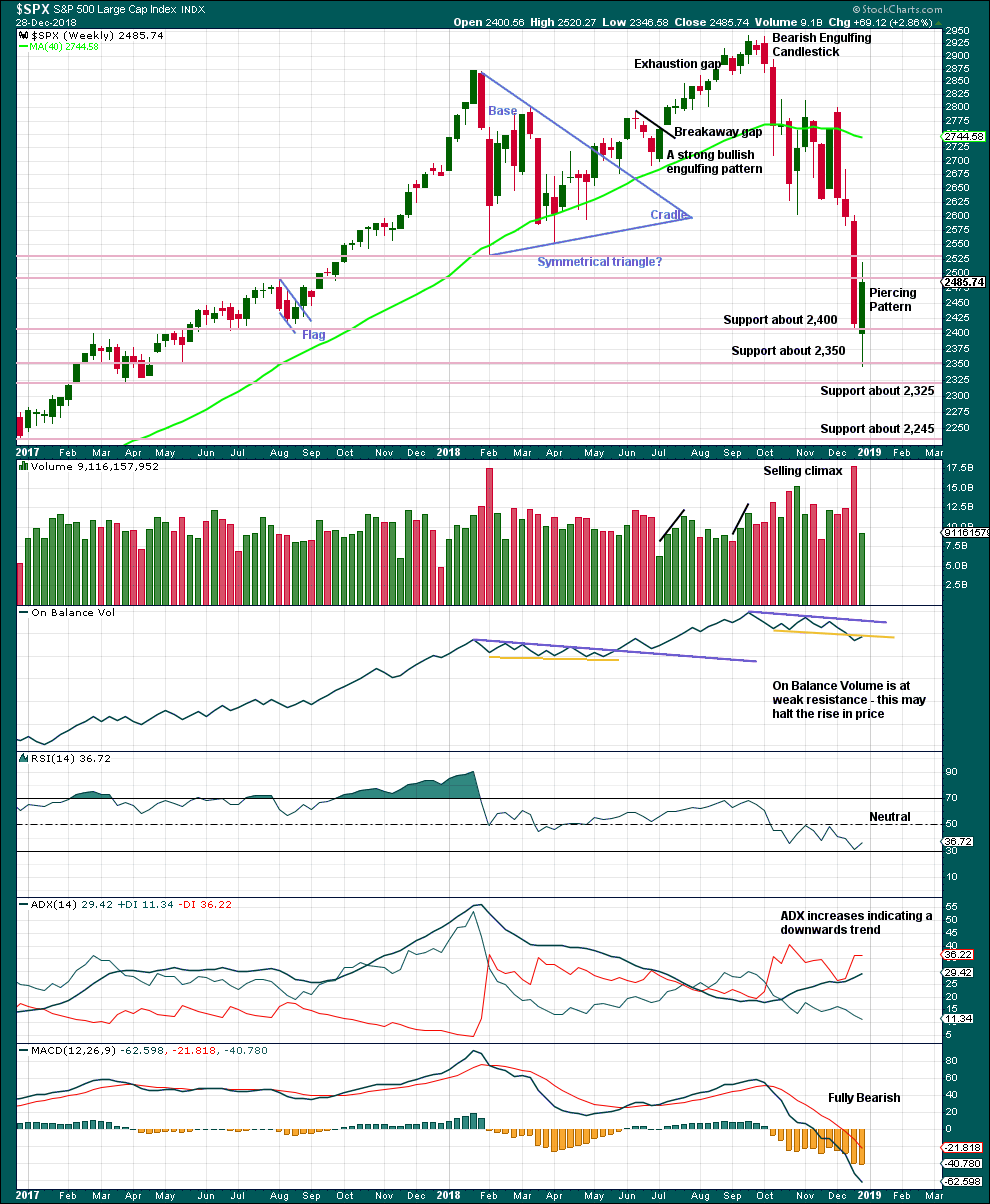
WEEKLY CHART
Click chart to enlarge. Chart courtesy of et=”_blank”>StockCharts.com.
From the all time high to the low of this week, price moved lower by 20.2% of market value meeting the definition for a bear market.
It should be noted that the large fall in price from May 2011 to October 2011 also met this definition of a bear market, yet it was only a very large pullback within a bull market, which so far has lasted nearly 10 years.
This weekly candlestick completes a bullish reversal pattern. The long lower wick is also bullish.
The yellow resistance line on On Balance Volume may be too weak for reasonable technical significance.
DAILY CHART
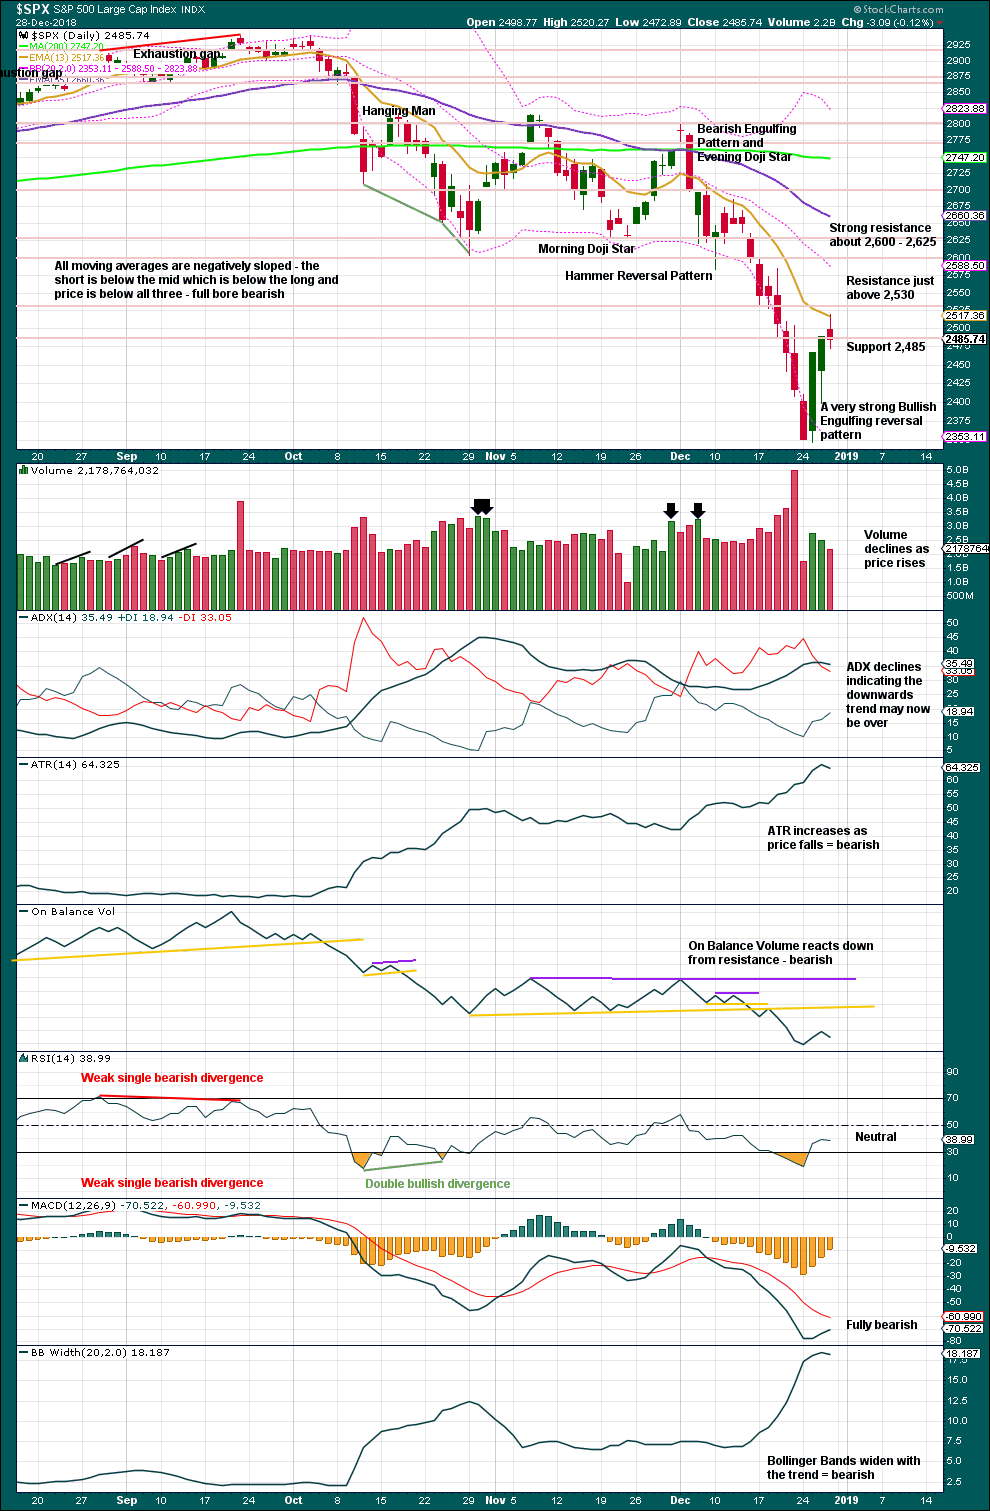
Click chart to enlarge. Chart courtesy of StockCharts.com.
There is a strong bullish candlestick reversal pattern at the low. The 26th of December completed a 90% upwards day; this is a signal to look for at a low. This supports the main Elliott wave count.
There is some slight concern over weak volume for the last two sessions, but this may be again a feature of this ageing bull market. The short-term volume profile would support the alternate Elliott wave count.
BREADTH – AD LINE
WEEKLY CHART
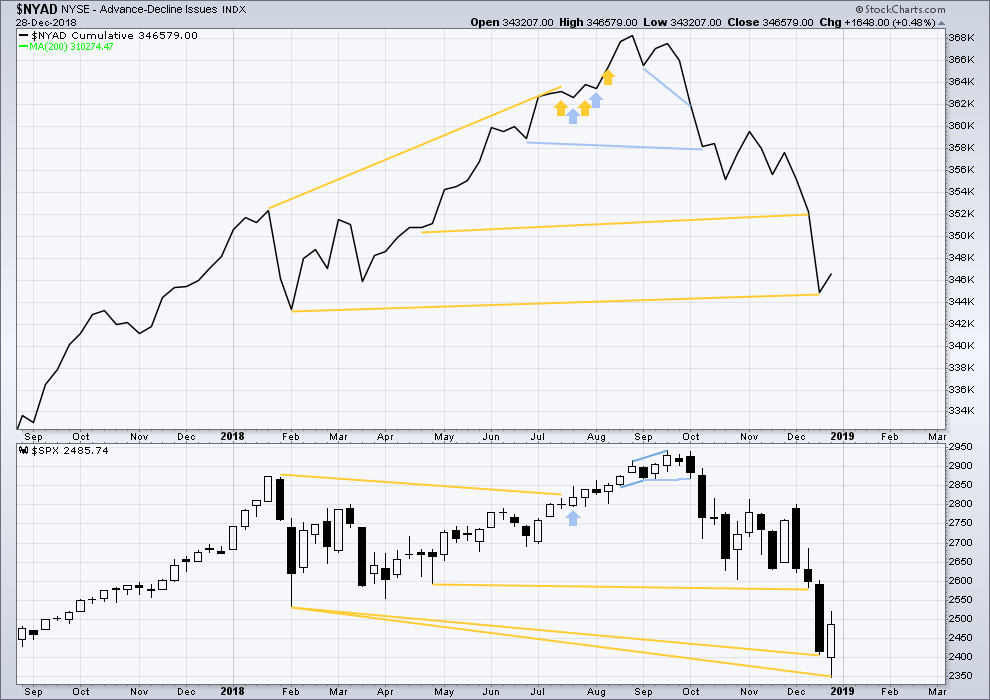
Click chart to enlarge. Chart courtesy of StockCharts.com. So that colour blind members are included, bearish signals
will be noted with blue and bullish signals with yellow.
While price is falling fast, the AD line is not making corresponding new lows. There remains mid-term bullish divergence between price and market breadth.
DAILY CHART
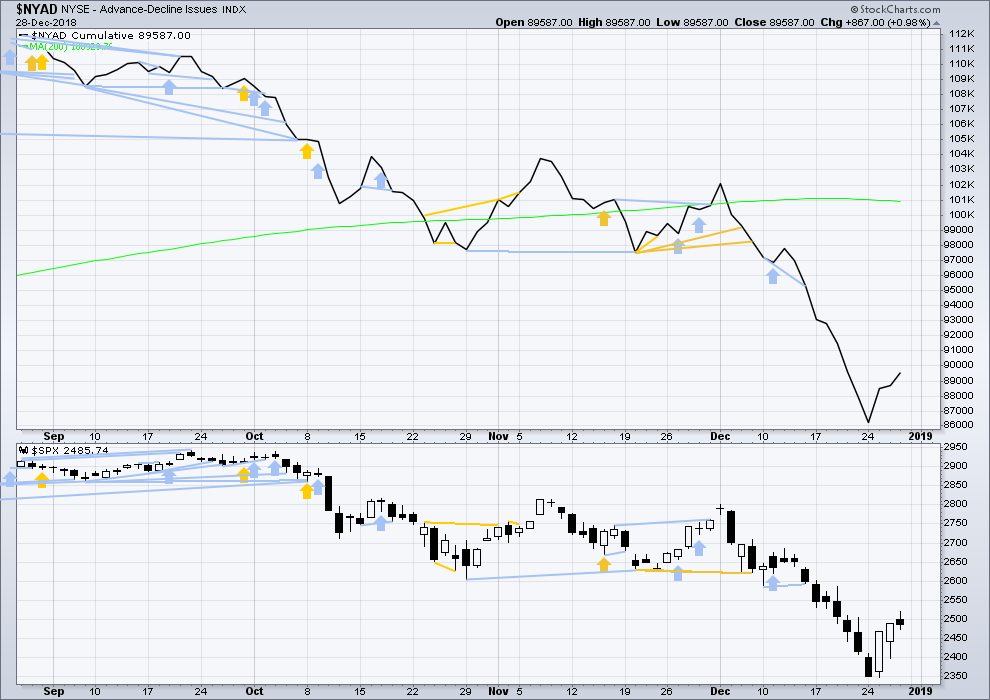
Click chart to enlarge. Chart courtesy of StockCharts.com. So that colour blind members are included, bearish signals
will be noted with blue and bullish signals with yellow.
Breadth should be read as a leading indicator.
For the short term, there is no divergence between price and the AD line.
VOLATILITY – INVERTED VIX CHART
WEEKLY CHART
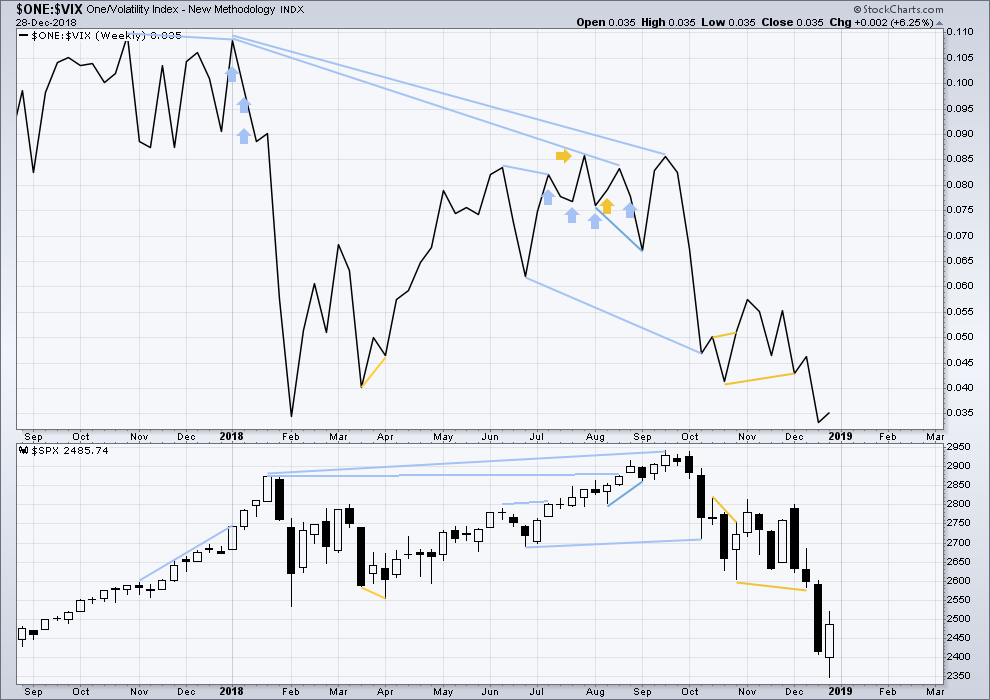
Click chart to enlarge. Chart courtesy of StockCharts.com. So that colour blind members are included, bearish signals
will be noted with blue and bullish signals with yellow.
There is no divergence as both inverted VIX and price make new lows.
DAILY CHART
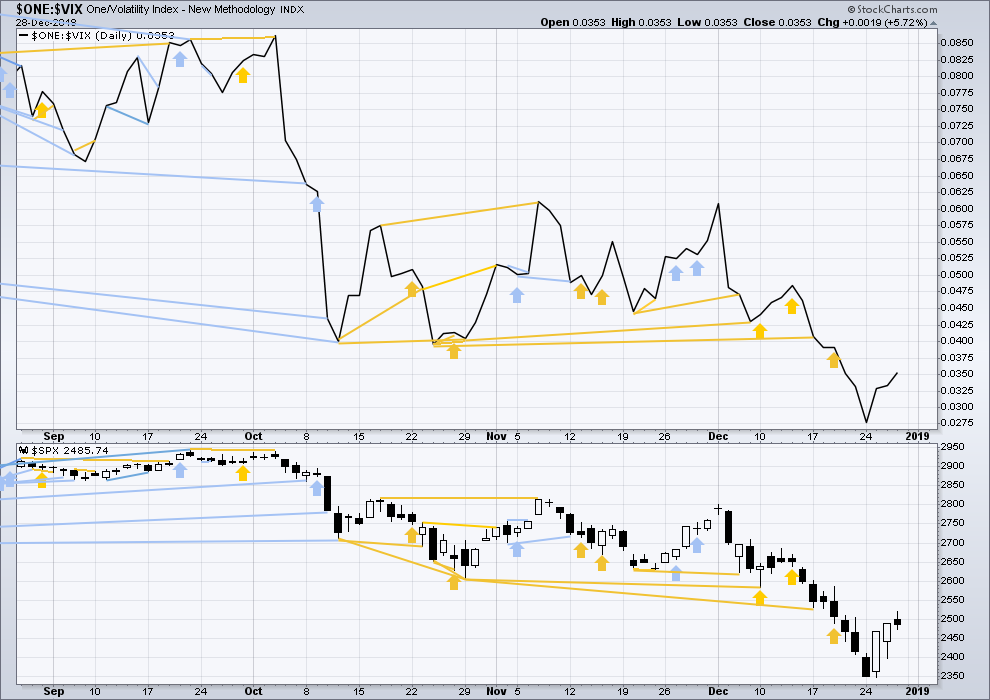
Click chart to enlarge. Chart courtesy of StockCharts.com. So that colour blind members are included, bearish signals
will be noted with blue and bullish signals with yellow.
Both price and inverted VIX have made new lows. There is no divergence.
DOW THEORY
Dow Theory confirms a bear market. This does not necessarily mean a bear market at Grand Super Cycle degree though; Dow Theory makes no comment on Elliott wave counts. On the 25th of August 2015 Dow Theory also confirmed a bear market. The Elliott wave count sees that as part of cycle wave II. After Dow Theory confirmation of a bear market in August 2015, price went on to make new all time highs and the bull market continued.
DJIA: 23,344.52 – a close on the 19th of December at 23,284.97 confirms a bear market.
DJT: 9,806.79 – price has closed below this point on the 13th of December.
S&P500: 2,532.69 – a close on the 19th of December at 2,506.96 provides support to a bear market conclusion.
Nasdaq: 6,630.67 – a close on the 19th of December at 6,618.86 provides support to a bear market conclusion.
Published @ 09:25 p.m. EST.
—
Careful risk management protects your trading account(s).
Follow my two Golden Rules:
1. Always trade with stops.
2. Risk only 1-5% of equity on any one trade.
Updated main hourly chart:
At this time frame the invalidation point may now be moved up. Minor wave 2 may have ended at today’s low, just slightly below the 0.382 Fibonacci ratio of minor wave 1.
This wave count now expects to see an increase in upwards momentum next week for a third wave. The target remains the same.
Bearish symmetry (largest up move since Oct 3 high, projected from the Dec 24 low) is almost exactly at at 61.8% retrace level at 2556.
If it breaks above that…more indication that perhaps indeed the C4 is over.
Unlike yesterday’s drop which was lacking in breadth, today’s rally appears to have relatively strong breadth. Currently there are 2630 advancers in NYSE and 336 decliners. That is an 88% positive breadth, very strong.
Yep. That quite strongly supports the main wave count over the alternate.
Yesterday, 1/3/19, at 12:15 PM I wrote:
“We need one more low below today’s low of 2447.67 to complete Minor 2 as per the main count. That might present a good time to take a long position. ”
The last five minutes of the trading day we hit the low of the day at 2443.96. Did anyone go long?
I must admit, I was out of the office and away from my desk. I did not enter an order and missed my own target. If we hit 2520 today it would appear to me Minor 2 of Intermediate 1 of the main count is over. If that is the case, a big if, then we are next moving toward 2580.
Went long ES overnight.
I should have added, I am long and have been for a while. I don’t exactly need any more long positions. Good move Curtis. However, I am still not completely sold on this rally until we clear 2520. Which may be this morning, believe it or not!
triple top….? its like someone is building a wall
With a government shutdown and
Nancy yelling “No wall” I don’t see how we can launch the V. But the market does what it wants.
Big money sweeping up the stops of the shorts from yesterday.
Need more to look impulsive here.
Is the massive jobs report enough to overlook all the current White House noise? I’m shorting this
Hmmm. Maybe after a tag and turn at 2555 the 62%? Maaaaybe. You don’t often get 3.7% (and climbing) days…tends to be an indicator of more pent up strength.
Normal analysis resumes tomorrow, end of week analysis will be published over the weekend as normal.
Today is the last day of my annual semi holiday. I thank all members very much for your continued support and understanding of my need for some kind of a break.
And what a break it has been! The surf came to my home breaks with a vengeance this last week and a half. I have surfed my little heart out, six days in a row, up to two sessions a day, up to 3 hours each session. But I managed only 1 hour this morning, my arms are noodled! I’m exhausted physically, but completely refreshed mentally. Ready to jump right into analysis tomorrow, and back to normal next week.
I’ve snapped a leash, broken a GoPro, surfed some big waves (for me) and had the time of my life.
So thank you all so very much for your patience. I’m really excited for what the markets may bring us this year!
Thank you Lara.
I also wanted to thank you as the forum moderator for keeping and enforcing the peace here.
Those of us that are adults value civility. I hope the remainder of the team to understand Lara’s position and to try to see/consider prospective from all sides.
There is really no reason for the folks that think of themselves as grown ups to throw any temper tantrums about this.
Respect earned could be very easily respect lost.
The stoke is palpable! Congrats on the perfect vacation…
Sounds like a whole lotta great times! You deserve it Lara…
Update at end of day 3rd January 2019:
Technical Analysis:
This bounce really does look still like a counter trend rally. The trend remains down. This chart offers more support to the alternate.
However, Lowry’s data shows today’s sell off lacked support from a corresponding decline in market breadth and volume. This decline is weak, possibly focused more on a few issues than a broad based market decline. This would tend to support the main Elliot t wave count which sees it as a second wave correction.
AD line:
Today’s downwards movement lacks support from a decline in market breadth; the low for price today is lower than the prior low of the 28th of December, but the AD line is substantially higher.
Main Elliott wave count daily chart updated:
This remains the same. Minor wave 2 now looks more normal. A low for minor wave 2 here close to the 0.382 Fibonacci ratio of minor wave 1 is acceptable. If it continues a little lower then the target would be the 0.618 Fibonacci ratio at 2,413. But today that looks less likely.
For this wave count I’d expect upwards movement tomorrow.
Alternate daily chart updated:
While price remains within the channel and below 2,631.09 this wave count will remain entirely valid and possible.
Members who also do their own market analysis may consider this alternate more likely than the main wave count. If that is your view, then here is a road map with targets for the next fall in price.
My overall judgement today would still be that the main wave count would be more likely.
Updated hourly charts before NY close on 3rd January 2019:
Yesterday I was a little… concerned (just a very little) about a small truncation. It was within a B wave though, so not much concern. Today the problem is very neatly resolved on this main hourly chart.
Minor 2 may have continued lower as a regular flat. Within it, minute b is an expanded flat. Within that, minuette (b) is a regular flat, and within that subminuette b a zigzag.
Now the low of micro B within submineutte b within minuette (b) has no truncation. It all fits very neatly and makes sense.
For this part of the recent movement this main hourly chart fits best in terms of Elliott wave. But does it have more support from classic TA? End of session data may be used to answer that question.
Alternate hourly chart updated:
For this count there is a truncated C wave. It is submineutte c, within minuette wave (b), within minute b, within minor B. On the five minute chart minuette (b) can’t be seen as anything other than a zigzag, so the truncation cannot be resolved.
From an EW perspective that very slightly reduces the probability that this is the right wave count.
But as always, classic TA needs to be taken into account.
Also, price has reacted down from the upper edge of the trend channel. That would tend to indicate this may be the right wave count.
We need one more low below today’s low of 2447.67 to complete Minor 2 as per the main count. That might present a good time to take a long position.
However, such a positon would best have a stop all the way down at 2346, or roughly 100 SPX points (4% risk unleveraged). I see a reasonable upside potential to the 200 day moving average or roughly 2750. That would be a 300 point rally (12% reward unleveraged).
Lets see what things look like if we go back towards 2447.
SPX now in it’s 8th bar of squeeze at the hourly time frame. The hourly trend is strongly down. The daily trend is down. The weekly trend is strongly down. The monthly trend is down.
And the world is awash in bad economic news or likely to be reported soon bad news. AAPL was just the start. Also, US politics will be a disaster for the next year or two.
I think the short side has to be a bit favored here myself. I’ll need to see serious proof before I consider taking longs.
Maybe longs around 245 and shorts around 250 for another couple days
Tight range…
But I still think we are headed for 2650-2800
Either as a last bounce before a big fall
Or on the way to all time highs
That’s the bigger lens to view things in the medium term
I don’t think this is the area to sell longs or take shorts
It’s kind of a no mans land
Positional trading wise, I absolutely agree.
I’ve ground out some decent profits working the short side this morning. But it’s knife work for sure. Helps a lot when the moves are strong and fast. High risk of getting chopped up later in the day or on the days it’s pure chop, like most of the last week; time to play guitar and sing old rock songs poorly, lol!!!
Enjoy brother !
AAPL (weekly chart) has bottomed at the 61.8% retrace of the April ’16 to Oct ’18 low to high move.
Is it stopping and turning here? With the down momentum show here on the weekly it seems a bit unlikely, and the 78.6% at 120.4 is beckoning. Any significant break below 140 and it’s short time on AAPL (again).
Does GLD top and turn at the 61.8% just overhead? Hmm…I have a put bull spread with reasonable profit on the sold put side. Timing the partial exit is everything.
Gold and Silver in a Primary Wave III advance
Wanted to thank whomever it was that recommended Celgene a couple weeks back.. through a chart analysis
I picked up just a handful of shares… and it paid off nicely
Happy New Year!
Gold and Silver on the move… AG is a Buy
Silver in Breakout mode… http://www.321gold.com/editorials/captainewave/captainewave010319/silver.png
Breakout in metals does not scream P4 on SPX being over lol.
5 hours of squeeze in SPX (on hourly) with price falling away.
Fibo levels underneath…
If 2454 (38%) doesn’t hold it, it’s likely headed to at least 2413 (62%).
crazy how that AAPL news came out and changed everything
Just like that
A different fork becomes reality
the question is…is the aapl “Bad News” just the START of a solid stream of “bad news” earnings or guidance reports coming at the market? I would guess so myself. Slowing china’s economy may look like “success” for some kind of trade negotiation positioning…but China is a vital organ in the overall world economy, and it’s slowing down is going to effect just about everything. I suspect the pricing in of that is not close to complete.
End of day update for 2nd January 2019:
Classic TA:
A little support today from volume offers very small support to the main Elliott wave count.
Main Elliott wave count:
An increase in upwards momentum may be expected if minor wave 2 is now over. At the hourly chart level it looks like it could be, but I have to leave the invalidation point at the start of minor wave 1 to allow for the possibility that minor wave 2 could continue further.
Also, a note to members about the EW labels here: I’ve changed settings to show all future labels. As you can see, early on for a new wave it gets quite cluttered with a bunch of floating labels.
Does this present a problem for anyone? I hope no one thinks that my placement of the floating labels is at price points I expect those waves to end… there’s just too much possible variation for that to be the case.
Do members have a preference for this or the old way?
Alternate Elliott wave count:
Intermediate wave (4) could now be over, right at the upper edge of the black Elliott channel.
Three targets may now be calculated for cycle IV to end. The first target is favoured.
AD line:
This is fairly bullish, supporting the main Elliott wave count.
Looking at this you seem to be saying that for a short position, confidence is at 2346 with a “favoured” target of 2336 and a stop at 2632.
For a long 2632 , a stop at 2346 and a target of 3045.
Personally I’m short just above 2500 (average) saw against at 2522 and now stop to beven basis march. So looking for your targets to the downside. As you show on your hrly alternative resistance at 2520 @ 38.2 fib (actually had another short order just above there but didn’t get hit).
The point I’m making is that using the “confidence” and “favoured” target for a short gives an awful risk reward and is not worth taking.
The 2520 OTOH gives a very good risk reward ratio, although I obviously suffer from FOMO and would rather be in before, scaling in. (I don’t have a full size position).
So I’m wondering if the kind of analysis I just highlighted could be possible going forward. I.e. a good place for the up/down move at daily would give a poor R/R . But at a hourly -short e.g. – a good (38.2 fib + resistance) place for the upmove to end is 2518-25… With a first target at 2336. ( Similar analysis for Bull move).
This would then allow people to decide whether they favour bull or bear and whichever to take a sensible trade based on RR and potential ROI. Stops as you say could be based on MM/ position size and again left to the trader.
I do see where you’re coming from, and yes, the RR for a short position is horrible.
What I do tend to do for members is point out when I have high confidence in the analysis in terms of the direction expected next, and I try and point out a good entry point and what the risk is.
I don’t do that all the time, only when I have a high level of confidence.
And I’m not always right. About 10th December, and again most definitely on the 17th December I was wrong and members may have had losses on long positions.
I’m going to be again pointing out a good entry point for a long position today. And again, I could be wrong. The balance of data points to a bullish case here, so I have to go with that.
Lara,
I like the extra labels, helps me to visualize the upcoming movement and helps me to remember where in the overall wave count we are. Thank You.
I appreciate the extra effort … I was getting it sorted
But this gives a real nice idea of what you are seeing and is good information.
Your extra work through all these past weeks has been noted and much appreciated .
It’s very admirable how seriously you take your work… and your care and concern to the members.
I’ve been here a short time… but it feels like a home and I feel fortunate to have found you …
Thanks Scott! We’re very happy to have you jump on board
I prefer to see the details; it’s highly remind-ful of the complexity of the likely upcoming action.
Lara, I prefer seeing all floating labels (as done here) and arrows.
Easier for me to mentally remove excess than to mentally process and project the unseen.
Okay everybody. Your preference for floating labels is noted. They can stay.
AAPL smokes the market AH, -8% on guidance cut. It’s been the quarter of guidance cuts…
See if it winds up lower than 145… and where the market is in relation to the 2340 ish low
May be a double bottom of a very oversold stock… and one they use to lift the markets
Once all sellers are gone from the heavyweights … they can lift the markets again on shorts … for one last ride
We may not even hit our low from the 2nd which was 245 s and p or so…
So that would say something …and lend more credence to the main count and a rise back towards 2600
Rather volatile day.
The cluster of 3 fibo’s from 2511-2523 continue to defy the bulls. For over a week now.
Also notice SPX is in hour 3 and counting of squeeze.
Updated hourly charts before NY close today:
The little triangle no longer works for either count.
Both counts remain valid. Both counts remain pretty much the same.
Alternate hourly chart:
Feels like this to me
ROKU bull flag….
Kevin et all, classical and pure Elliott Wave Theory does not involve time, only price. That being said, good TA looks at time. So I just point this out. Glenn Nealy of Neowave is the person who initially involved time with EW starting about 30 years ago. This has led him so far off track that his ‘rules and wave patterns’ of EW are no longer understandable and many would no longer consider him an Elliott Wave technician.
As far as another wave down before any substantial rally, that is a whole other matter. The alternate count is still very much in contention.
The cycle 2 lasted 62 weeks.
The cycle 4 is only up to 14 weeks at this point in time.
While in theory the cycle 4 could be complete…doesn’t this current ratio alone lend VERY strong evidence to the alternate (continued cycle 4 for substantially more time, and probably substantially more down at some point)?
At 38.2% of the cycle 2, the cycle 4 would run 23-24 weeks. At 61.8%, about 38 weeks.
My bias here is watch for a turn down and strong sell triggers as prior support levels are taken out. This would match up with an incredible “bad news” loaded immediate future of continued US gov’t shutdown, a US gov’t completely fixated on criminality and associated corruption for the next 6-12 months, a likely failure in the US/China trade agreement, and a fast approaching earning seasons where even if results are good, many companies will be lowering guidance because of clouds on the economic horizon, and a looming hard Brexit in March.
The only counter to that stream of bad news might be a surprise freeze on interest rate increases.
Cycle 2. Cycle 4 was 62 weeks. We are at week 14. First half 2019 is going to be a WILD ride, methinks. Buckle up.
🙂
Very good comment Kevin. However in the S&P, rather than any other market , I would not now necessarily expect any wave 4 to be equal to, or greater than, the equivalent wave 2. Thank you Lara.
This is also based on Jef Kennedy’s opinion, one of the few EWI analysts whose work is normally quite reliable. He once warned me of relying too much on Fibonacci time ratios, because they’re just too unpredictable.
I certainly agree that Cycle IV could go on for longer as per the alternate, but not necessarily as long as Cycle II and also, for whatever reason, this particular market doesn’t often do it.
I did not suggest this cycle 4 would last as long as the cycle 2. Only that the current time ratio seems unlikely, and something more in the range of .38 to .62 of the cycle 2 time would be far more likely…and all that such a view would imply.
I agree they’re wildly disproportional in time.
But, looking at this on the monthly chart, they look proportional. Because cycle IV is so large in terms of price.
Kinda like… looking at corrections with an eye to Dow Theory and trying to figure out which is minor and which is major. Cycle II and IV look to be very much major. The others… most minor.
Proportion is just as much a function of price as well as time, and this particular market doesn’t always have good proportion. So I’m being more flexible here.
Good overall perspective
I for one will be curious if all the behind the scenes rumblings about the mass arrests of high ranking officials amounts to anything …
That would cause s much larger drop IMHO
Just be open to this down today being a retrace as part of a beginning 5
From a more bearish side
I also see it as a larger counter term bounce with the top in in Oct…
which should retrace to 2650-2800 before a larger flush
For what’s its worth
End of day update for 31st December 2018:
Technical analysis:
Declining volume and ATR may be due to the holiday season, but at this stage the data in hand suggests this looks most like a counter trend bounce. That would favour the alternate Elliott wave count.
Main Elliott wave count:
All remains the same. No change today.
Alternate Elliott wave count:
No change. Today classic TA does favour this wave count. Price remains within the channel and below the invalidation point.
I can’t calculate the target at intermediate degree yet because intermediate wave (4) still looks incomplete.
At the hourly chart level the alternate count works well. A small triangle may have completed for minor wave B.
Minor wave C may find resistance about the upper edge of the channel.
Watch how price behaves as it reaches the channel in the next session. If it strongly reacts down from there that would favour this alternate wave count.
Busting out of triangle upwards looks like alt count to me.
Yep. Me too.
Updated hourly chart: No change. Not enough action today to tell which wave count is correct.
Thanks Lara
I’m feeling the now main count is the one by what I am seeing in vix behavior ect
It would take news or event to have a final big push down
You never know
Question
Is there a time limit for how long a 4 could last without a real drop back down.. in terms of what has happened last week
I ask that because barring any news to move market down ….
It seems like if the market was going to move back down naturally
It would have already done so .. or would need to soon
We may expect intermediate (4) to be reasonably proportional to intermediate (2). But… the S&P does not always have good proportions so for this particular market flexibility here is required.
Intermediate (2) lasted 6 sessions, so intermediate (4) may be about the same, or a Fibonacci 8, 13 or even 21.
Vix just doesn’t budge had to ditch the shorts. The market can’t keep going down without the vix going up.
My hourly view. Trend at this tf still up but sure looks toppy. The cluster of fibo’s overhead I cited last week have held so far. I expect today will just meander inside the range so far, but overall, I would expect more down here to start the New Year. The unnamed one is talking up a China trade deal which almost certainly means that’s going to fail. Etc. So much likely bad news for business coming down, more gov’t shutdown, a hard brexit, indictments. It’s going to be…”interesting”. Hard to see how the market will discount it all in a positive way. But…market actions speaks. Maybe earnings upcoming will be strong? I dunno.
It’s still has a feel to me of sellers drying up
And people not willing to buy vix above 30 or near it…
There was a lot of selling before Christmas .. and short positioning
The market is clearing the people who bought under 2400… to see if they want to let go… and seeing if bears want to take ANY opportunity to short
This feels like a slow grind upward .. until we get one of those gap and goes… where price starts going above where people sold
Maybe there is some piece of news coming that would cause a 100-200 point sell of climax for Lara’s now alternate ending of p4
But this seems like the beginning of p1
Or a counter rally to 2640-2800 before a larger drop .. if the top was in oct
I just receive a “daily update of news” that indicated markets are open for normal hours today as arnauddesombre indicated below.
Hard not to notice that in the last few trading sessions, SPX price movement is strongly inversely correlated with bonds. The SPX rallies have been coincident with bond sell off, and vice versa. Don’t know if/how long that’ll last but so far that’s holding up this morning too.
Funny you mention the relationship of bonds to equities. I started some research on that yesterday. I have some pension accounts in which there is no option to go short equities not even by way of bearish mutual funds. They also do not offer investment in precious metals. So I am looking to find ways to make money during the upcoming bear market rather than have them tucked away in money market instruments. They offer emerging markets, global markets etc. But in the bear market we are facing, I think those will be slaughtered as well.
Bonds of different types are offered. But I am not sure these are going to present profitable opportunities until we have a declining interest rate environment. It does not look like that type of environment will be available until well after the bear market begins. Any thoughts and considerations of EWSM members is appreciated.
That is one of the small mysteries of this market. Where is all the money coming out of it going?
Clearly, a bunch has been going into US bonds, and those bonds have risen strongly while the market has tanked. But that’s a tactical correlation only. Eventually, bonds will fall (reassert their secular trend)…and eventually after that, the market will enter GSC wave 2.
Gold and yen has as expected moved up with the sudden sharp December sell off. The dollar continues to slide/go sideways.
Where will piles of money go in the early stages of a GSC wave 2? First up on my list of expectations is gold and yen, just as has happened here in miniature. Sorry that doesn’t help you though!
Sometimes … between margin and leverage
Money just goes “poof”….
And…. it’s gone…
Musical chairs … skimming machine …. the markets in their realist sense is not an investment vehicle ….
It is a money eater…. just a matter of when and how… the money gets eaten
It’s zero sum game
I like to treat it as a poker table… and knowing when to enter and when to leave …and who your playing against
“Where is all the money coming out of it going?”
If money is used to pay off bank debt, then it simply ceases to exist.
When banks create loans the money is created. When the loans are repaid the amount of $ in circulation is reduced.
Great point lara…
And probably the biggest point
It’s all about the big M
The money supply…
And when there is no new money to feed the debts of the old money
The music finally has to stop
Interesting the limitations set forth .
No bear trades…. no gold ect
Definitely keeps the money where It’s wanted to be…
Notice to all EWSM members:
This is the second week of my partial holiday.
I will be here each day to provide an end of day update here in this comments section, and if time permits in my morning I may pop in and provide an update of the hourly chart before NY closes like I normally do.
Your end of day update will be an updated TA chart and daily chart, with a quick comment (summary) for each.
I thank you so very much for your patience. It’s important that I have a little kind of holiday.
It’s New Year’s Eve here in NZ tonight, and I would like to wish all members a very Happy New Year. I think 2019 may be very… exciting.
Also, a very big thank you to all EWSM members. I know the last 3 weeks of my analysis have been disappointing. I’m disappointed anyway.
Without your continued support and confidence in me, I could not keep doing this year after year. And so I really do appreciate you, every single one. Thank you.
We must all face reality. It is reality that there are times when there is uncertainty in the markets and Elliott Wave counts. To think otherwise is to be foolish. The most important thing is that we eventually and hopefully quickly determine what is up with the markets and Elliott Wave counts. You have done this Lara. We are back on track.
Something similar occurred in 2015 and the beginning of 2016. It appeared a major top was in and we were headed into a bear market. But that was eventually demonstrated to be wrong. The market recovered and began another bull leg. You quickly updated the Elliott Wave count and correctly forecast the next several years of the bull market.
You have not been alone in this situation nor were you alone in late 2015 – early 2016. But you recover quicker than anyone else I have seen. No one, I repeat, no one in the market forecasting business is perfect or without uncertainty. But EWSM is the best, by far, that I have seen.
If anyone wants or expects perfection in Elliott Wave or market forecasting, they are not realistic and they will not be a successful trader or investor. The market has periods of uncertainty. Life has periods of uncertainty. This is reality.
I speak for many, most and perhaps all on this forum, when I say, “Thank you Lara for your work. You are the best.”
Happy New Year to you all. New Year’s Day is my second son’s birthday so it is always special for us. He is the father of our two wonderful granddaughters ages almost 7 and 3 1/2. These two little girls have been staying with us since before Christmas. If you want to see a life and household of uncertainty, come to mine!
I second Rodney’s comments. I am not disappointed in the least Lara. Your work has been excellent. It’s been a surprising and challenging market.
BTW Lara, I do hope you take a full holiday sometime soon since you are working through this normal holiday of yours. It is important for our mind , body and spirit that we periodically have a rest that refreshes.
Thanks guys.
I will be able to take a holiday once I’ve completed Sophie’s training to my satisfaction.
One day I’d like to go surf the Pacific coast of Columbia, and I don’t think there’s a reliable internet connection there.
Thanks Lara. While the low volume of the past several days may be of some concern, it may be the result of a holiday week. So we continue to look to how the SPX acts as it heads toward the 2631 mark.
NOTE: I understand the US markets will be open a half day on New Year’s Eve.
That’s true Rodney.
Also, it’s been a feature of this ageing bull market for a while. I’d expect during cycle wave V to see it still.
Monday 12/31 is a normal trading day
https://www.nyse.com/markets/hours-calendars
Thanks and interesting. This is what I read:
“As 2018 reaches its conclusion, many are wondering whether or not to take part in any last-minute trading or simply to wait until 2019 rolls around and turn their focus back to their portfolios then. If you plan on trading in 2018, the clock is ticking as the New York Stock Exchange and Nasdaq will have half days on New Year’s Eve.”
https://investorplace.com/2018/12/is-the-stock-market-open-on-new-years-eve-2018/
This is not an official website. Nasdaq confirms the full day:
https://business.nasdaq.com/discover/events/trading-hours/index.html
CME has altered trading hours:
https://www.cmegroup.com/tools-information/holiday-calendar.html
(Monday 12/31 will have the same hours as a normal Friday for Globbex, and Tuesday 01/01 will have the same hours as a Sunday)
For non US markets:
https://www.interactivebrokers.com/cal/cal.php?runthis=view_all
My quick glance at that schedule doesn’t tell me today is a full day (nor a short day).
I believe Rodney’s info is correct, and today closes at 1pm EST.