
Downwards movement continued as expected, although the short term target was again inadequate.
Summary: It looks most likely that price may fall further tomorrow; next support is about 2,700. Look for a candlestick reversal pattern, or an instance of bullish divergence between price and RSI or the AD line, before downwards movement may end and a bounce to last more than just a very few hours may begin.
A primary degree correction should last several weeks and should show up on the weekly and monthly charts. Primary wave 4 may total a Fibonacci 8, 13 or 21 weeks. The preferred target for it to end is now about 2,717.
The final target for this bull market to end remains at 3,616, which may be met in October 2019.
New updates to this analysis are in bold.
The biggest picture, Grand Super Cycle analysis, is here.
Last historic analysis with monthly charts is here, video is here.
ELLIOTT WAVE COUNT
WEEKLY CHART
Click chart to enlarge.
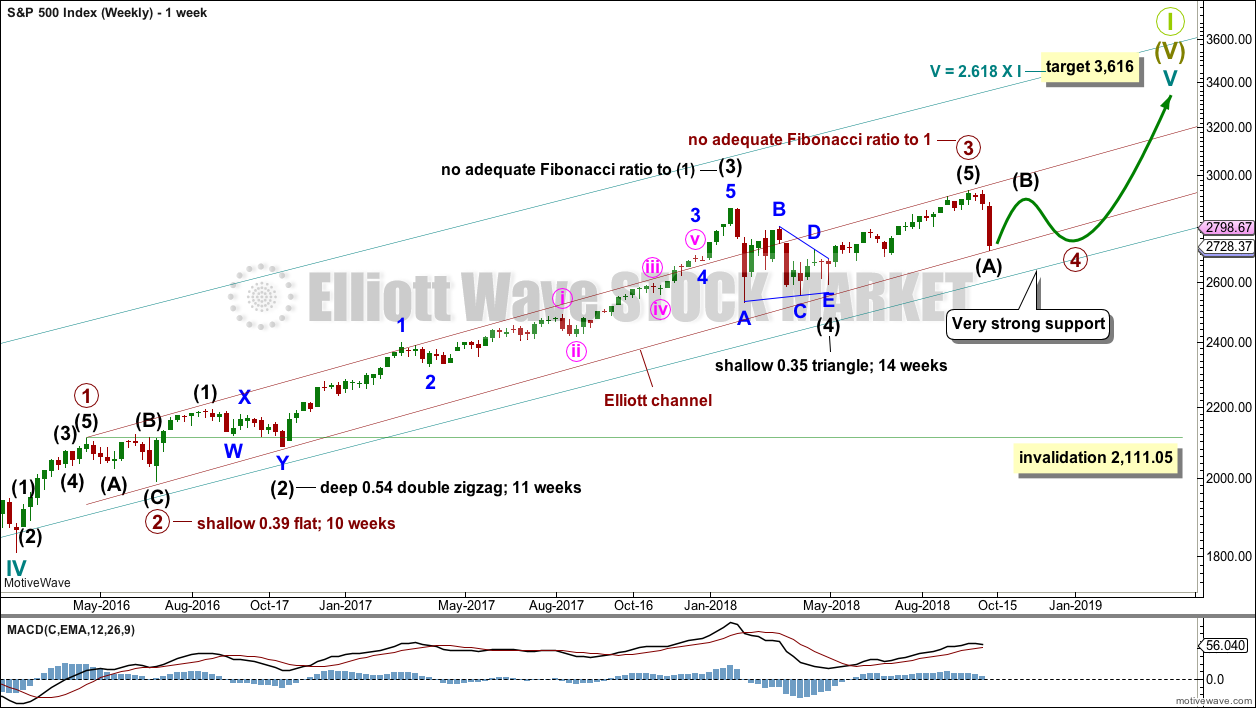
Cycle wave V must complete as a five structure, which should look clear at the weekly chart level and also now at the monthly chart level. It may only be an impulse or ending diagonal. At this stage, it is clear it is an impulse.
Within cycle wave V, the third waves at all degrees may only subdivide as impulses.
Within primary wave 3, there is perfect alternation and excellent proportion between intermediate waves (2) and (4).
The channel is now drawn about primary degree waves. The first trend line is drawn from the ends of primary waves 1 to 3, then a parallel copy is placed upon the low of primary wave 2. Primary wave 4 may find support about the lower edge of this maroon channel. The overshoot of the upper edge of this channel by the end of intermediate wave (3) looks typical. For the S&P, its third waves are usually the strongest portion of an impulse; they often exhibit enough strength to overshoot channels.
Fourth waves do not always end within channels drawn using this technique. If primary wave 4 breaks out of the narrow maroon channel, then it may find very strong support about the lower edge of the teal channel. This channel is copied over from the monthly chart and contains the entire bull market since its beginning in March 2009. While Super Cycle wave (V) is incomplete, this channel should not be breached.
Primary wave 4 may not move into primary wave 1 price territory below 2,111.05. However, it is not expected to get anywhere near this invalidation point as it should remain above the lower edge of the teal channel.
When primary wave 4 may be complete, then the final target may be also calculated at primary degree. At that stage, the final target may widen to a small zone, or it may change.
At this stage, the expectation is for the final target to be met in October 2019. If price gets up to this target and either the structure is incomplete or price keeps rising through it, then a new higher target would be calculated.
DAILY CHART
Click chart to enlarge.
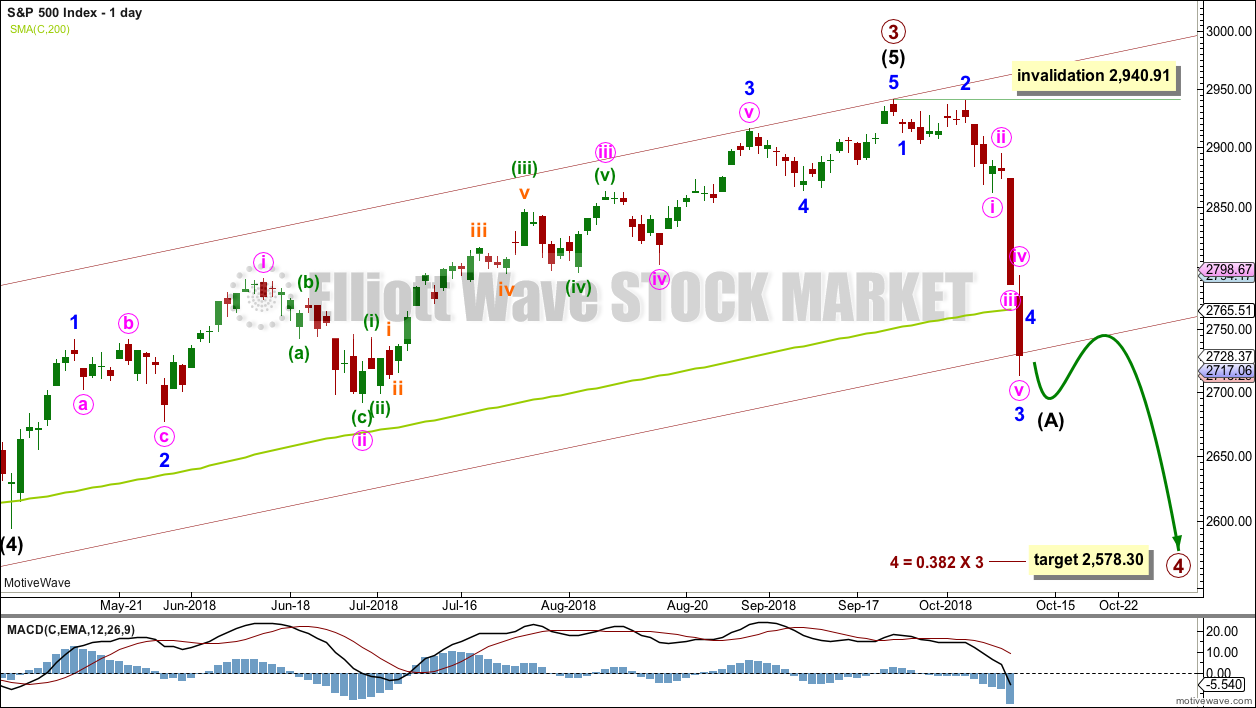
Primary wave 4 would most likely end somewhere within the price territory of the fourth wave of one lesser degree. Intermediate wave (4) has its price territory from 2,872.87 to 2,532.69. Within this range sit two Fibonacci ratios giving two targets. The 0.236 Fibonacci ratio has now been met and passed. The 0.382 Fibonacci ratio may now be used as a final target for primary wave 4 to end.
Primary wave 2 unfolded as a shallow regular flat correction lasting 10 weeks. Primary wave 4 may exhibit alternation in structure and may most likely unfold as a zigzag, triangle or combination. Primary wave 4 may last a Fibonacci 8 weeks at the earliest, and more likely a Fibonacci 13 or 21 weeks in total. A zigzag would be the most likely structure as these are the most common corrective structures and would provide the best alternation with primary wave 2. A zigzag would see intermediate wave (A) unfold as a five wave structure.
Primary wave 4 may not move into primary wave 1 price territory below 2,111.05. However, the lows in primary wave 4 should not get close to this point. The lower edge of the teal channel on the weekly chart should provide very strong support.
HOURLY CHART
Click chart to enlarge.
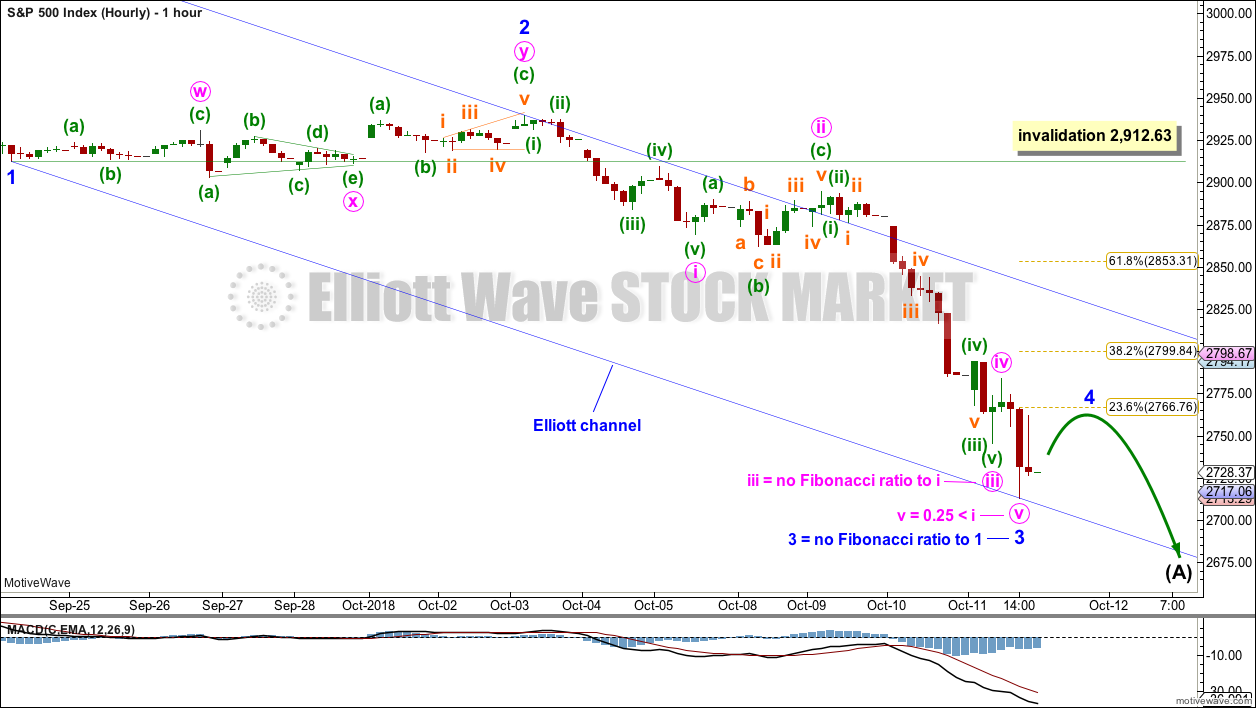
Minor wave 3 may now be complete. Minor wave 4 may be a small shallow bounce tomorrow, which may last from just one to a very few sessions. It is possible that it could be over during tomorrow’s session.
The acceleration channel drawn on yesterday’s main hourly chart is now an Elliott channel. If minor wave 4 is time consuming or deep, then it may find resistance about the upper edge of this channel.
Minor wave 2 was a very deep 0.96 double combination. Minor wave 4 may exhibit alternation as a very shallow correction, and it would most likely be a zigzag. Zigzags tend to be quicker structures than combinations.
Minor wave 4 may not move into minor wave 1 price territory above 2,912.63.
When a small bounce for minor wave 4 is complete, then minor wave 5 downwards may continue towards support about 2,700.
ALTERNATE DAILY CHART

Click chart to enlarge.
It is also possible that primary wave 4 may sub-divide as a triangle or flat correction, although a flat would not offer structural alternation with primary wave 2. It is also possible that primary wave 4 may unfold as a combination.
If primary wave 4 unfolds as a triangle or a flat, then within it intermediate wave (A) must sub-divide as a three wave structure, most likely a zigzag. It is possible today that intermediate wave (A) is a completed zigzag.
If primary wave 4 unfolds as a combination, then the first structure in a double may now be a completed zigzag labelled intermediate wave (X).
Intermediate wave (B) or (X) may make a new price extreme above the start of intermediate wave (A) or (W) as in an expanded flat, running triangle or wave X within a combination. There is no upper invalidation point for this wave count at the daily chart level for this reason.
ALTERNATE HOURLY CHART
Click chart to enlarge.
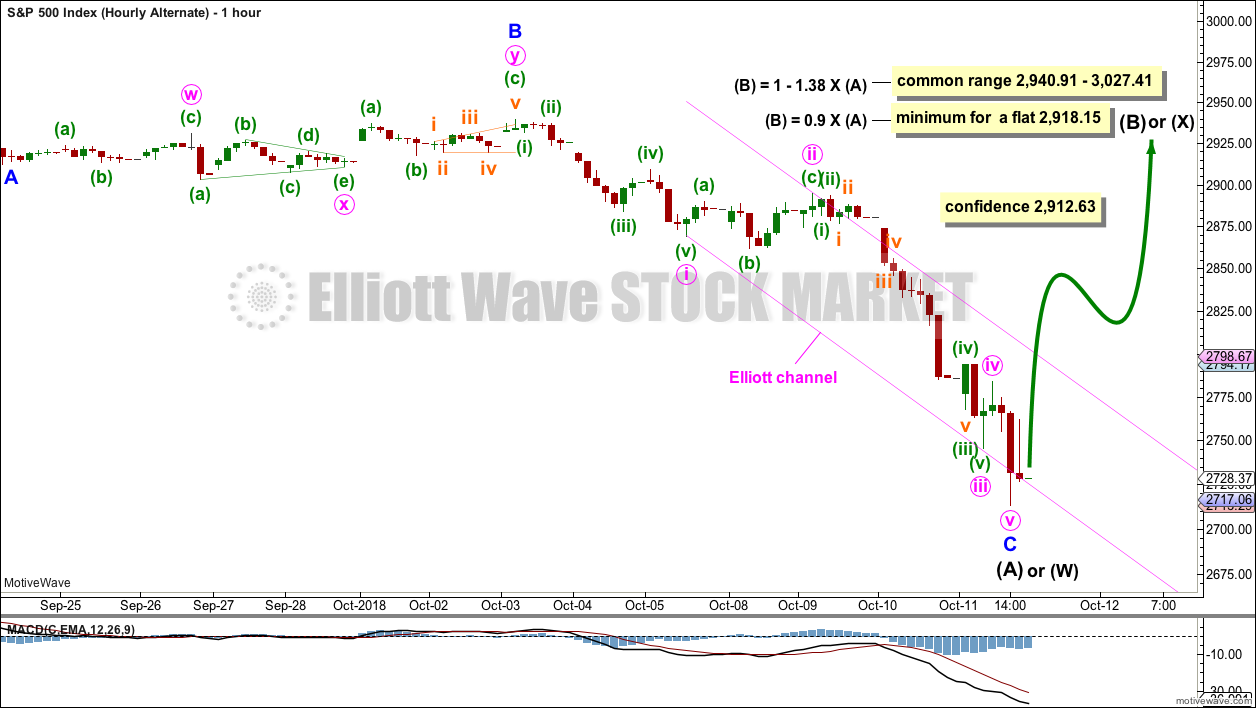
A zigzag sub-divides 5-3-5, exactly the same as waves 1-2-3 of an impulse. The subdivisions within this downwards movement are seen in the same way for both wave counts.
If a bounce begins tomorrow and price moves above 2,912.63, then expect upwards movement to very likely continue to 2,918.15 or above.
If primary wave 4 unfolds as a flat correction, then within it intermediate wave (B) must retrace a minimum 0.9 length of intermediate wave (A), and would most likely end within the common range of 1 to 1.38 times the length of intermediate wave (A).
If primary wave 4 unfolds as a triangle, then there is no minimum required length for intermediate wave (B); it only needs to subdivide as a corrective structure, most likely a zigzag.
If primary wave 4 unfolds as a combination, then there is no minimum nor maximum required length for intermediate wave (X), and intermediate wave (X) may also make a new price extreme beyond the start of intermediate wave (W). X waves within combinations are usually fairly deep.
TECHNICAL ANALYSIS
WEEKLY CHART
Click chart to enlarge. Chart courtesy of StockCharts.com.
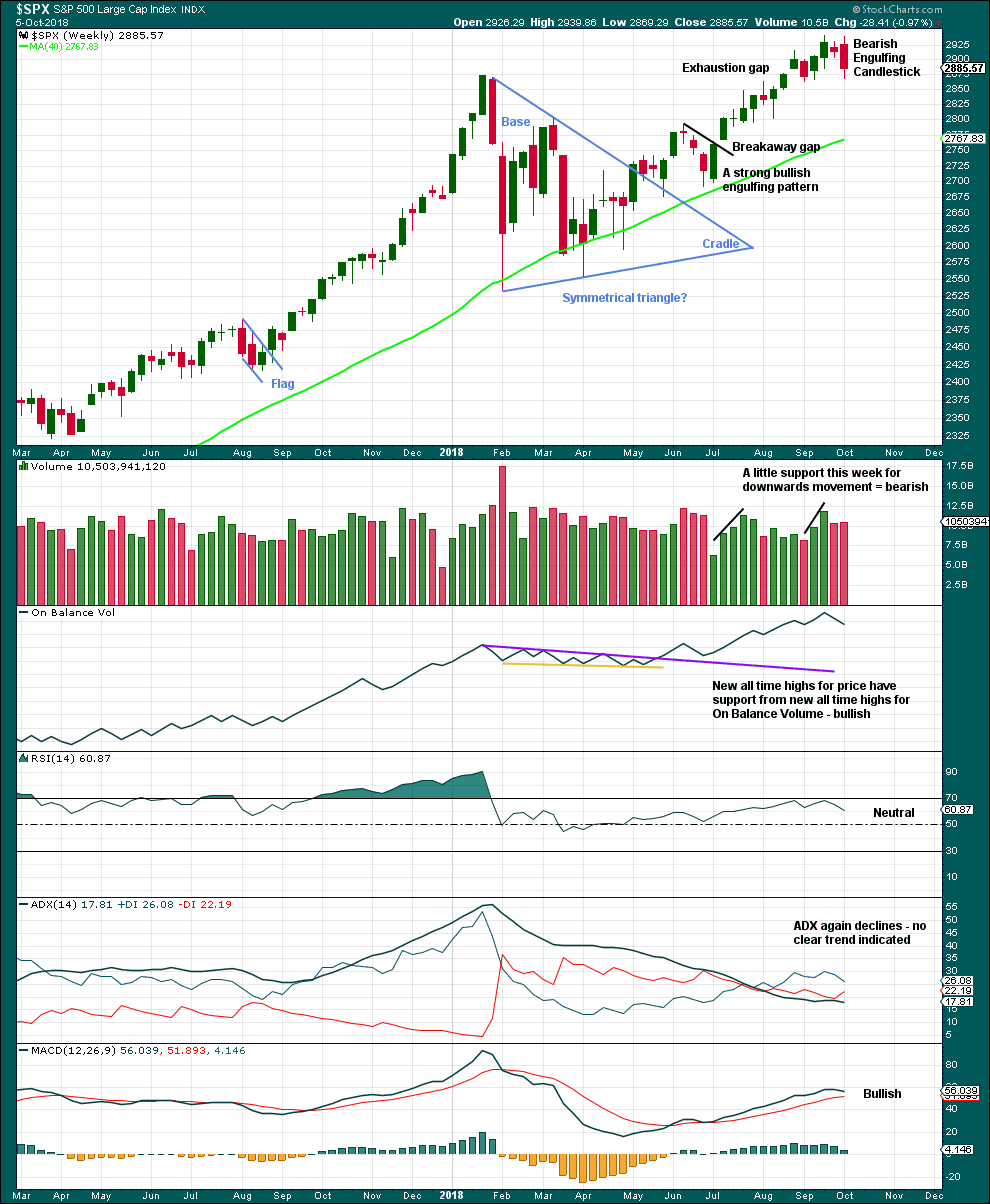
The symmetrical triangle base distance is 340.18. Added to the breakout point of 2,704.54 this gives a target at 3,044.72. This target has not yet been met.
Last week completes a Bearish Engulfing candlestick pattern (the strongest candlestick reversal pattern), which also has support from a slight increase in volume. This favours the main Elliott wave count.
DAILY CHART
Click chart to enlarge. Chart courtesy of StockCharts.com.
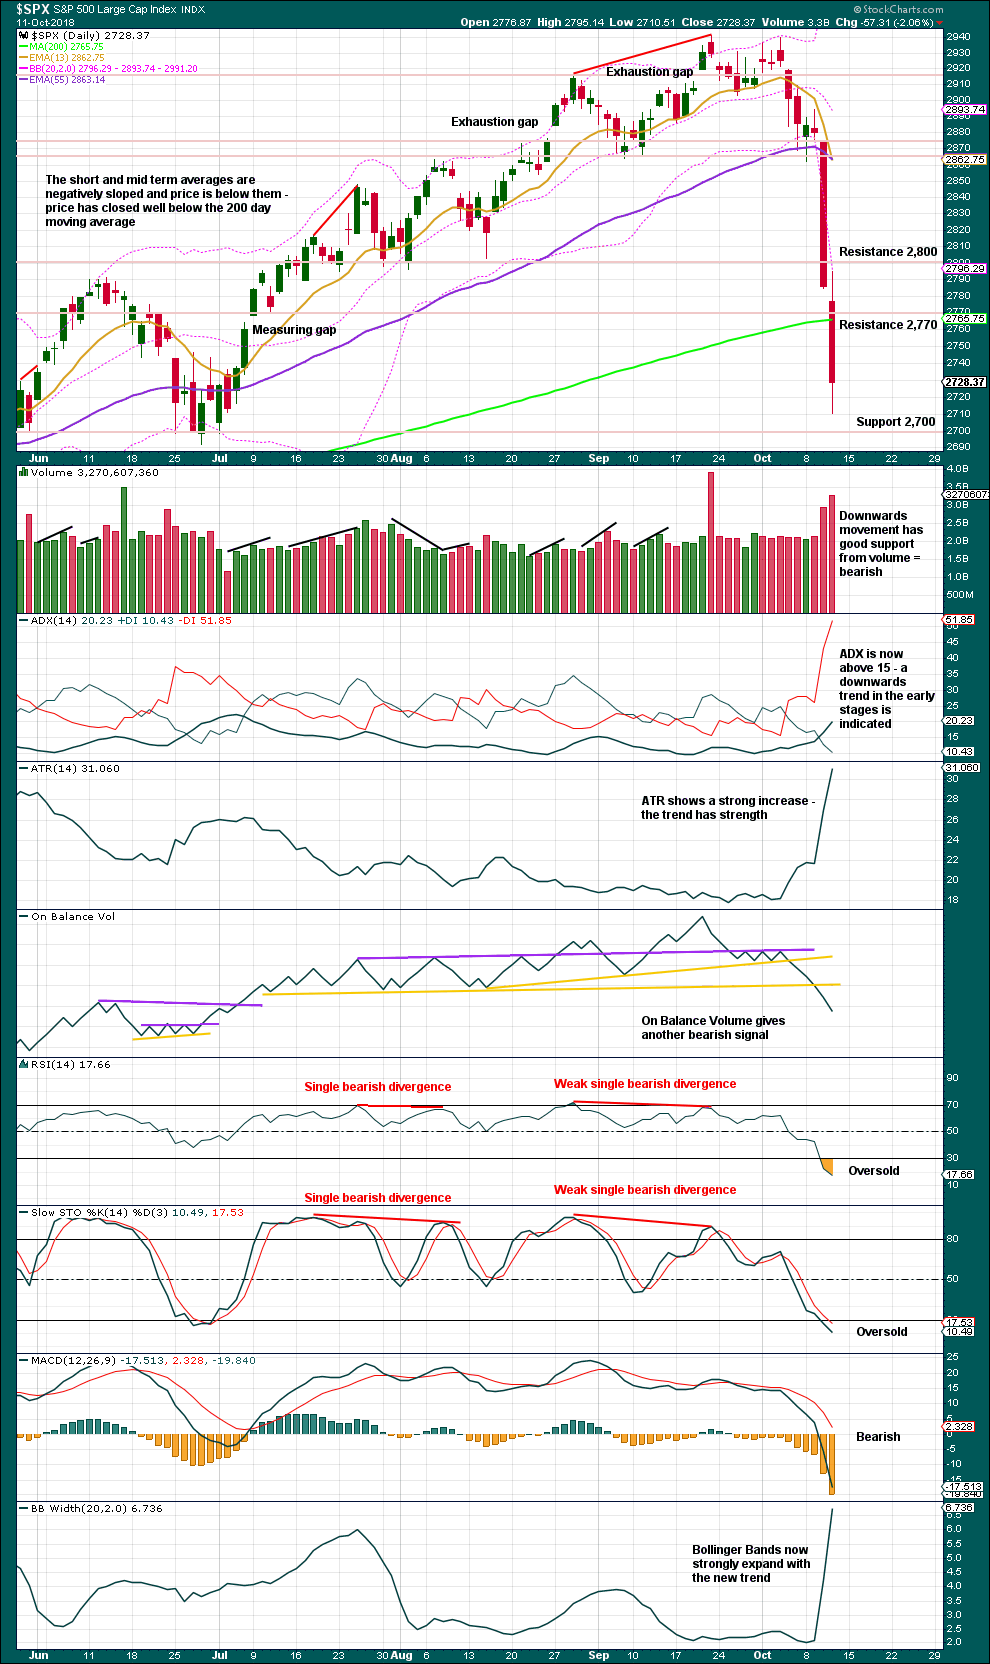
Next support is about 2,700. RSI is now fairly oversold.
There is as yet no bullish divergence between price and either of RSI, Stochastics or On Balance Volume. Nor is there a candlestick reversal pattern. If any of these signals occur, then a bounce may be expected.
VOLATILITY – INVERTED VIX CHART
WEEKLY CHART
Click chart to enlarge. Chart courtesy of StockCharts.com. So that colour blind members are included, bearish signals
will be noted with blue and bullish signals with yellow.
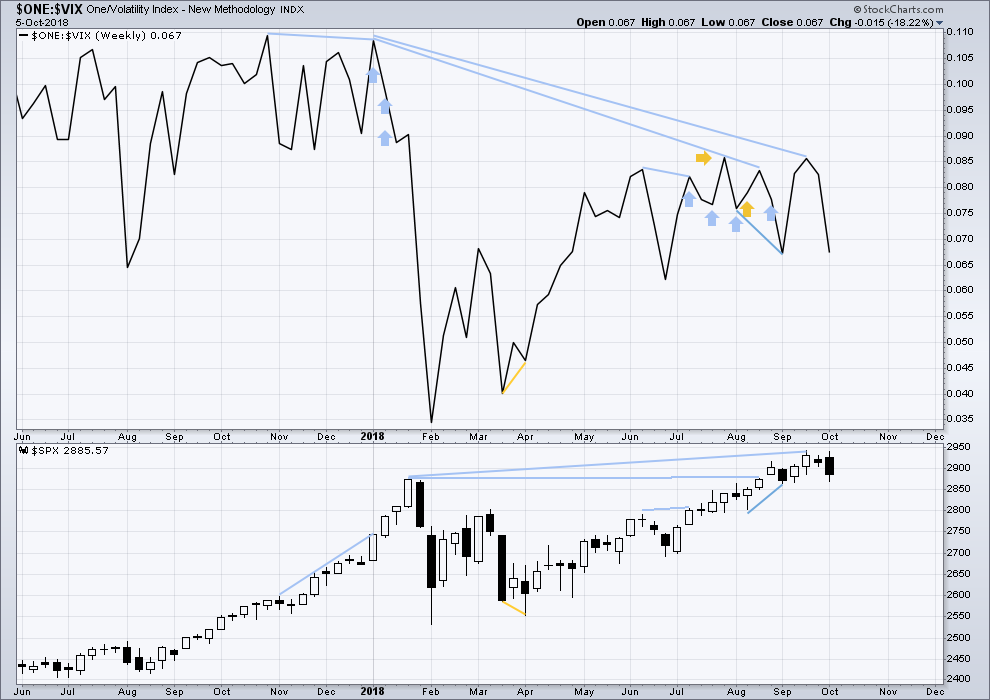
To keep an eye on the all time high for inverted VIX a weekly chart is required at this time.
Notice how inverted VIX has very strong bearish signals four weeks in a row just before the start of the last large fall in price. At the weekly chart level, this indicator may be useful again in warning of the end of primary wave 3.
At this time, there is mid term bearish divergence between price and inverted VIX: price has made another new all time high, but inverted VIX has not. This divergence may persist for some time. It may remain at the end of primary wave 3, and may develop further to the end of primary wave 5.
Both inverted VIX and price have moved lower and neither have made new swing lows. There is no divergence.
DAILY CHART
Click chart to enlarge. Chart courtesy of StockCharts.com. So that colour blind members are included, bearish signals
will be noted with blue and bullish signals with yellow.
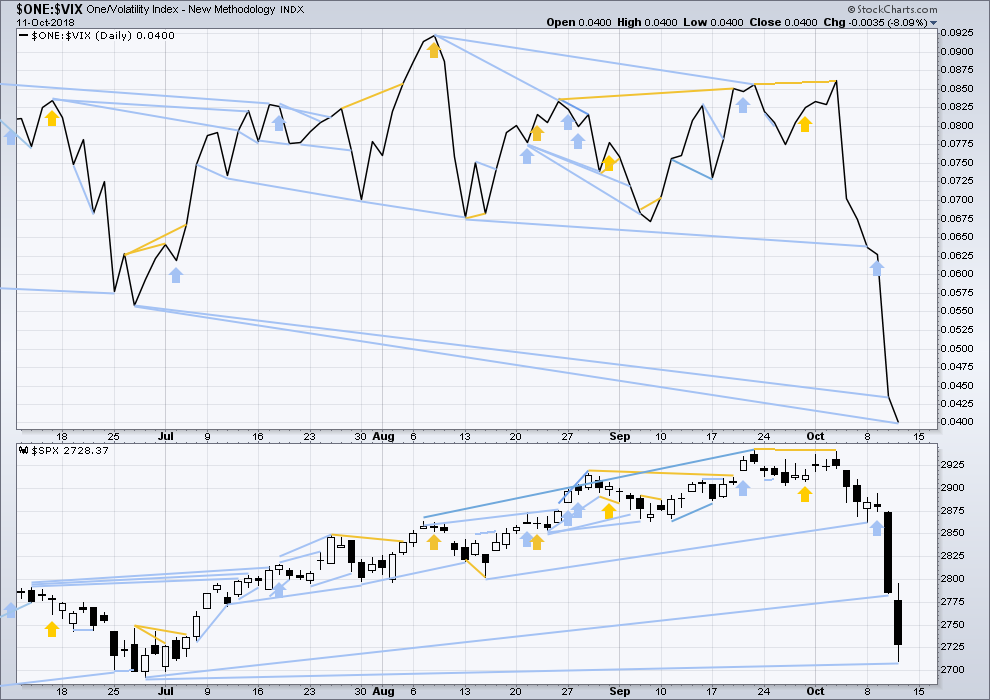
Normally, volatility should decline as price moves higher and increase as price moves lower. This means that normally inverted VIX should move in the same direction as price.
There is mid term divergence with a new all time high from price not supported by a corresponding new all time high from inverted VIX. This divergence is bearish.
Mid term bearish divergence between price and inverted VIX can be seen on both daily and weekly charts now. There is now enough mid term bearish divergence to offer reasonable support to the main Elliott wave count.
There are now two days in a row of long term bearish divergence between the low for inverted VIX today and the prior swing low of the 27th/28th June. Inverted VIX has made new lows, but price has not. Another downwards day tomorrow may result.
BREADTH – AD LINE
WEEKLY CHART
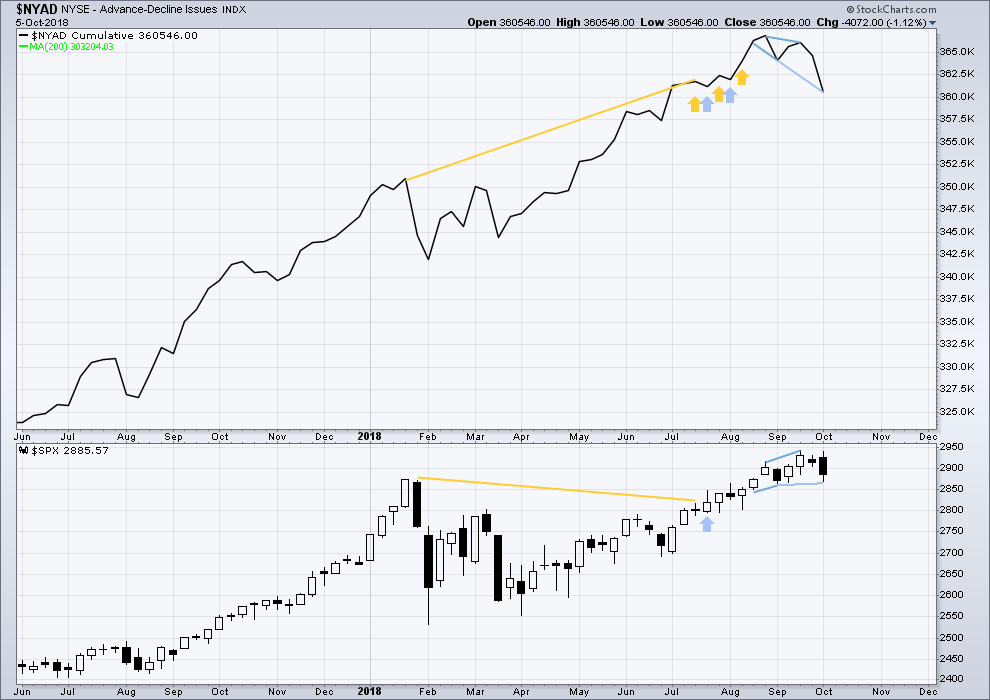
Click chart to enlarge. Chart courtesy of StockCharts.com.
When primary wave 3 comes to an end, it may be valuable to watch the AD line at the weekly time frame as well as the daily.
There is now triple bearish divergence between price and the AD line. The AD line this week has made a new strong swing low, but price has not. This offers reasonable support now to the main Elliott wave count.
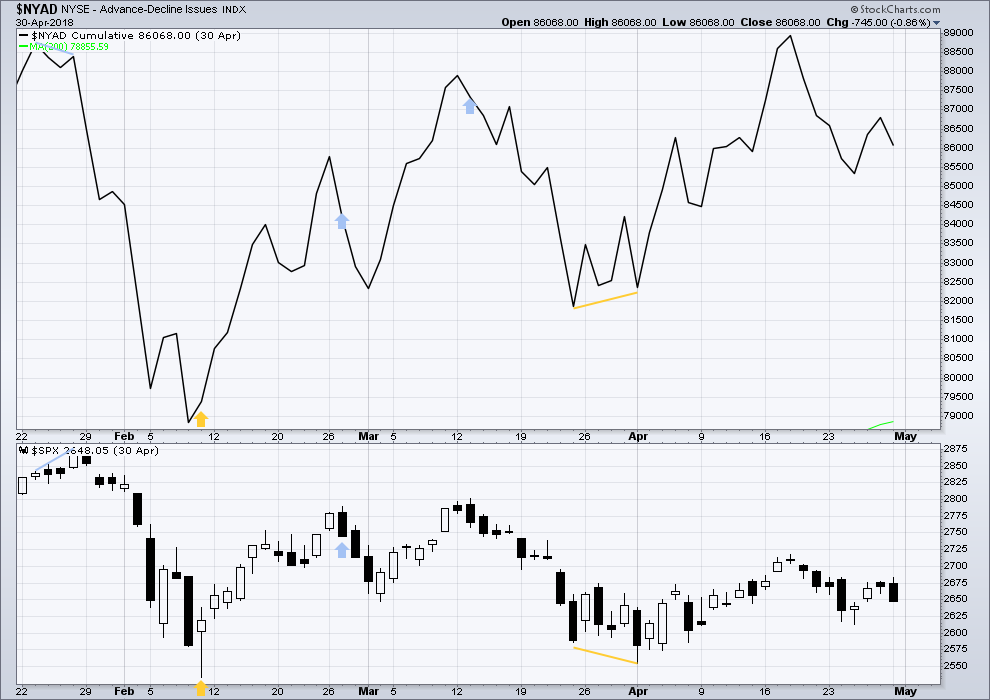
DAILY CHART
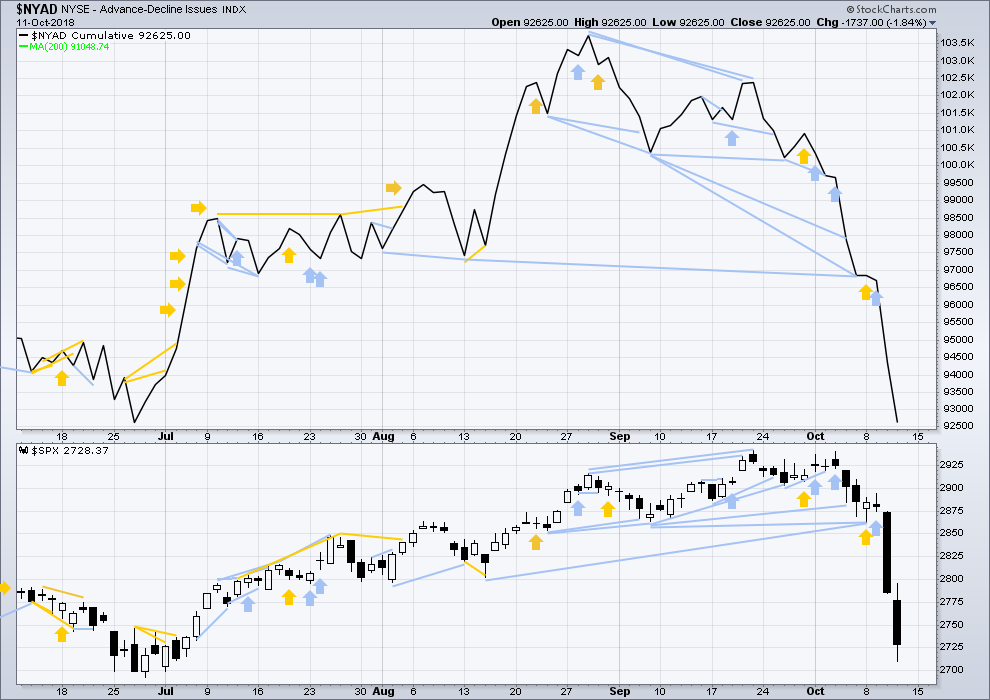
Click chart to enlarge. Chart courtesy of StockCharts.com.
There is normally 4-6 months divergence between price and market breadth prior to a full fledged bear market. This has been so for all major bear markets within the last 90 odd years. With no longer term divergence yet at this point, any decline in price should be expected to be a pullback within an ongoing bull market and not necessarily the start of a bear market. New all time highs from the AD line on the 29th of August means that the beginning of any bear market may be at the end of December 2018, but it may of course be a lot longer than that. My next expectation for the end of this bull market may now be October 2019.
Breadth should be read as a leading indicator.
There is now a cluster of bearish signals at the daily chart from the AD line; this offers now some reasonable support to the main Elliott wave count.
Downwards movement still has good support from falling market breadth. Importantly, there is no bearish divergence with the AD line and price between today’s low and the prior mid term swing low of the 27th / 28th of June. This absence of bearish divergence may indicate that downwards movement here may now be a little limited.
Both mid and small caps today have closed close to their lows. There are no long lower candlestick wicks as there is for large caps. This may indicate more downwards movement tomorrow as large caps catch up.
DOW THEORY
The following lows need to be exceeded for Dow Theory to confirm the end of the bull market and a change to a bear market:
DJIA: 23,360.29.
DJT: 9,806.79.
S&P500: 2,532.69.
Nasdaq: 6,630.67.
All of DJIA, DJT, S&P500 and Nasdaq have made recent new all time highs. This provides Dow Theory confirmation that the bull market continues.
Charts showing each prior major swing low used for Dow Theory may be seen at the end of this analysis here.
ANALYSIS OF INTERMEDIATE WAVE (3)
TECHNICAL ANALYSIS
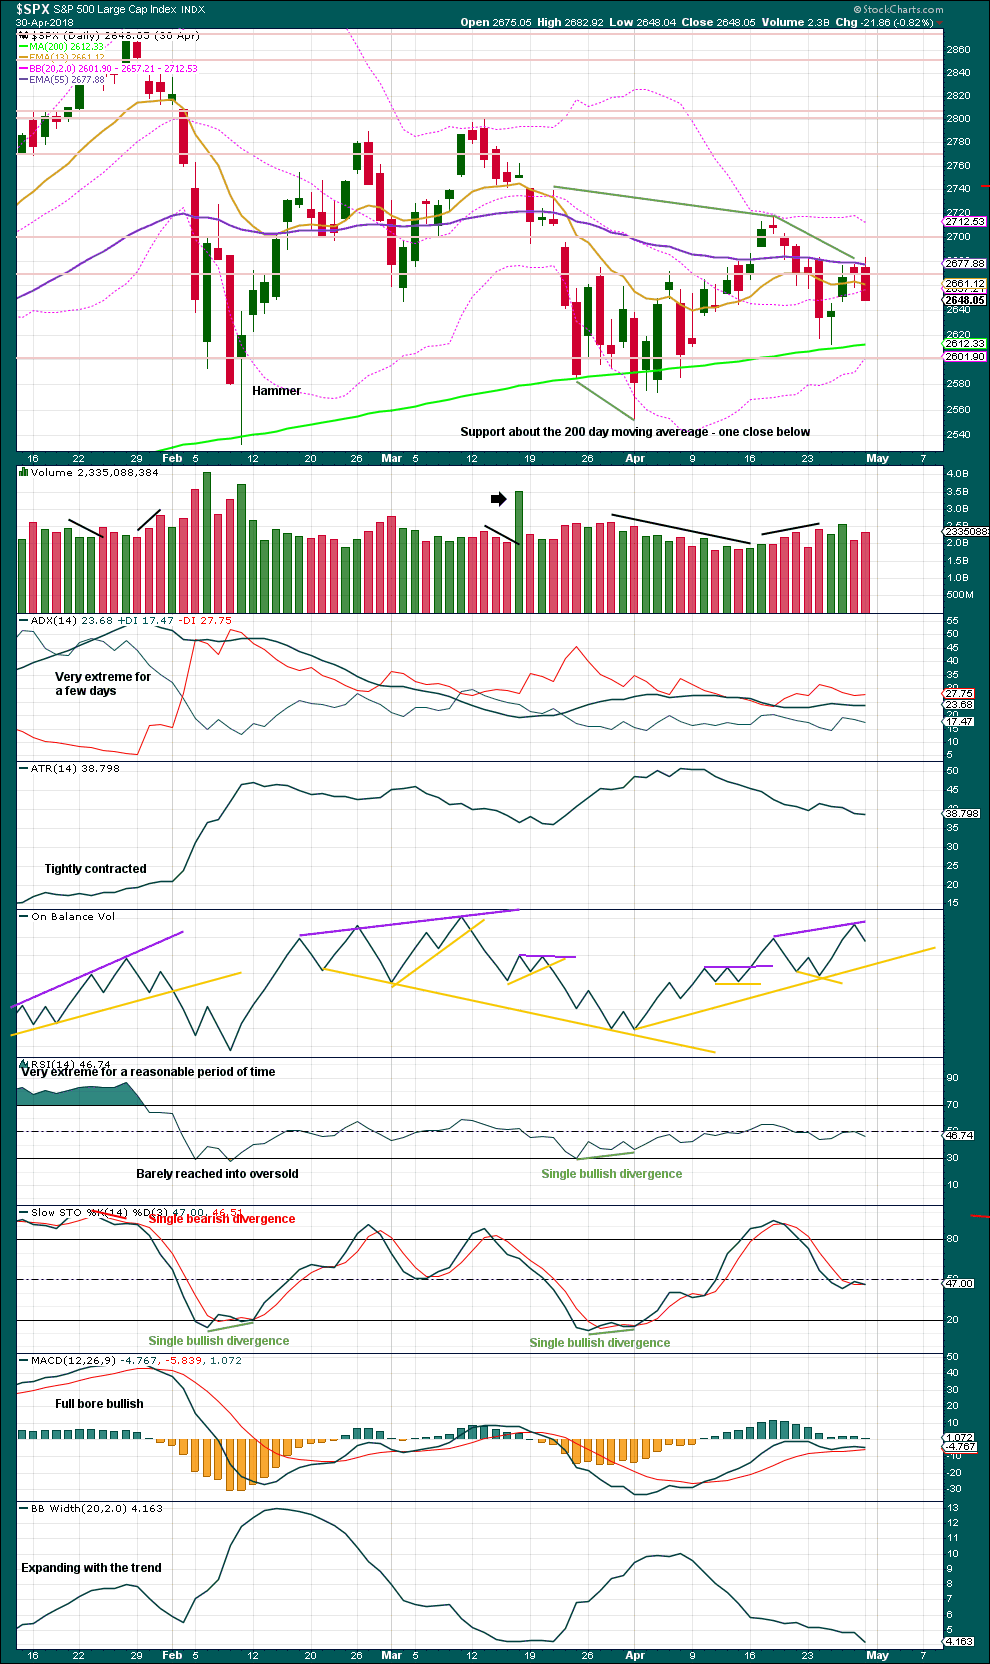
Click chart to enlarge. Chart courtesy of StockCharts.com.
Intermediate wave (4) was a large symmetrical triangle. The deepest wave was the first wave. At its low there was a clear candlestick reversal pattern and bullish divergence between price and Stochastics.
RSI barely managed to reach into oversold.
The current correction for primary wave 4 may behave differently, but there should be some similarities.
VIX
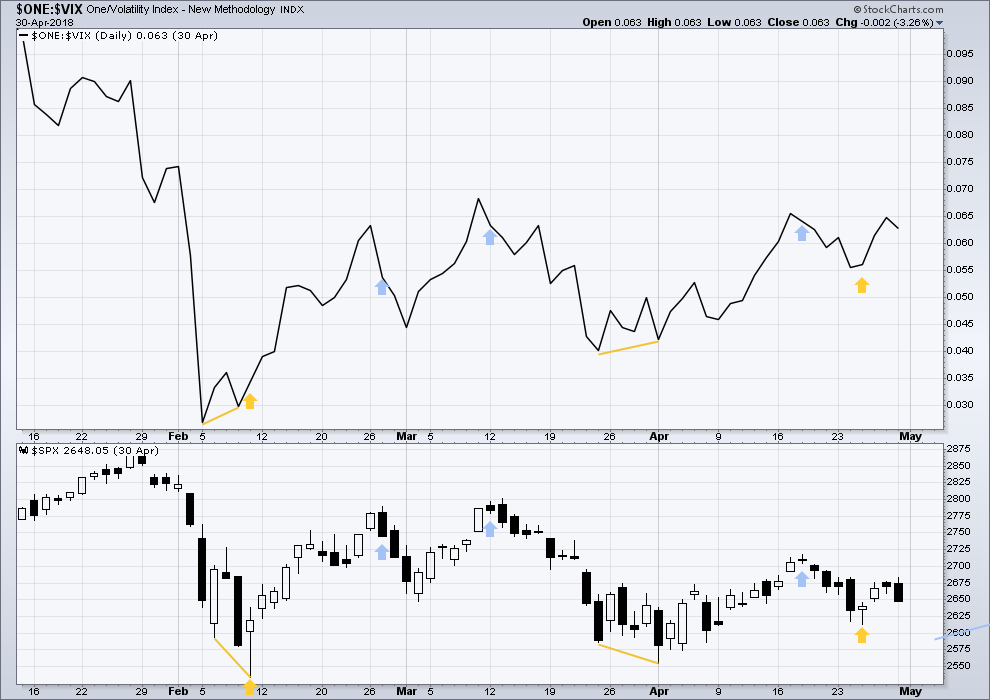
Click chart to enlarge. Chart courtesy of StockCharts.com.
This is a daily chart.
At the two major lows within intermediate wave (4), inverted VIX exhibited single short term bullish divergence.
At highs within intermediate wave (4), inverted VIX exhibited one single day bullish divergence with price.
AD LINE
Click chart to enlarge. Chart courtesy of StockCharts.com.
This is a daily chart.
At the two major lows within intermediate wave (4), there was bullish divergence between price and the AD line. At the two major highs within intermediate wave (4), there was each one instance of single day bearish divergence.
Published @ 09:20 p.m. EST.
—
Careful risk management protects your trading account(s).
Follow my two Golden Rules:
1. Always trade with stops.
2. Risk only 1-5% of equity on any one trade.
I mentioned PANW as a potential long when it’s sell off completed.
It’s either close, or perhaps there, depending on what you demand in your triggers. I’ve taken a small long position with an intention of cashing sometime next week (sold 10/19 puts at 200). A more cautious approach would be to wait for the 38% to get exceeded, except a most likely scenario is that the push up here is going to be very short and quick. So I’ve committed early, and hope to de-risk via sale of 1/2 around the 38%. Not trading advice.
A fascinating question: is this a counter trend trend, or a “with the trend” trade?
Updated hourly chart:
Minor wave 4 looks like a zigzag, minute wave a subdivides perfectly as a five wave impulse on the five minute chart.
Minute wave b looks incomplete, and it may not move beyond the start of minute a below 2,713.29.
When minute b is done, then another upwards wave for minute c may take minor 4 up to the 0.382 Fibonacci ratio.
When minor 4 is complete then I can use Fibonacci ratios between minor 5 and 1 to calculate a target for minor 5 to end. Without knowing where minor 5 begins I cannot do that yet. So I’ll just use support below about 2,700 as the most likely place for minor 5 to end.
Updated alternate hourly chart:
Minute i subdivides perfectly as a five wave impulse on the five minute chart.
1-2-3 of an impulse subdivides 5-3-5, exactly the same as A-B-C of a zigzag. So it fits for both wave counts this morning.
Minute ii may not move beyond the start of minute i. Minute iii should exhibit an increase in momentum and have some support from volume
JPM is squatting on a BIG 78.6% retracement level (105.8).
Of course, whether this market is going to launch some form of B or X wave up here…remains to be seen!!!
I think this statement in the update on the alternate daily meant to say “W”, not “X”.
“If primary wave 4 unfolds as a combination, then the first structure in a double may now be a completed zigzag labelled intermediate wave (X).”
Yes, thank you Kevin. Will fix.
JPM daily clean hit and turn off 78.6%. But no buy triggers of note yet.
Low projections for today ….?
I can’t do any better than “it’s staying inside the yellow Darvas box…” Probably.
Breaking up and out of that box (today or Monday) would be polarity inversion on the one hour chart (higher swing low and the prior swing high exceeded), and would trigger me into some tactical longs to get some of the B/X.
Breaking below the lower support/swing low and it appears price is in a final v down of the continuing A/W wave.
My take. This market is now quite challenging IMO, as all major corrections are.
The one month chart of RUT is showing the largest one month drop that I can find in 20 years of data. It’s massive. And when you look at the periods of “large drops”, you find late 2008, and early/mid 2015. Both end up selling off quite a bit more than we’ve seen so far in RUT.
Just more indications that the bloodbath overall is really in it’s early stages.
The two white lines are symmetric projections of the 2015 and 2008 corrections. The large one ends right at the 61.8% of the 2016-2018 up move, at 1249. A very likely bottom point in my view. Though each of the higher fibo’s could hold it…
Ordinarily triply leveraged instruments are not worth the paper the ticker symbols are written on. In a market such as the one we are entering they might be worth a second look.
After VX broke above and successfully tested top boundary of falling wedge we have had very good results on quick strikes with at-the-money option trades.
Hope everyone had great short entries at the highs today!
Enjoy your weekend!
Massive A/D rations in the indices…massive gap up….and prices going sideways to down.
“Fascinating…”
Today has the appearance of a market going absolutely nowhere. Yawn….
The NDX is bumping up against the upper descending channel line that matches the multi-day downtrend line underneath the price action. I don’t know if it’s significant…but a turn back down right there might be.
Note that the target stated in the overview wasn’t updated: the target per the daily charts is 2578! That will put the overall correction depth at greater than the depth of the intermediate 4. I suspect a bottom may eventually be 2531, the low of the intermediate 4, but that’s a few days or even weeks in the future.
Looking for weakness at 2800 and will start shorting again
Happy Friday everyone!!
It may not get that high. We are ringing the register on our long trades at the open and scaling back into massively long vol trades. I think margin call selling is not done. This decline should also finally blow up the VaR nonesense of the last few years as VX has broken above its falling wedge…finally!!!
Thanks Verne
FIRST?