
Another signal from the AD line to end the trading week gives strong confidence in the Elliott wave analysis.
In light of recent signals from the AD line and On Balance Volume, it is time to step back and look again at monthly charts for the Elliott wave count, and some key indicators.
Summary: Another new all time high from the AD line is very bullish. Expect upwards movement as most likely next week.
For the short term, a little more downwards movement may end about 2,686 to complete a classic pullback after an upwards breakout from the symmetrical triangle.
The long to mid term Elliott wave target is at 2,922, and a classic analysis target is now at 3,045.
Corrections are an opportunity to join the trend.
Always practice good risk management. Always trade with stops and invest only 1-5% of equity on any one trade.
New updates to this analysis are in bold.
The biggest picture, Grand Super Cycle analysis, is here.
An historic example of a cycle degree fifth wave is given at the end of the analysis here.
ELLIOTT WAVE COUNT
MONTHLY CHART
Click chart to enlarge.
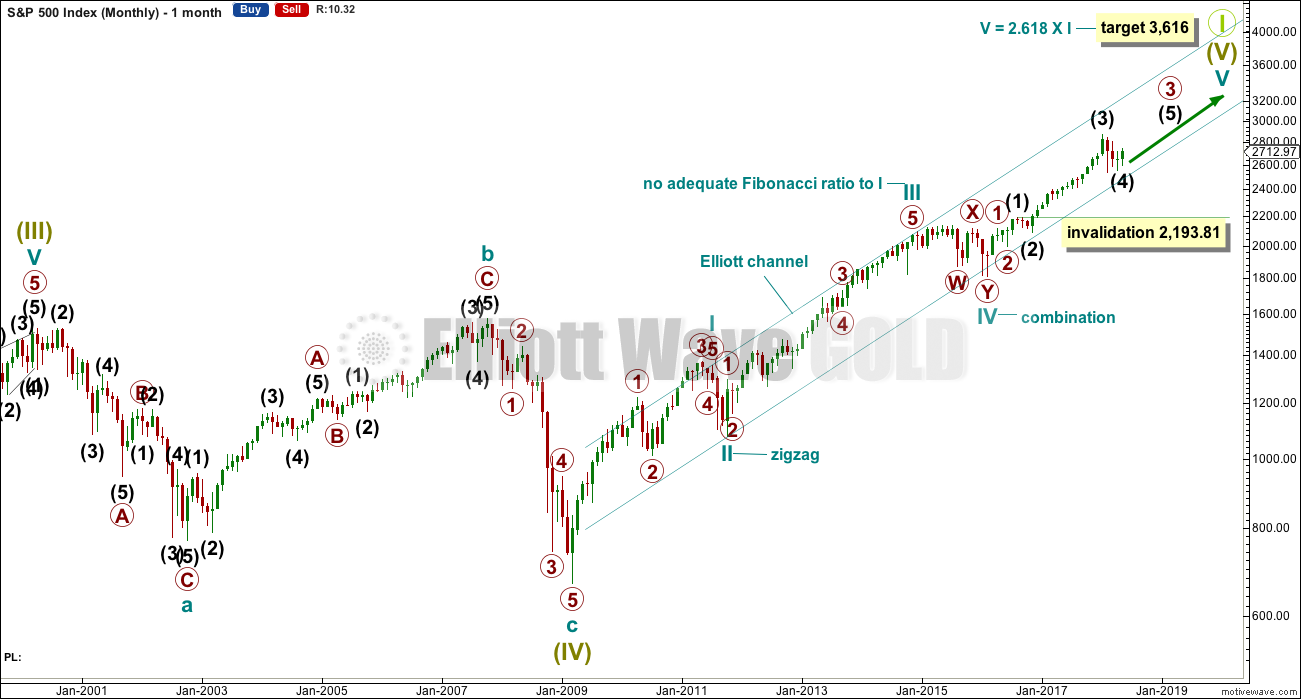
The large expanded flat labelled Super Cycle wave (IV) completed a 8.5 year correction. Thereafter, the bull market continues for Super Cycle wave (V). The structure of Super Cycle wave (V) is incomplete. At this stage, it is subdividing as an impulse.
There is no Fibonacci ratio between cycle waves I and III within Super Cycle wave (V). This makes it more likely that cycle wave V will exhibit a Fibonacci ratio to either of cycle waves I or III. Cycle wave V has passed equality in length with cycle wave I. The Fibonacci ratio of 2.618 is used for cycle wave V to allow enough room for the structure to complete.
The teal channel is drawn using Elliott’s first technique about an impulse. Draw the first trend line from the ends of cycle waves I to III (from the months of July 2011 to December 2014), then place a parallel copy on the low of cycle wave II. Cycle wave IV has found support very close to the lower edge of this channel, so the channel looks about right. The lower edge should continue to provide support, and the upper edge may provide resistance if price gets up that high.
Copy this large channel over to weekly and daily charts, all on a semi log scale. The lower edge will be important.
Cycle wave II was a shallow 0.41 zigzag lasting three months. Cycle wave IV is now seen as a more shallow 0.28 double combination lasting 14 months. Cycle wave II was a sharp movement that travelled a reasonable distance in a short time. Although cycle waves II and IV are disproportionate in terms of duration, the distance covered still gives the wave count the right look. There is excellent alternation between them.
Cycle wave I lasted 28 months (not a Fibonacci number), cycle wave II lasted a Fibonacci 3 months, cycle wave III lasted 38 months (not a Fibonacci number), and cycle wave IV lasted 14 months (one more than a Fibonacci 13).
Cycle wave V has begun its 27th month. The structure needs several more months to complete. It may last another 7 months to total a Fibonacci 34, or it may continue for as long as another 28 months to total a Fibonacci 55.
It is also possible that cycle wave V may not exhibit a Fibonacci duration.
Within cycle wave V, the correction for intermediate wave (4) may not move back down into intermediate wave (1) price territory below 2,193.81.
WEEKLY CHART
Click chart to enlarge.
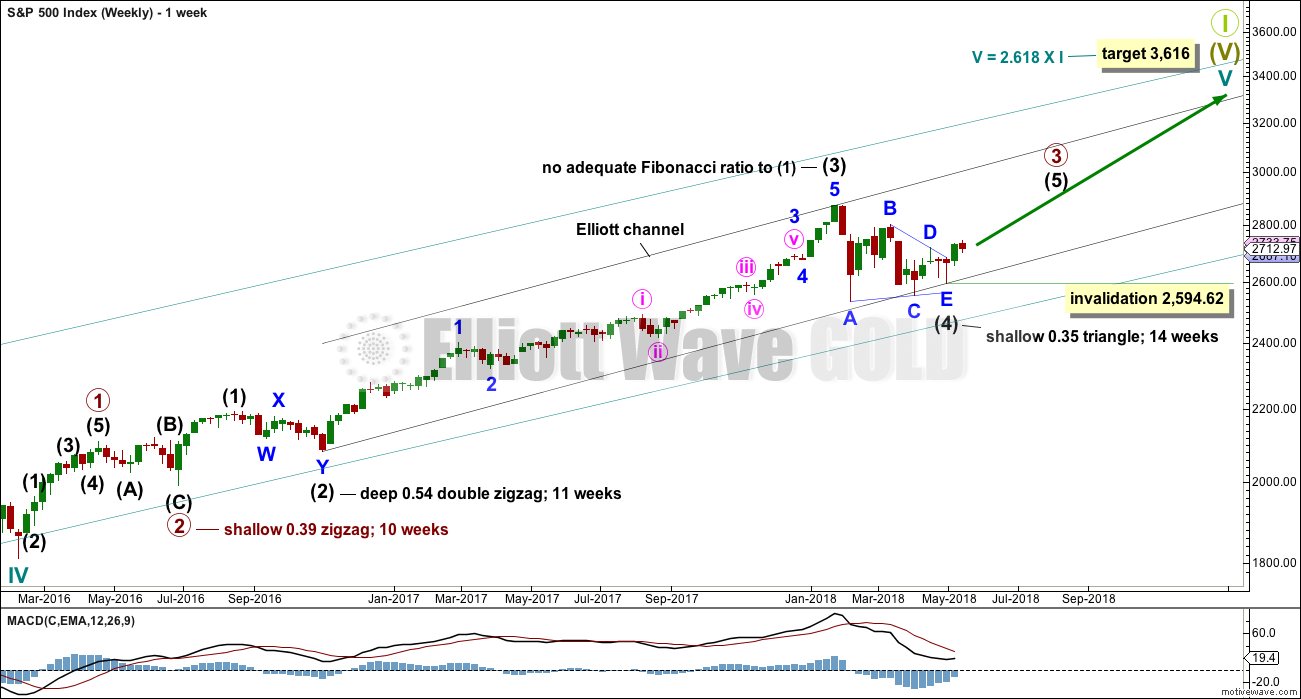
Cycle wave V must complete as a five structure, which should look clear at the weekly chart level. It may only be an impulse or ending diagonal. At this stage, it is clear it is an impulse.
Within cycle wave V, the third waves at all degrees may only subdivide as impulses.
Intermediate wave (4) has breached an Elliott channel drawn using Elliott’s first technique. The channel is redrawn using Elliott’s second technique: the first trend line from the ends of intermediate waves (2) to (4), then a parallel copy on the end of intermediate wave (3). Intermediate wave (5) may end either midway within the channel, or about the upper edge.
Intermediate wave (4) may now be a complete regular contracting triangle lasting fourteen weeks, one longer than a Fibonacci thirteen. There is perfect alternation and excellent proportion between intermediate waves (2) and (4).
If intermediate wave (4) were to continue further as either a flat or combination, both possibilities would require another deep pullback to end at or below 2,532.69. With both On Balance Volume and the AD line making new all time highs, that possibility looks extremely unlikely.
If intermediate wave (4) were to continue further, it would now be grossly disproportionate to intermediate wave (2). Both classic technical analysis and Elliott wave analysis now suggest these alternate ideas should be discarded based upon a very low probability.
The AD line today makes yet another all time high, so the invalidation point is moved higher at the weekly chart level. Within intermediate wave (5), no second wave correction may move beyond the start of its first wave below 2,594.62.
DAILY CHART
Click chart to enlarge.
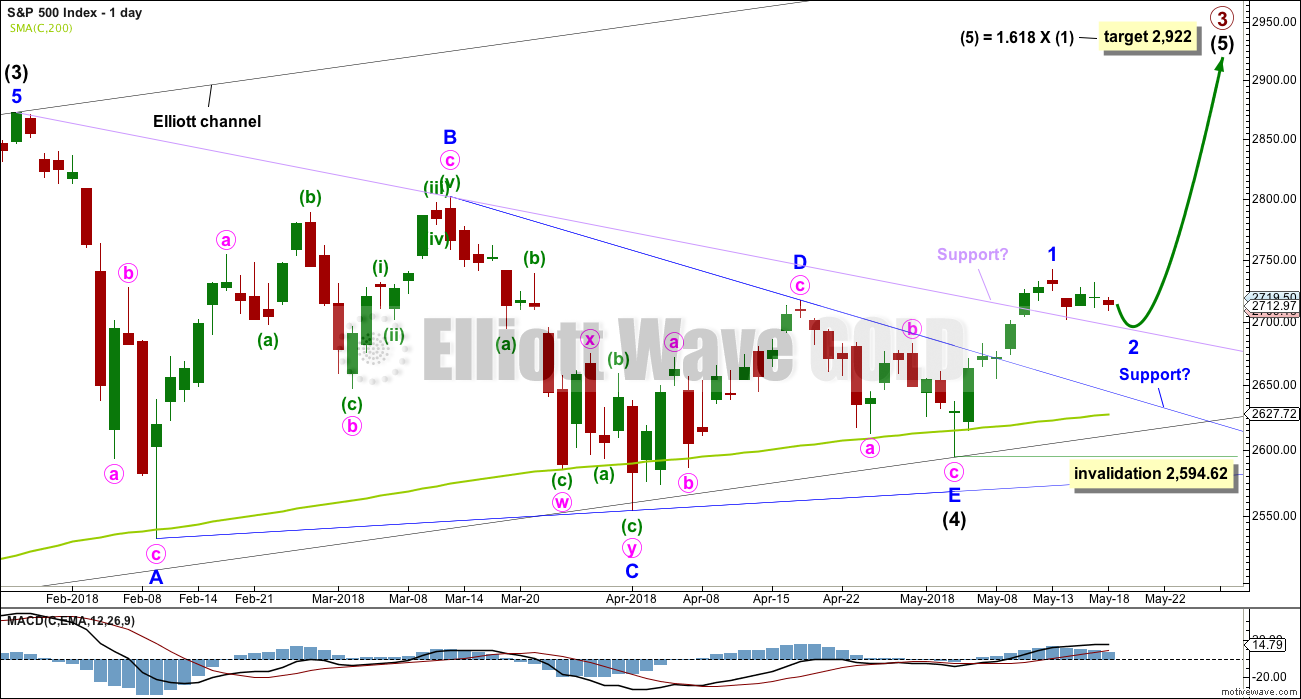
It is possible that intermediate wave (4) is a complete regular contracting triangle, the most common type of triangle. Minor wave E may have found support just below the 200 day moving average and ending reasonably short of the A-C trend line. This is the most common look for E waves of triangles.
Intermediate wave (3) exhibits no Fibonacci ratio to intermediate wave (1). It is more likely then that intermediate wave (5) may exhibit a Fibonacci ratio to either of intermediate waves (1) or (3). The most common Fibonacci ratio would be equality in length with intermediate wave (1), but in this instance that would expect a truncation. The next common Fibonacci ratio is used to calculate a target for intermediate wave (5) to end.
Price has clearly broken out above the upper triangle B-D trend line. This indicates that it should now be over if the triangle is correctly labelled.
A resistance line in lilac is added to this chart. It is the same line as the upper edge of the symmetrical triangle on the daily technical analysis chart. Upwards movement has sliced cleanly through this line, finding no resistance before breaking it. This line may offer some support for any pullbacks. Price is finding support at that line so far. A breach of that line does not mean the classic triangle is invalid and that price must make new lows, only that the pullback is deeper. Look for next support at the blue Elliott wave triangle B-D trend line.
Sometimes the point at which the triangle trend lines cross over sees a trend change. A trend change at that point may be a minor one or a major one. That point is now about the 5th of June.
HOURLY CHART
Click chart to enlarge.
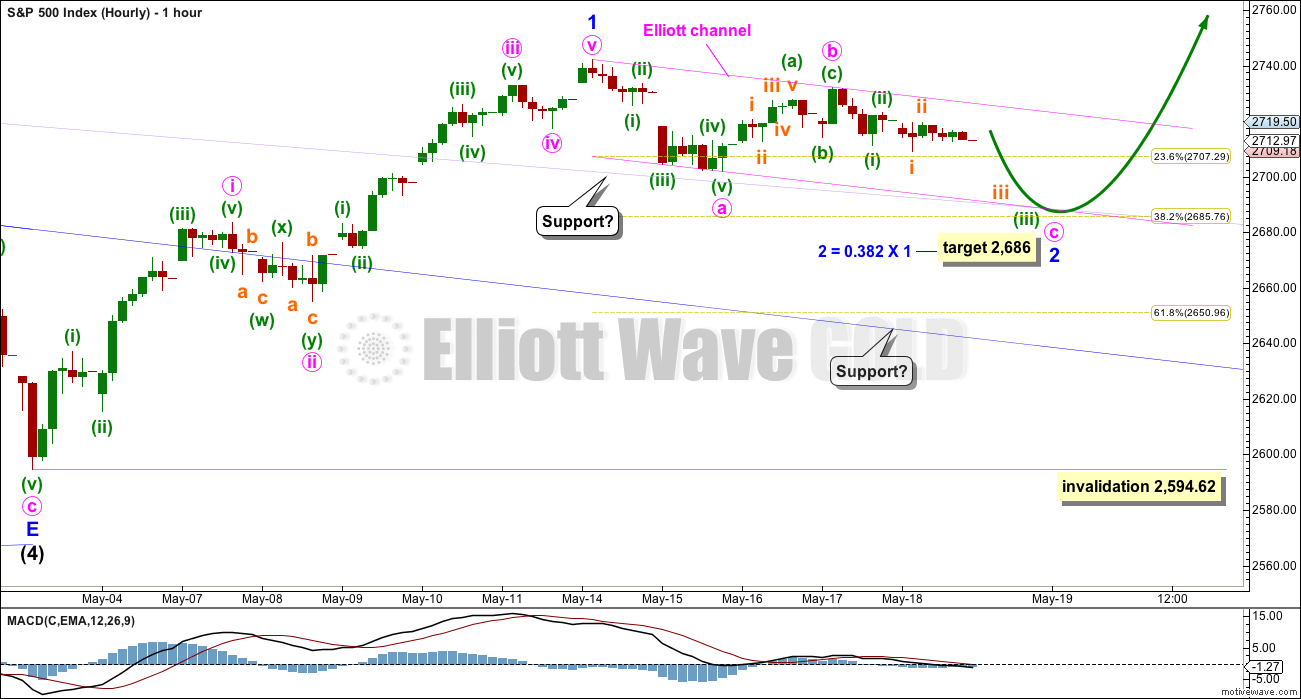
Minor wave 1 may be a complete five wave impulse. The middle portion of minuette wave (iii) does not have as good a look for this wave count, but the S&P does not always have good looking impulses.
Minor wave 1 may have lasted seven days. Minor wave 2 may be expected to last about three to eight days to have reasonable proportion to minor wave 1. Targets for minor wave 2 may be the 0.382 and 0.618 Fibonacci ratios. If it ends about the 0.382 Fibonacci ratio, then it may continue to find support at the lilac trend line (copied over from the daily chart).
Minor wave 2 may be subdividing as a zigzag, and within it minute wave a may be a complete five wave impulse. If minute wave a is correctly labelled as a five, then minute wave b may not move beyond its start above 2,742.10.
It is also possible that minute wave a is incorrectly labelled. It may be a complete double zigzag. If minute wave a is a corrective structure, then minor wave 2 may be unfolding as a flat correction. Within a flat correction, minute wave b may make a new high above the start of minute wave a at 2,742.10 as in an expanded flat. It is for this reason that an upper invalidation point is not added to this hourly chart.
Minor wave 2 may not move beyond the start of minor wave 1 below 2,594.62.
ALTERNATE HOURLY CHART
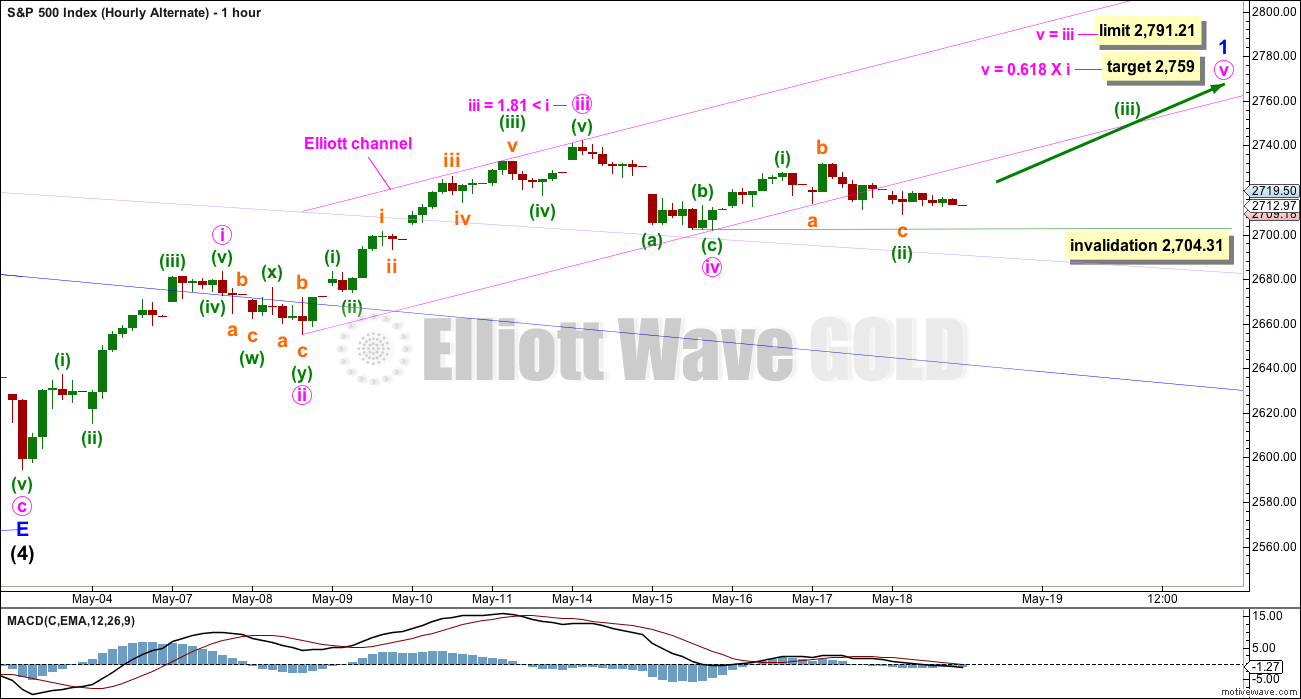
Click chart to enlarge.
This hourly chart is swapped over to an alternate today because the upwards sloping pink Elliott channel has been breached by some sideways movement. This slightly reduces the probability of this wave count.
Minor wave 1 may be incomplete, and within it minute waves i, ii, iii and iv may all be complete. Only minute wave v may now be needed to complete an impulse upwards.
Minute wave iii is slightly shorter than minute wave i. So that the core Elliott wave rule stating a third wave may never be the shortest is met, minute wave v has a limit of no longer than equality in length with minute wave iii.
Within minute wave v, minuette waves (i) and (ii) may be complete. If minuette wave (ii) continues any further, then it may not move beyond the start of minuette wave (i) below 2,704.31.
So far minute wave v is not remaining neatly within the pink Elliott channel. This is typical behaviour from the S&P. It will often breach channels but continue in the old direction. However, the breach is now reasonable.
ALTERNATE MONTHLY CHART
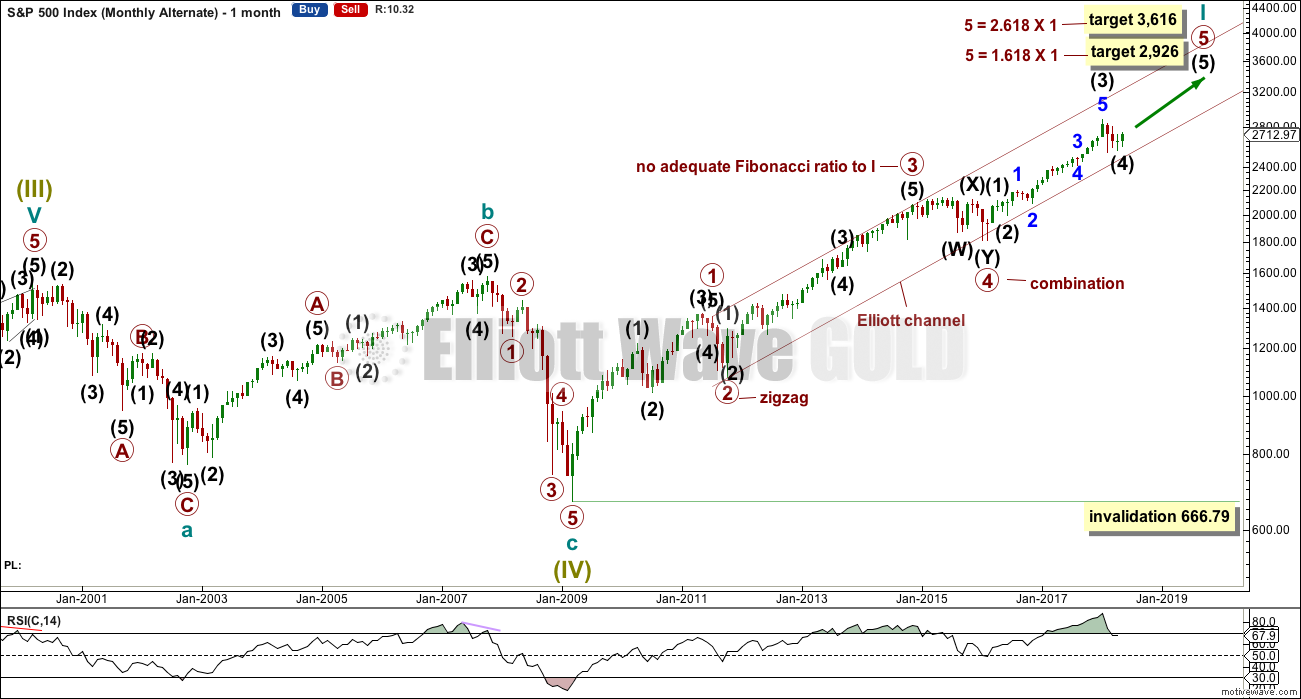
Click chart to enlarge.
This alternate wave count is identical to the main monthly chart up to the low labelled Super Cycle wave (IV). Thereafter, only the degree of labelling is moved down one degree and the subdivisions of the following bull market are seen in the same way.
In the Grand Super Cycle analysis, Super Cycle wave (I) lasted over 60 years (my data does not go all the way to the start of Grand Super Cycle wave I); Super Cycle wave (II) lasted just 8 years (the market crash which began in 1929); Super Cycle wave III lasted 66 years, up to the high of 2000; and, Super Cycle wave (IV) ending in March 2009 lasted just 8.5 years.
Both of Super Cycle waves (I) and (III) are long extensions. This means Super Cycle wave (V) may not be a long extension because only two of the three actionary waves within Grand Super Cycle wave I may be extended.
If the degree of labelling within Super Cycle wave (V) is moved down one, it may be that only cycle wave I is nearing its end. The following correction for cycle wave II may not move beyond the start of cycle wave I below 666.79.
If only cycle wave I is nearing an end, then so far it has lasted 9 years. This does not look right for the Grand Super Cycle analysis because it would have to see a longer third wave for cycle wave III, and then Super Cycle wave (V) would look extended and the Elliott wave rule would be violated.
However, it is possible that cycle wave III could be relatively short, as could cycle wave V to end Super Cycle wave (V). And so this alternate may be considered, although it looks like it may have a low probability if the Grand Super Cycle wave count is correct.
TECHNICAL ANALYSIS
MONTHLY CHART
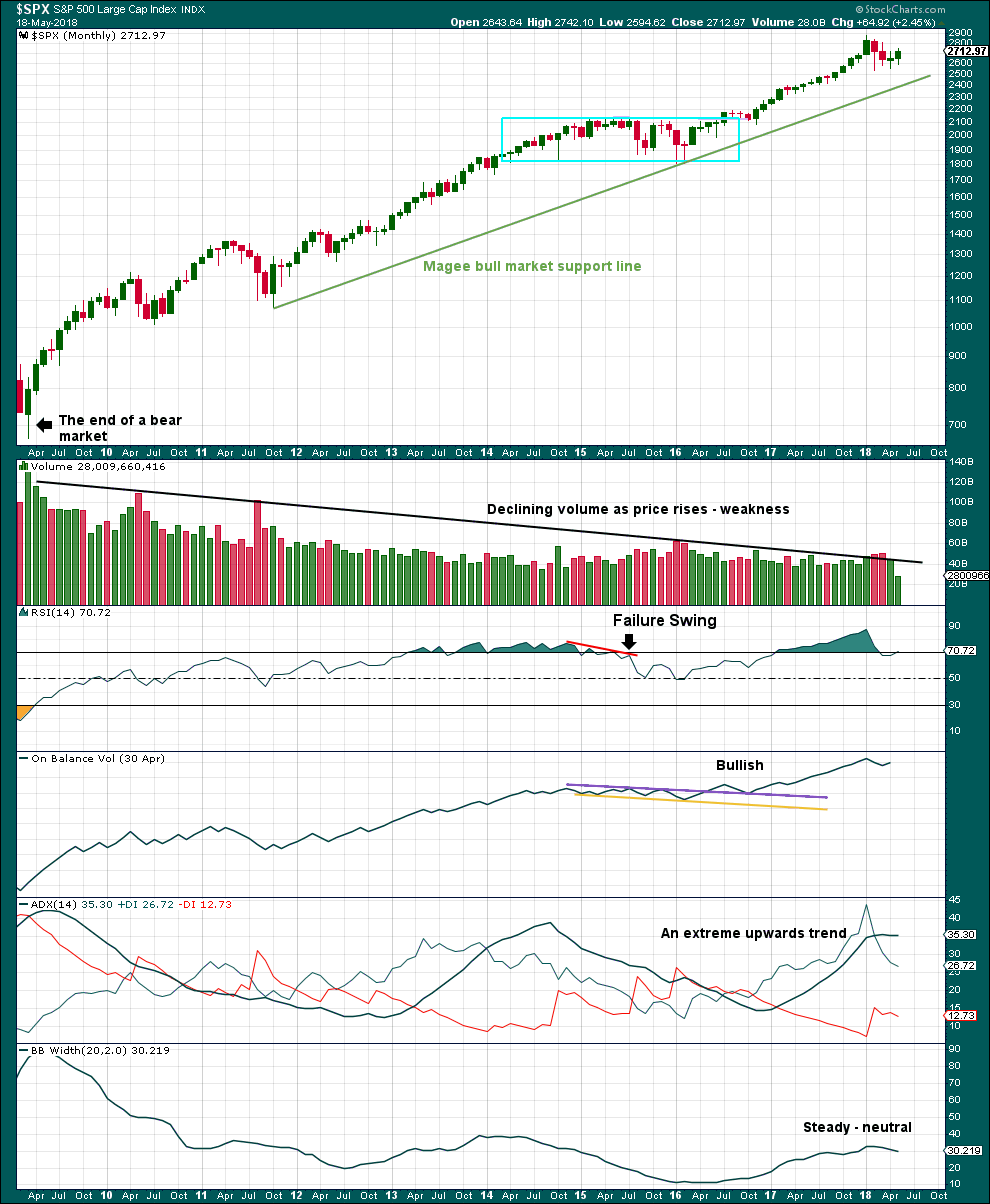
Click chart to enlarge. Chart courtesy of StockCharts.com.
This monthly chart shows the entire bull market from the low in March 2009.
A persistent feature of this bull market is rising price on declining volume. This is normally unsustainable, but in this market the fact is it has been sustained now for some years. It must be accepted that it could continue further yet for more years.
Eventually, this bull market will end as they all do. When the bear market arrives, light volume indicates there may be little support for falling price. The eventual bear market could see price fall very far very fast.
ADX can remain very extreme for many months in a strong bull market. It is hopeless as a timing tool for an end to a bull run, even at this time frame.
The Magee bull market trend line is drawn across the first two major swing lows. It should be assumed the bull market remains intact while price remains above this line. If this line is breached at the monthly chart level, then a bear market may have arrived.
At its end, I will be looking for the following conditions before a bear market may be considered:
1. Divergence between price and RSI, and preferably another failure swing.
2. A bearish signal from On Balance Volume.
3. Finally, a breach of the Magee bull market trend line.
WEEKLY CHART
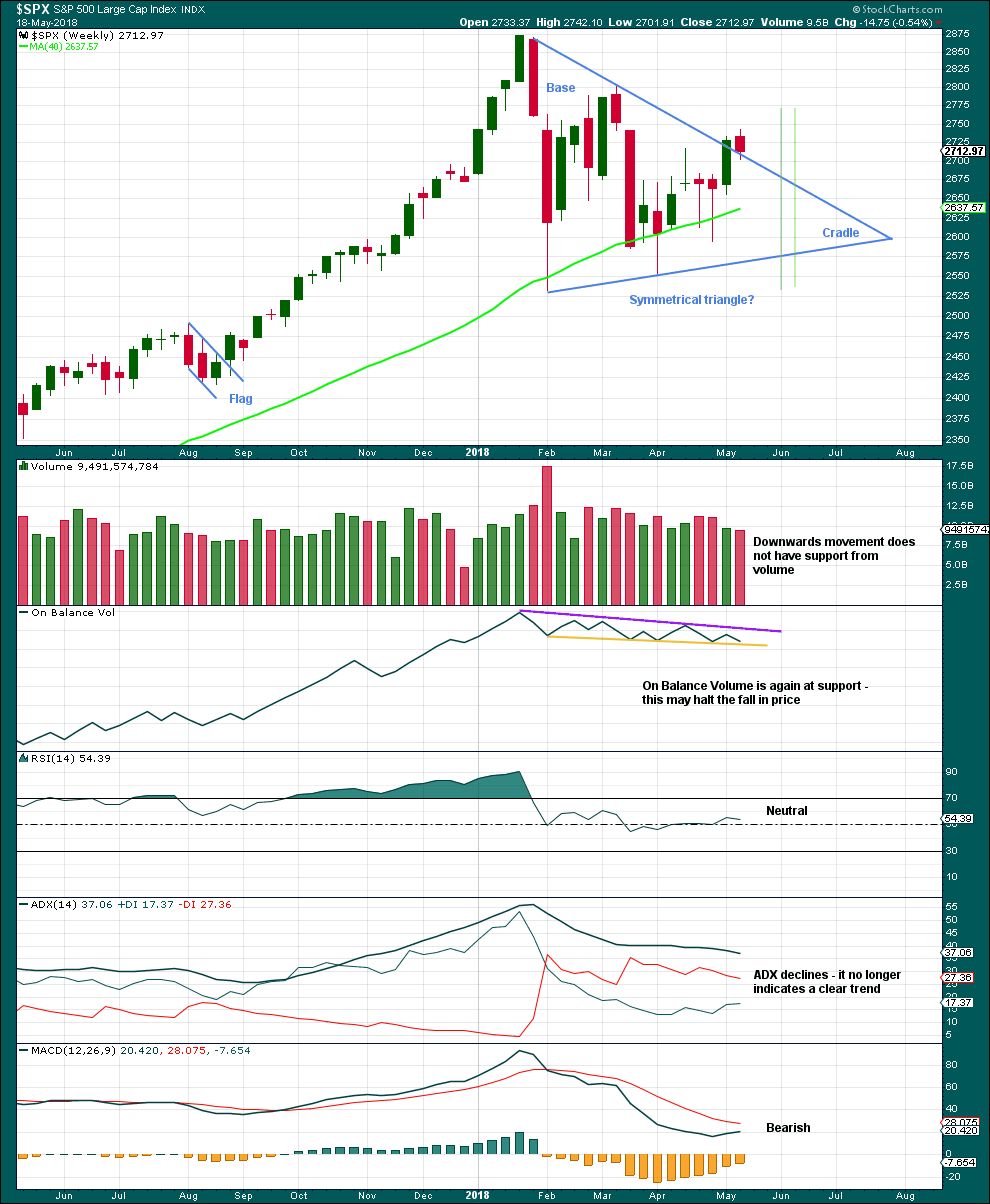
Click chart to enlarge. Chart courtesy of StockCharts.com.
From Dhalquist and Kirkpatrick on trading triangles:
“The ideal situation for trading triangles is a definite breakout, a high trading range within the triangle, an upward-sloping volume trend during the formation of the triangle, and especially a gap on the breakout.”
For this example, the breakout may have now happened. There was a high trading range within the triangle, but volume declined. A downwards week may be a typical pullback following the breakout.
DAILY CHART
Click chart to enlarge. Chart courtesy of StockCharts.com.
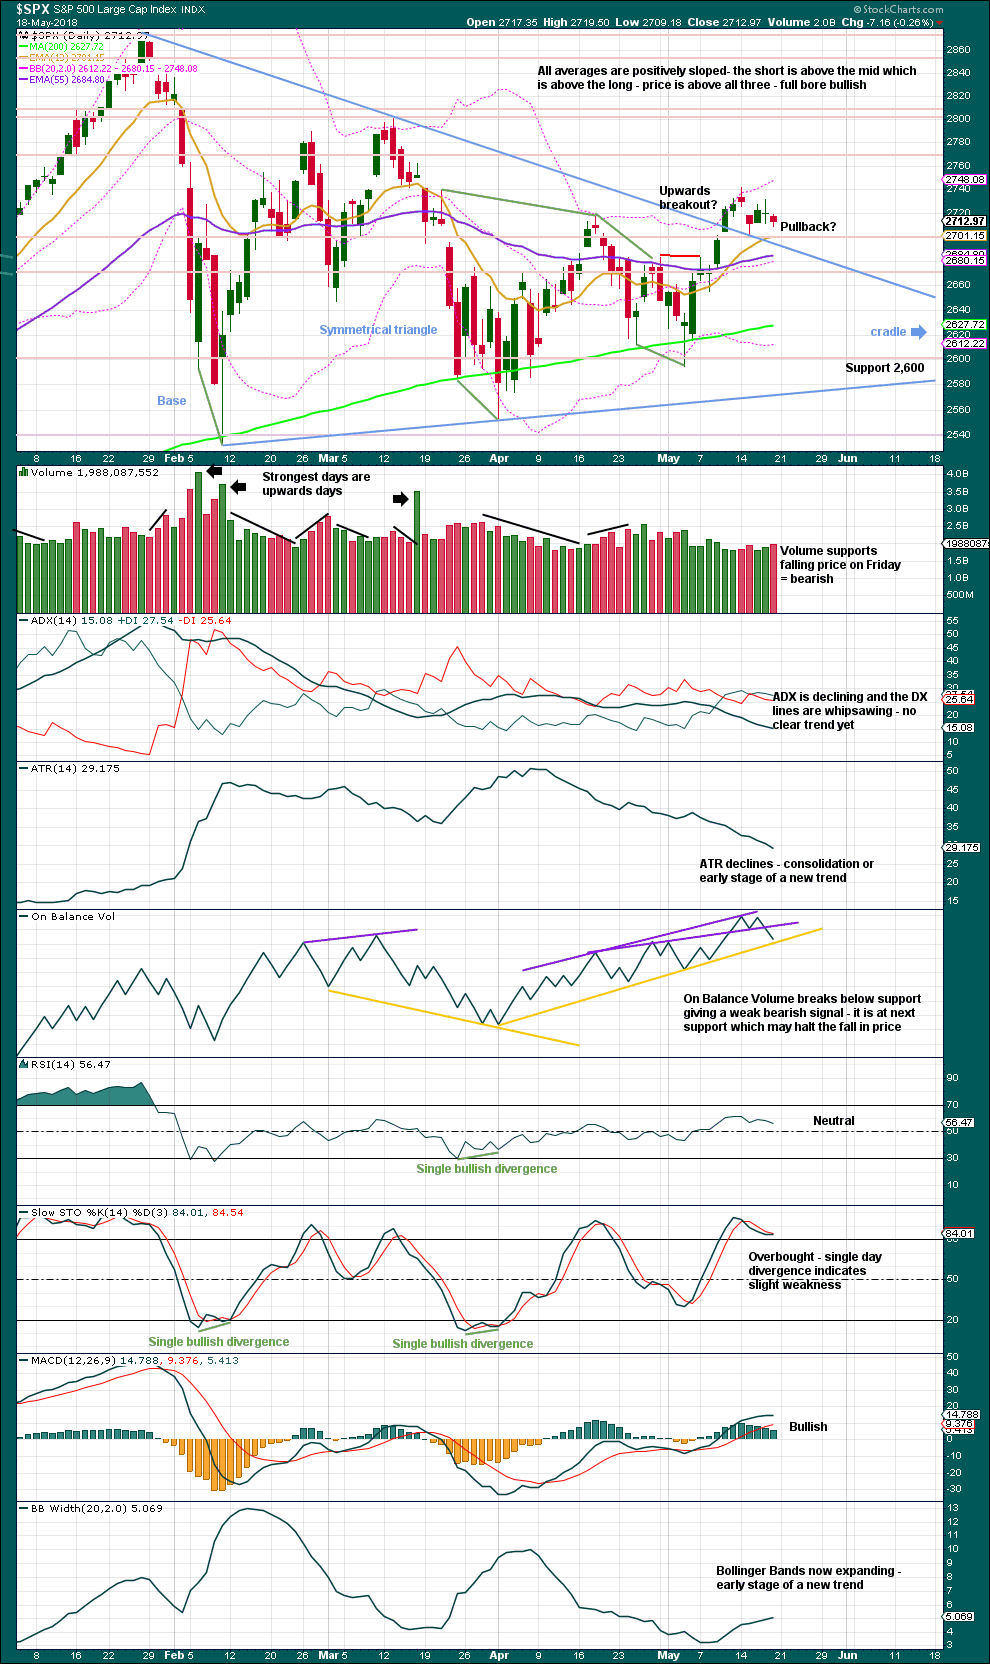
The symmetrical triangle may now be complete, and price has completed an upwards breakout. There may be some small cause for concern that the upwards breakout does not have support from volume. However, in current market conditions only some small concern is had here. Rising price on light and declining volume has been a feature of this market for years, yet price continues to rise.
After an upwards breakout, pullbacks occur 59% of the time. A pullback may find support at the upper triangle trend line and may be used as an opportunity to join a trend.
Symmetrical triangles suffer from many false breakouts. If price returns back into the triangle, then the breakout will be considered false and the triangle trend line will be redrawn.
The base distance is 340.18. Added to the breakout point of 2,704.54 this gives a target at 3,044.72. This is above the Elliott wave target at 2,922, so the Elliott wave target may be inadequate.
For the short term, the next smaller consolidation or pullback may come about 2,811. This shorter term target is calculated using the measuring gap. That gap may now provide support and may be used to pull up stops on long positions. The gap still remains just open; this target remains valid.
On Balance Volume has made a new all time high, providing a very strong bullish signal; expect price to follow. The bearish signal from On Balance Volume breaking below the purple support line is weak because this line has been broken recently. The next support line offers slightly better technical significance; it may halt the fall in price now.
VOLATILITY – INVERTED VIX CHART
Click chart to enlarge. Chart courtesy of StockCharts.com. So that colour blind members are included, bearish signals
will be noted with blue and bullish signals with yellow.
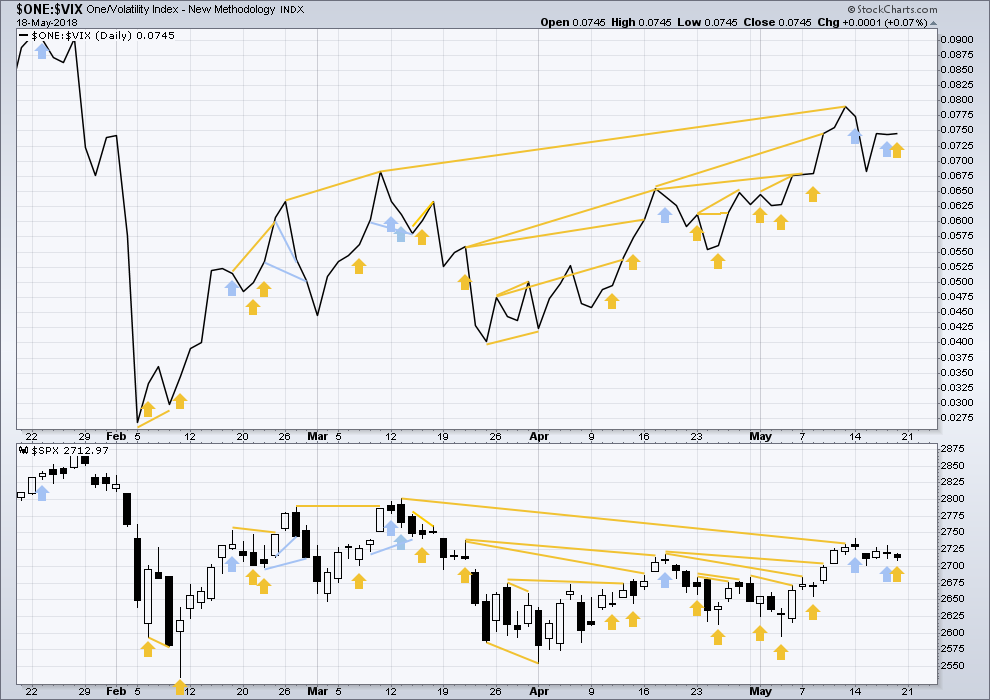
Normally, volatility should decline as price moves higher and increase as price moves lower. This means that normally inverted VIX should move in the same direction as price.
There is still a cluster of bullish signals on inverted VIX. Overall, this may offer support to the main Elliott wave count.
Inverted VIX is much higher than the prior swing high of the 9th / 13th March, but price is not yet. Reading VIX as a leading indicator, this divergence is bullish.
Price moved slightly lower, but inverted VIX moved slightly higher. This divergence is bullish, but only weakly so.
BREADTH – AD LINE
Click chart to enlarge. Chart courtesy of StockCharts.com.
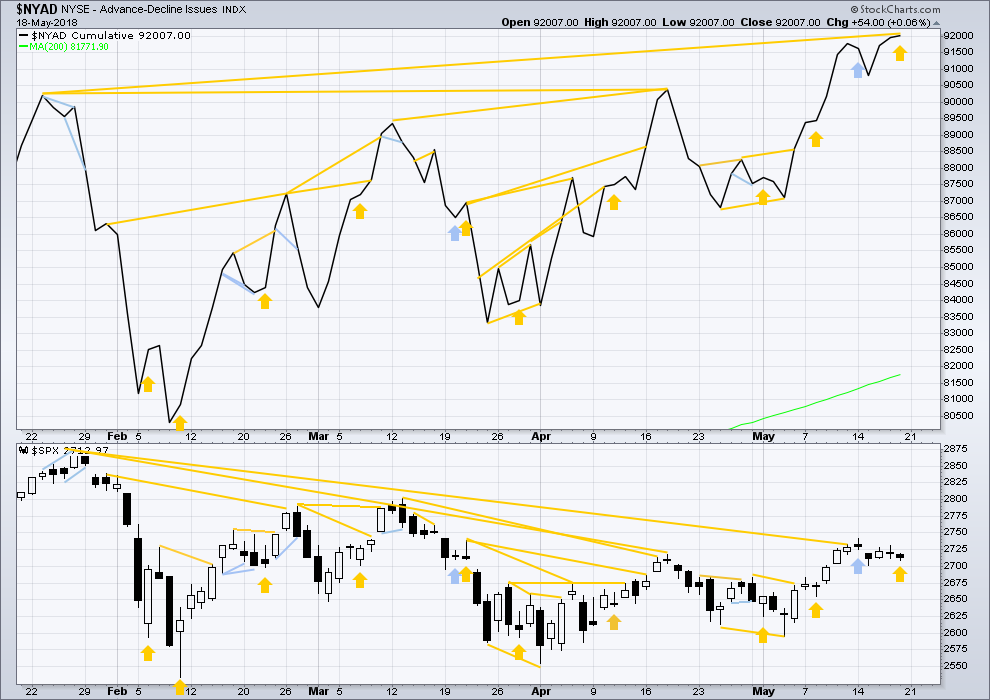
There is normally 4-6 months divergence between price and market breadth prior to a full fledged bear market. This has been so for all major bear markets within the last 90 odd years. With no longer term divergence yet at this point, any decline in price should be expected to be a pullback within an ongoing bull market and not necessarily the start of a bear market. New all time highs from the AD line means that any bear market may now be an absolute minimum of 4 months away. It may of course be a lot longer than that. My next expectation for the end of this bull market may now be October 2019.
Small caps continue to make new all time highs, but mid and large caps have yet to do so. This divergence may be interpreted as bullish. Small caps may now be leading the market.
Breadth should be read as a leading indicator.
There has been a cluster of bullish signals from the AD line in the last few weeks. This also overall offers good support to the main Elliott wave count.
The AD line has made another new all time high. This is a very strong bullish signal, and is one reason why the more bearish Elliott wave counts are discarded. It is extremely likely now that price shall follow with a new all time high.
Price moved slightly lower, but the AD line moved slightly higher to make another new all time high. The divergence is weakly bullish, but the new all time high supports the Elliott wave count at higher time frames. When the AD line makes new all time highs, expect price to follow.
DOW THEORY
The following lows need to be exceeded for Dow Theory to confirm the end of the bull market and a change to a bear market:
DJIA: 23,360.29.
DJT: 9,806.79.
S&P500: 2,532.69.
Nasdaq: 6,630.67.
At this stage, only DJIA has made a new major swing low. DJT also needs to make a new major swing low for Dow Theory to indicate a switch from a bull market to a bear market. For an extended Dow Theory, which includes the S&P500 and Nasdaq, these two markets also need to make new major swing lows.
Charts showing each prior major swing low used for Dow Theory may be seen at the end of this analysis here.
Published @ 04:28 a.m. EST on 19th May, 2018.
Hourly charts updated:
Main: This still looks entirely valid. Minute b still remains just below the start of minute a.
Alternate updated:
I’ve adjusted the channel. Sometimes you have to do that for the S&P. It just will not respect channels. No respect.
A really big Thank You to Kevin for sharing your work here with all the membership. Much appreciated!
You’re welcome, hope its of value to some. Would love to see other’s work, too.
I hope this is a bull flag on the SPX 15 minute…and the alternative lives! I’d rather not go through a c wave down in a 2 here, but if we must, we must.
Looking lively…go dog!!!
thx kevin for sharing your counts.
Im not an expert on EW. this wave counting thing is hard for me but learning from you guys and Lara! Here is what I see on the SPX. A retest of 2750, then a pullback and then 2800. Im long with some December’18 options and will use Verne technique for short term entry….
Some feedback for you Jules:
I can’t quite see if there’s a letter or number underneath the lowest bar on that chart, but if there isn’t then you’d have to move your C [C] down to that low. Because [D] has to begin at that low, because it has to be a zigzag and within a zigzag it’s B wave may not move beyond the start of its A wave.
Regarding the impulse upwards which is labelled [1]:
Starting off with 1, 2, i (circle), ii (circle) looks perfect. Try moving your brown iii (circle) over to the last little high, and then brown iv (circle) to the next little low. Now you’d be waiting for just brown v (circle) to end the impulse of 3.
So you could have an invalidation point up at 1; when 3 is complete, the following little correction for 4 may not move into 1.
Does that make sense?
Yes it does! Thanks for the feedback. One thing I’m struggling with when counting is that the SPX does not always display nice fib ratios between its wave 3 and wave1.
One question Lara: do you subscribe to the notion that US major Indexes should be in SYNC or have relatively close EW counts? Since they are different markets, doesn’t it feel like they shouldn’t ?
Thanks
I do not.
They are separate markets. They may be similar, and at highest time frames may be in a similar wave, but there will be important differences.
Most especially their corrective structures. They may all be within a cycle degree correction at the same time, but they may trace out different patterns.
As for the lack of Fibonacci ratios for the S&P, it does make target calculation rather difficult. Use resistance / support lines for targets. And as the third wave comes to an end, look at the Fibonacci ratios at the lower degrees within it and try to see if you can calculate a confluence of ratios at multiple degrees to give you a small target zone.
btw the high today is right at the 61.8% retrace of the entire initial A wave down off the Jan 28 high (2738). A key, key, key level. It’s been busted before…but not by a motive wave (minor 1) of the new intermediate 5!! Getting through it here will be significant. A failure and gap fill and further push down would put a giant question mark (at best) on the alternate hourly. I don’t like the main hourly…I want out of 2 land!!!! So I’m anxiously awaiting this confirmation that the alternate main is alive and kicking. There’s more room to the upside to rumble if it is.
How I see SPX right now. Based on the alternate hourly. Yellow lines project the top of the minute 5 (and overall minor 1). Based on 5-1, 5-3, and 5-1/3 ratios, and 1.27% extensions of 3 and 1-3. A veeeeery nice day for me, hope all are scoring here!
thanks for the chart….. i’ve been getting caught on the wrong side of the alternates lately
you’re welcome Peter! I’ve been approaching the market with the view of “I’m very confident in the intermediate term bull trend here (i.e., an intermediate 5 is launched or will launch within a month or two, LATEST). But I’m skittish re: the potential for more BIG swings down ala the last 4 months.” So I’ve been using longer term options for trading long, mostly, under the theory that if wrong short term (1) I have limited downside risk due to the structure of options (2) the intermediate bull trend will rescue me and show me profits or least a reasonable break eventually even if I’m wrong in the shorter term. I.e., I have an elliott wave “backstop”, and the max risk of the option itself as the effective guaranteed stop (though I might bail with a loss earlier depending, certainly). And lastly, I take short term shorts to milk the market and help hedge my long positions when retracements (2’s, 4’s) start up. Working out alright so far.
Biggest secular trend in town is US interest rates moving up. Here’s TLT MONTHLY, showing a rather substantial breakdown on the verge of launching. This month the trend has advanced to STRONGLY down, and price is sitting on it’s support zone. If (when?) price breaks through 114-117 May-Jan of 2013 becomes the model I’ll be trading for, a drop of over 15%. I will continue to build my short position here as this develops. Secular moves like this can be golden.
30 Year Treasury still Can NOT break above a 3.26%!!!
Repelled again on Friday! May go back below 3.00%!
You can’t believe rates are moving higher for real… unless and until 3.26% is broken and accelerates higher. Anything else is just more NOISE and pure BS!
Looks like I keep making $$ on BS then. Okay with me.
My hourly view of the RUT. Looks to be about complete or very soon to complete a motive wave up. (bright green = strong up trend, yellow = mild up trend, gray = neutral, orange = mild down trend, red = strong down trend). Price is very close to a 127% extension (of the 3 wave) and the 3 other red lines are symmetric projections of prior upswings. The LeGuerreRSI and the stochastic are long overbought and turning down. (The red and green sma lines are 200 and 50 period.) The boxes around price are “Darvas” boxes. I view falling prices here as a nice short term short set up.
My bearish view of the SPX (SPY specifically here). Almost everything on this chart screams to me “leg down coming NOW”. Price bounced against and away from top keltner (orange), stochasticRSI has triggered “short”, and the weekly shows a dark cloud cover candlestick. However, the last few days do resemble typical consolidation patterns during strong uptrends (first ellipse on left). Then again, so did the couple of days just prior to the W wave pounding down (second ellipse on left), but that was after a clear blow-off top, not the current situation. The three prior major downswings all started immediately with strong red bars, unlike last week’s action.
The EW markings here revive the DREADED COMBINATION, which is not dead as a possibility. I refuse to be surprise by this market, and this (for us anyway) would be the “surprising” action that would if not handled well, potentially crushing. The yellow lines around the recent price action tell me what’s up next, and I’ll be aggressively pursuing the market either way as it breaks. Good luck and be careful next week!!!
Oops I cut off a piece of that chart, and in fact the keltners are blue and the bollinger bands orange; price ran into both of them, ending a multi-day squeeze, and started consolidating under them. (As for the big white vertical line, well, these are the mysteries of Motivewave, because I haven’t a clue how that got there or how to get rid of it yet, try as I might! Lol!!!)
Kevin,
I think there is an EW rule that does not allow a combination w-x-y within another combination or something like that. I suspect Lara will comment on this proposed count it she has time and notices it.
Have a great day and see you (read you) later. I am headed to California at the end of the week for a family wedding. Looking forward to it.
Cheers,
Well, I may have messed it up Rodney, but this count was lifted verbatim from Lara’s own from a week or so ago, just before she dropped it. I might have made a mistake, but I checked it pretty carefully…”it should be good”. I don’t put the probability very high of this but my point is it is STILL possible, this market has been surprising, and I at least hate surprises when my money is involved, lol!!! BTW, I believe the rule is that one level of combo nesting is allowed, but not two. This only has one.
A wedding party in CA in late May should be a lot of fun! Just don’t be “that guy” that indulged in too much bubbly (my brother was occasionally “that guy”, lol!). Hope you get excellent weather.
This one is okay. Neither W nor Y are labelled W-X-Y within them.
It’s wave B within Y which is labelled as a double zigzag. That’s okay. That B wave may be any corrective structure, which includes a multiple.
Thanks Kevin. Appreciate all of the content you share with us here. Assuming your charts / view re: TLT above are correct, and I suspect they are, I can’t reconcile new all time highs with that backdrop and uncertainty in the rate environment. With that in mind, I still feel like the Combination is still a likely scenario and would probably cause a bit of pain. I have some some very short term 2-4 day calls to play a breakout, but I’m more biased toward some 1-2 month put spreads to play more downside volatility here. Keep in mind, VIX has been sold hard into this recent rally so vol is relatively cheap and a nice way to play a possible Combination.
Could the triangle still be in play? Or does the breach of the upper trend line mean the triangle structure is complete? I don’t know what the rules are for that. Could we just have completed wave D and are starting wave E down still?
“Intermediate wave (4) has breached an Elliott channel drawn using Elliott’s first technique.”
A view of bonds (TLT, 20 year tbill). Could be wrong about a minute 5 down completing already, hence the “dueling trend lines” to tell me.
Hi Lara,
Thanks for including the monthly analysis and charts. They are very helpful. The alternate monthly is very interesting.
Have a great weekend.
You’re welcome.
We have some little waves this morning and the sun is shining, and so all is good in my world
You definitely have your priorities straight Lara! Nothing more important in life than sunshine (and the ability to walk under it!), a board (any board!), an ocean and some manageable waves. BTW have you ever seen the movie “Innermost Limits of Pure Fun”? George Greenough (kneeboarder and my HERO!!) at the dawn of the short board revolution, a “home made” movie, and the first to shoot “point of view” from inside the barrell. Includes some of his amazing matt surfing as well. Zero dialogue. Just surfing and occasional hijinks. Final segment: “The Coming of the Dawn”, 15 minutes of just inside the barrell footage starting at absolute first light. Massively stokeful, check it out!
I’ve not seen it. Just looked on YouTube, and it’s not there. Sounds really awesome! I’ll ask Cesar if he’s seen it.
I’ve been making little videos of my surf sessions, playing with iMovie and adding music, and putting them up on a new YouTube channel.
I like re-watching them when there’s no surf, I get to re live my waves! And my family love them.
Pretty basic stuff though, not 15 minutes of in the barrel LOL