
Last analysis expected that a primary degree bearish wave had arrived. Today’s downwards movement overall fits that expectation, although targets were inadequate.
Summary: Look for downwards movement to end if price gets down to the 200 day moving average. A short term target for tomorrow is about 2,781, where a small bounce may begin.
A primary degree correction should last several weeks and should show up on the weekly and monthly charts. Primary wave 4 may total a Fibonacci 8, 13 or 21 weeks. The preferred target for it to end is now about 2,717.
The final target for this bull market to end remains at 3,616, which may be met in October 2019.
New updates to this analysis are in bold.
The biggest picture, Grand Super Cycle analysis, is here.
Last historic analysis with monthly charts is here, video is here.
ELLIOTT WAVE COUNT
WEEKLY CHART
Click chart to enlarge.
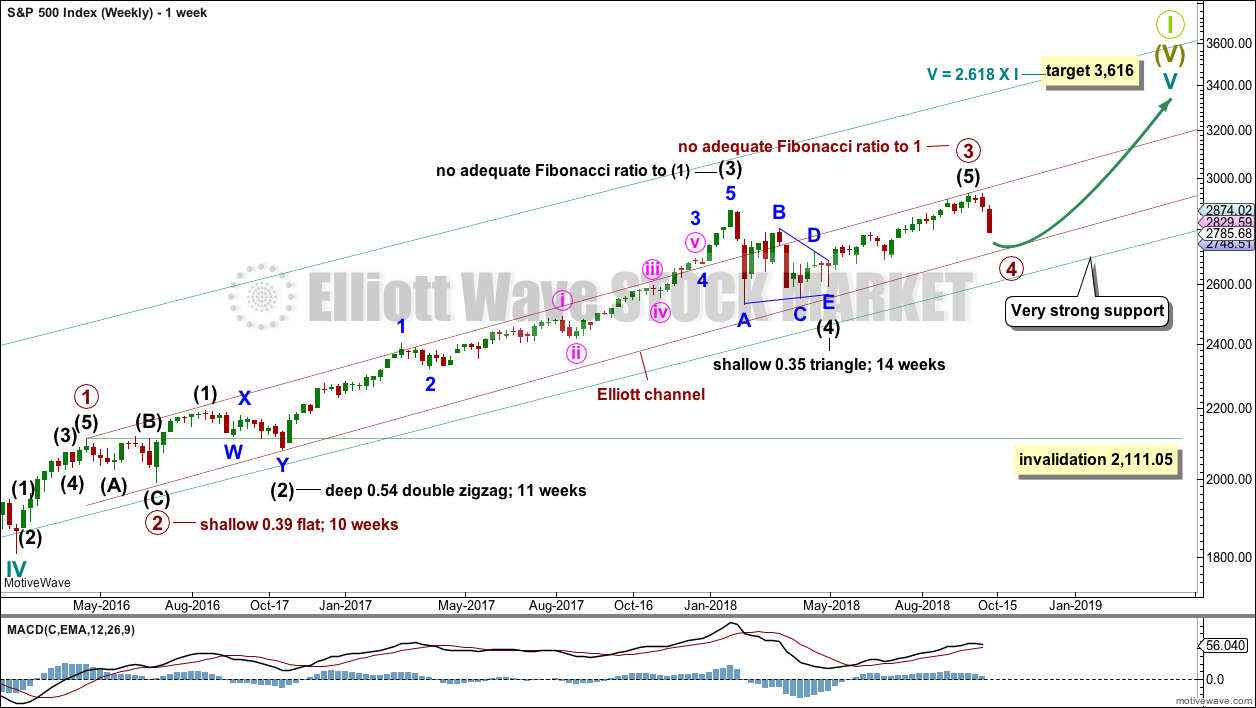
Cycle wave V must complete as a five structure, which should look clear at the weekly chart level and also now at the monthly chart level. It may only be an impulse or ending diagonal. At this stage, it is clear it is an impulse.
Within cycle wave V, the third waves at all degrees may only subdivide as impulses.
Primary wave 3 may now be complete. Within primary wave 3, there is perfect alternation and excellent proportion between intermediate waves (2) and (4).
The channel is now drawn about primary degree waves. The first trend line is drawn from the ends of primary waves 1 to 3, then a parallel copy is placed upon the low of primary wave 2. Primary wave 4 may find support about the lower edge of this maroon channel. The overshoot of the upper edge of this channel by the end of intermediate wave (3) looks typical. For the S&P, its third waves are usually the strongest portion of an impulse; they often exhibit enough strength to overshoot channels.
Fourth waves do not always end within channels drawn using this technique. If primary wave 4 breaks out of the narrow maroon channel, then it may find very strong support about the lower edge of the teal channel. This channel is copied over from the monthly chart and contains the entire bull market since its beginning in March 2009. While Super Cycle wave (V) is incomplete}, this channel should not be breached.
Primary wave 4 may not move into primary wave 1 price territory below 2,111.05. However, it is not expected to get anywhere near this invalidation point as it should remain above the lower edge of the teal channel.
When primary wave 4 may be complete, then the final target may be also calculated at primary degree. At that stage, the final target may widen to a small zone, or it may change.
At this stage, the expectation is for the final target to be met in October 2019. If price gets up to this target and either the structure is incomplete or price keeps rising through it, then a new higher target would be calculated.
DAILY CHART
Click chart to enlarge.
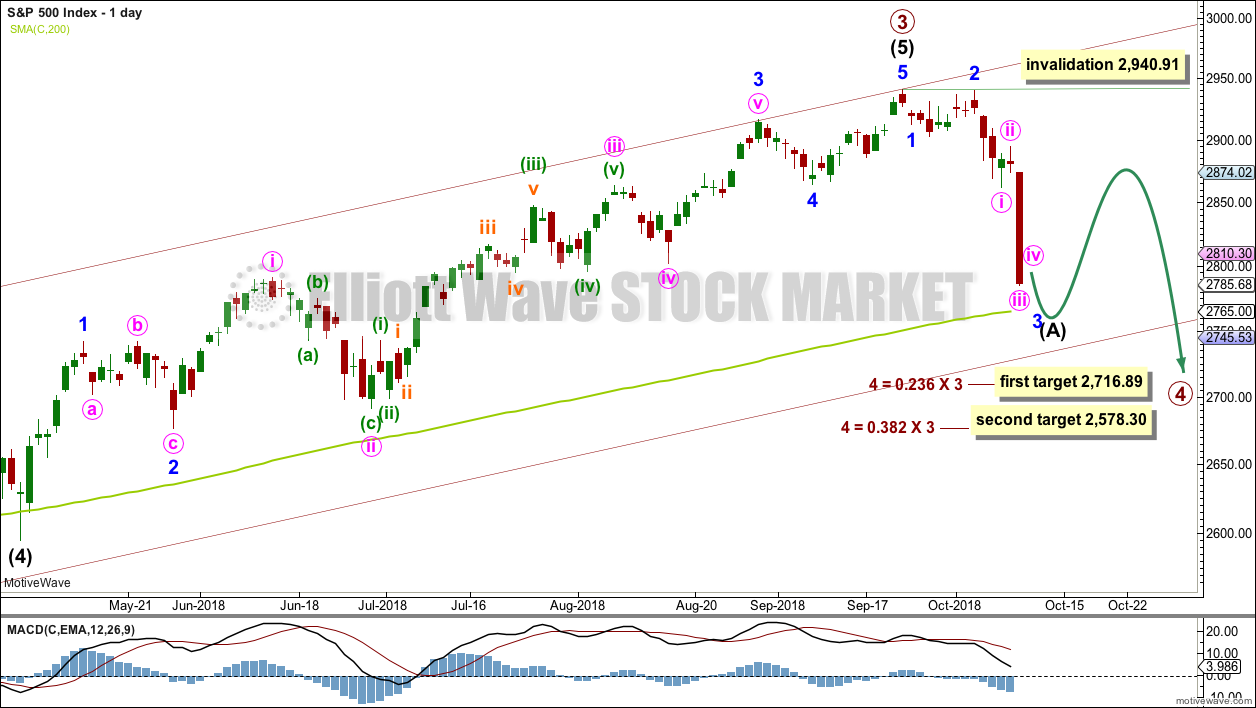
Primary wave 4 would most likely end somewhere within the price territory of the fourth wave of one lesser degree. Intermediate wave (4) has its price territory from 2,872.87 to 2,532.69. Within this range sit two Fibonacci ratios giving two targets. The upper 0.236 Fibonacci ratio may be more likely as that would see primary wave 4 only slightly overshoot the maroon channel.
Primary wave 2 unfolded as a shallow regular flat correction lasting 10 weeks. Primary wave 4 may exhibit alternation in structure and may most likely unfold as a zigzag, triangle or combination. Primary wave 4 may last a Fibonacci 8 weeks at the earliest, and more likely a Fibonacci 13 or 21 weeks in total. A zigzag would be the most likely structure as these are the most common corrective structures and would provide the best alternation with primary wave 2. A zigzag would see intermediate wave (A) unfold as a five wave structure.
Primary wave 4 may not move into primary wave 1 price territory below 2,111.05. However, the lows in primary wave 4 should not get close to this point. The lower edge of the teal channel on the weekly chart should provide very strong support.
HOURLY CHART
Click chart to enlarge.
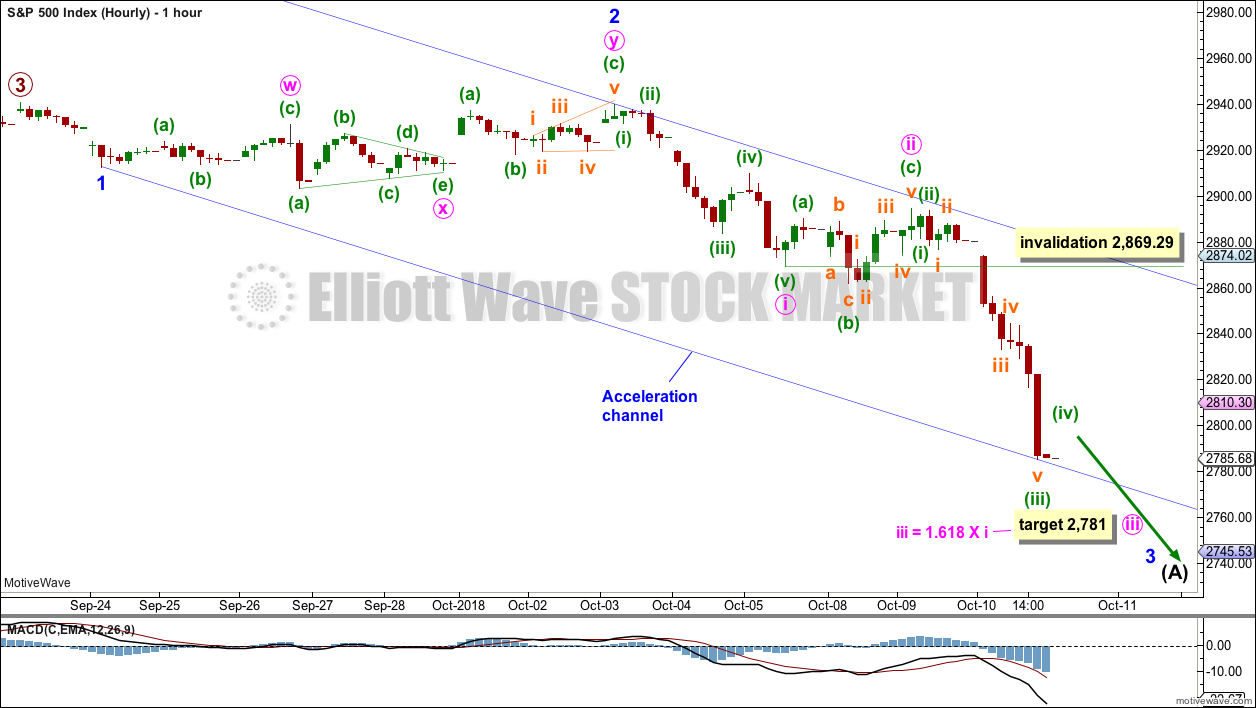
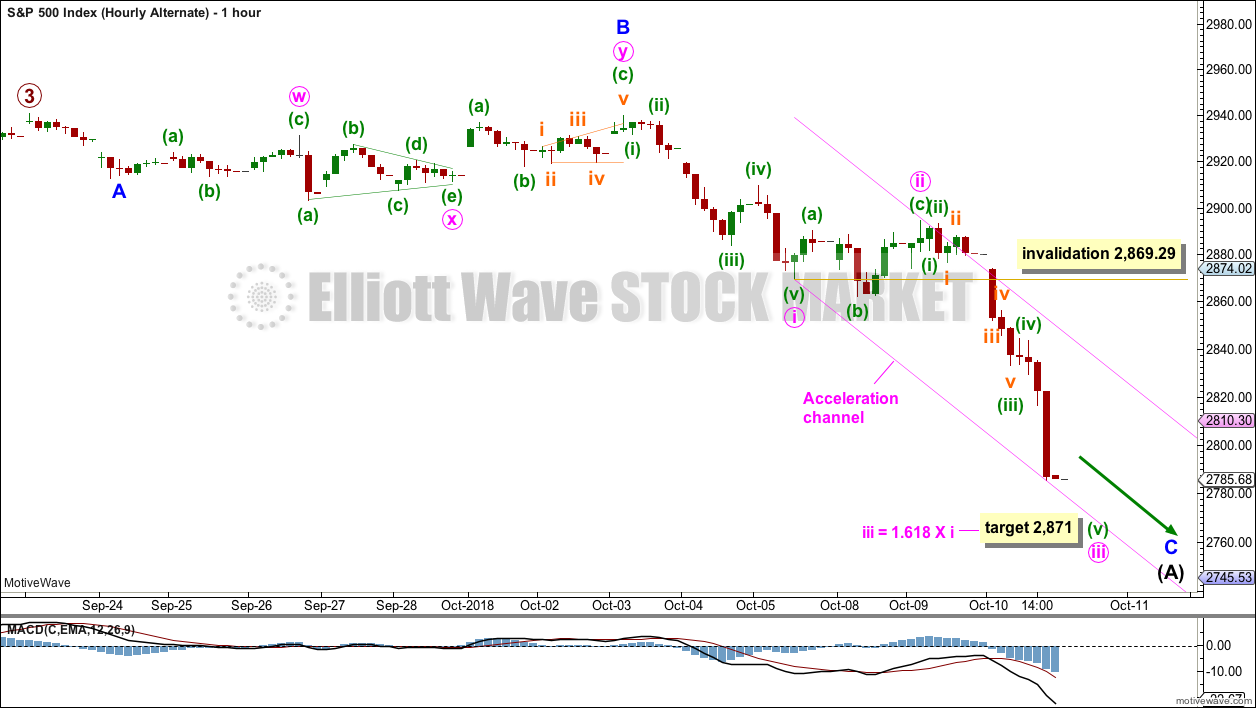
Minor wave 3 may be incomplete. Strong downwards movement for this last session looks more like the middle of a third wave than a fifth wave for this market.
Within minor wave 3, minute wave iii may reach the target tomorrow. Thereafter, a small shallow bounce for minute wave iv may not move back up into minute wave i price territory above 2,869.29.
Draw an acceleration channel about this downwards movement. Draw the first trend line from the end of minor wave 1 to the last low, then place a parallel copy on the high of minor wave 2. Keep redrawing the channel as price keeps moving lower. When minor wave 4 arrives, it may find resistance about the upper edge of the channel.
ALTERNATE DAILY CHART
Click chart to enlarge.
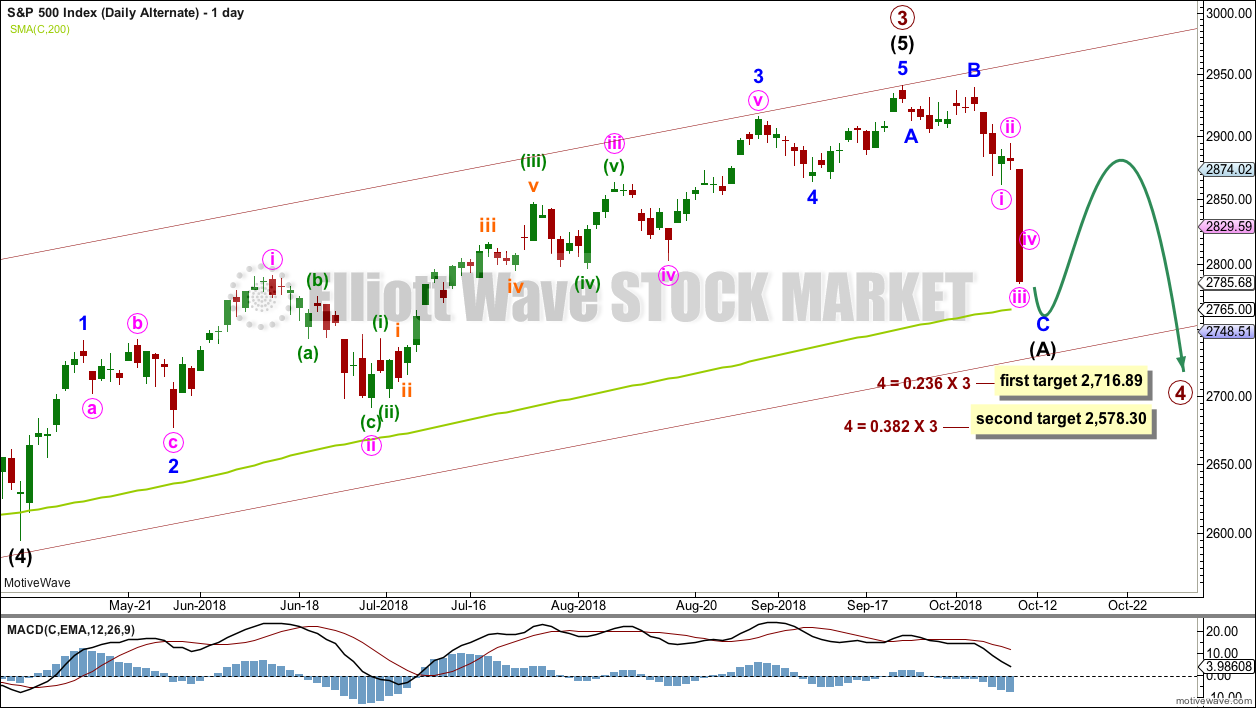
It is also possible that primary wave 4 may sub-divide as a triangle or flat correction, although a flat would not offer structural alternation with primary wave 2.
If primary wave 4 unfolds as a triangle or a flat, then within it intermediate wave (A) must sub-divide as a three wave structure, most likely a zigzag.
Within the zigzag, minor waves A and B may be complete and minor wave C may be unfolding as an impulse.
When a zigzag may be complete, then intermediate wave (B) may make a new price extreme above the start of intermediate wave (A) as in an expanded flat or a running triangle. There is no upper invalidation point for this wave count at the daily chart level for this reason.
ALTERNATE HOURLY CHART
Click chart to enlarge.
The short term target is the same. Within minor wave C, minute wave iii may reach 1.618 the length of minute wave i.
Minute wave iv may not move into minute wave i price territory above 2,869.29.
TECHNICAL ANALYSIS
WEEKLY CHART
Click chart to enlarge. Chart courtesy of StockCharts.com.
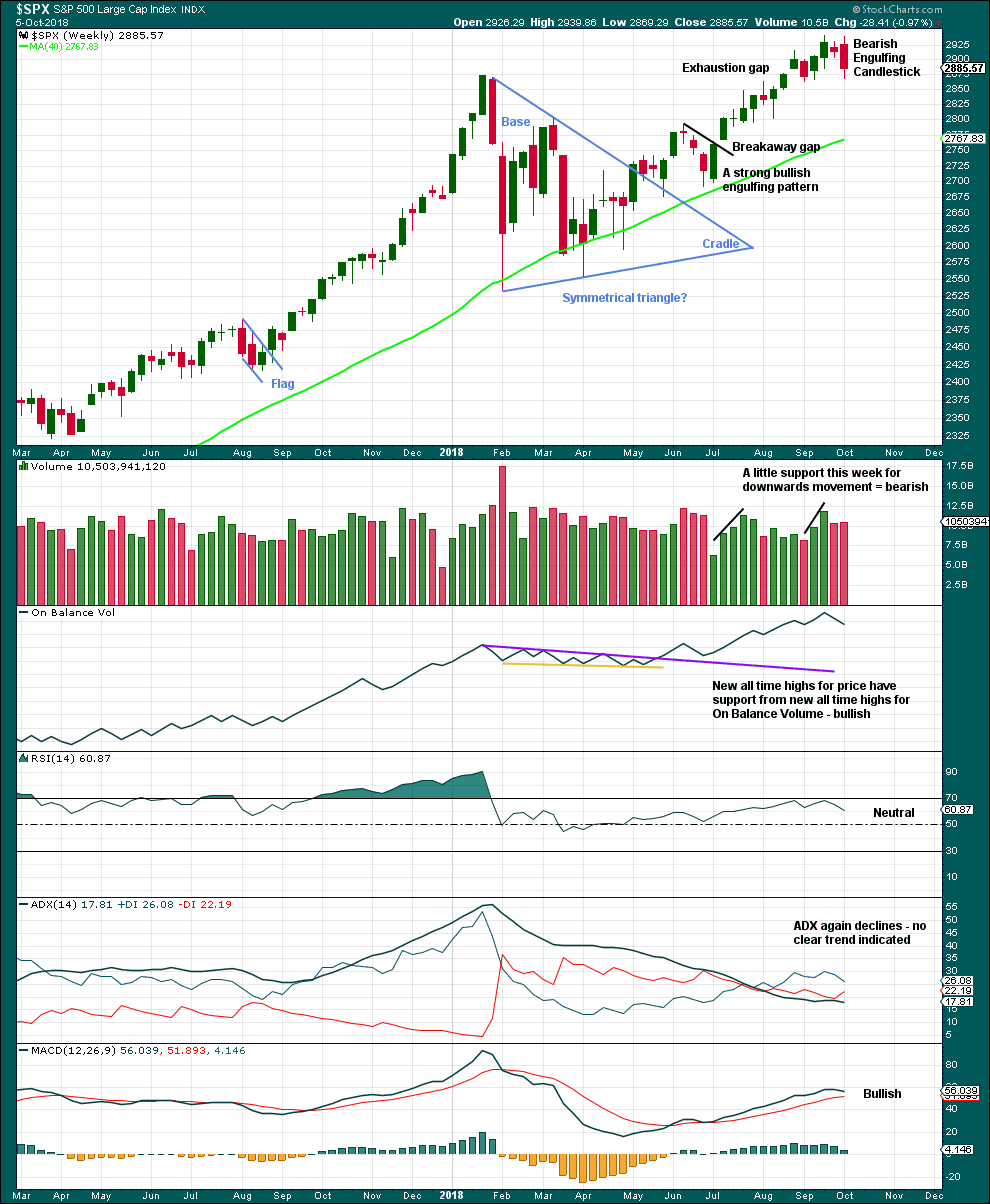
The symmetrical triangle base distance is 340.18. Added to the breakout point of 2,704.54 this gives a target at 3,044.72. This target has not yet been met.
Last week completes a Bearish Engulfing candlestick pattern (the strongest candlestick reversal pattern), which also has support from a slight increase in volume. This favours the main Elliott wave count.
DAILY CHART
Click chart to enlarge. Chart courtesy of StockCharts.com.
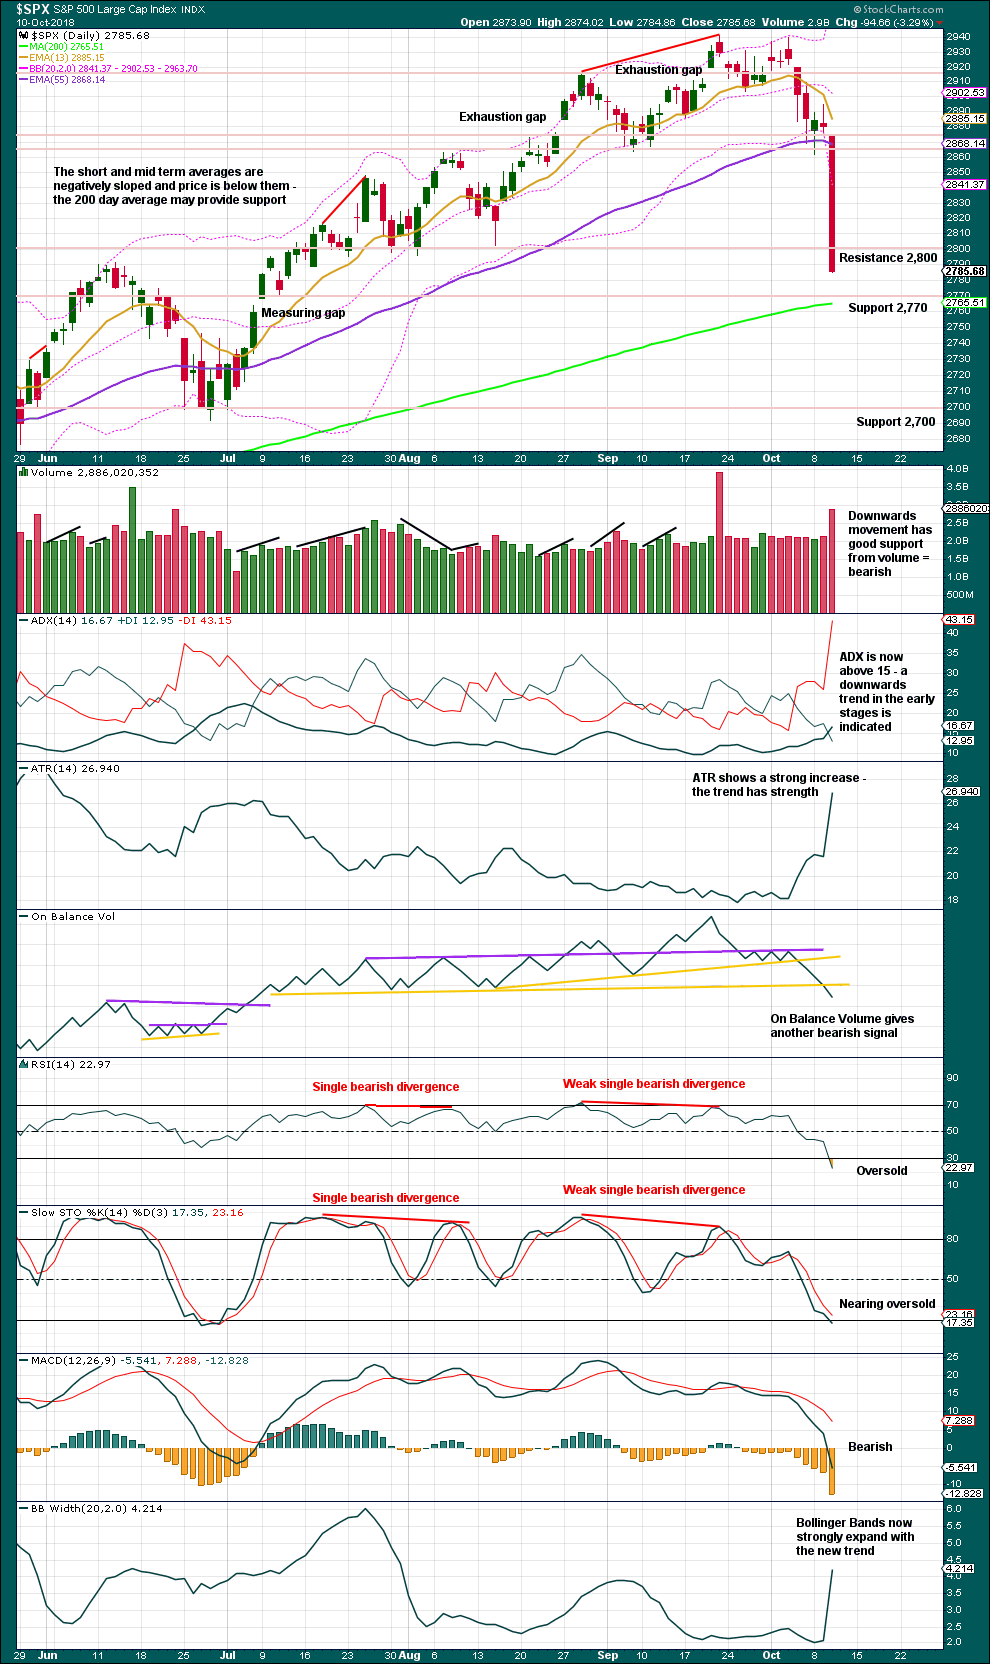
Clearly there is now a downwards trend in place. Next support is about 2,770. RSI is oversold; downwards movement for the short term may now be fairly limited. Look out for a bounce to arrive in the next very few days.
VOLATILITY – INVERTED VIX CHART
WEEKLY CHART
Click chart to enlarge. Chart courtesy of StockCharts.com. So that colour blind members are included, bearish signals
will be noted with blue and bullish signals with yellow.
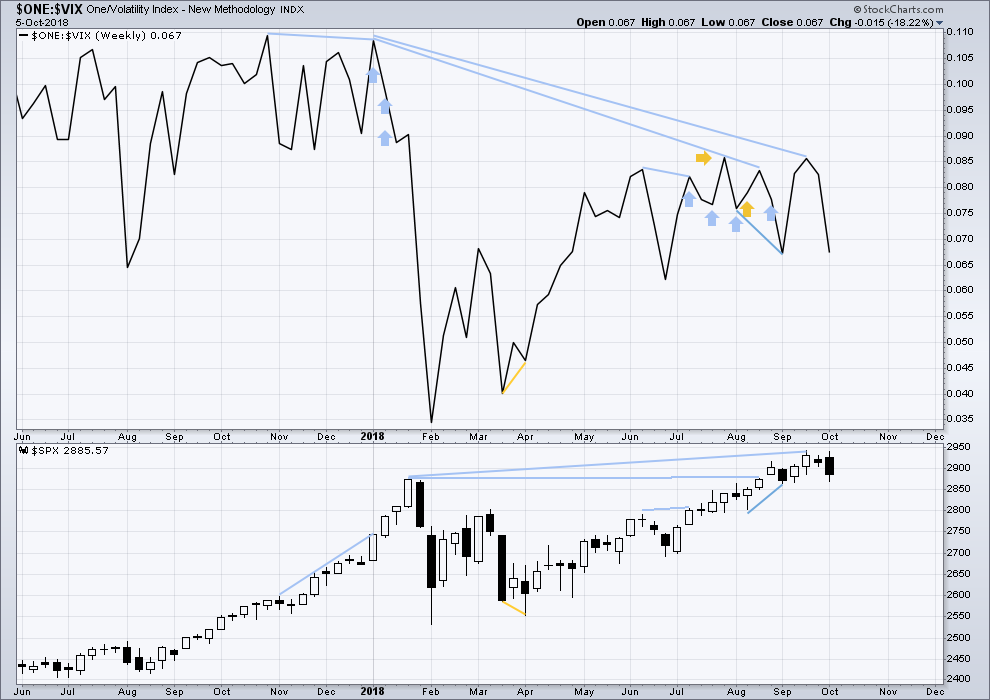
To keep an eye on the all time high for inverted VIX a weekly chart is required at this time.
Notice how inverted VIX has very strong bearish signals four weeks in a row just before the start of the last large fall in price. At the weekly chart level, this indicator may be useful again in warning of the end of primary wave 3.
At this time, there is mid term bearish divergence between price and inverted VIX: price has made another new all time high, but inverted VIX has not. This divergence may persist for some time. It may remain at the end of primary wave 3, and may develop further to the end of primary wave 5.
Both inverted VIX and price have moved lower and neither have made new swing lows. There is no divergence.
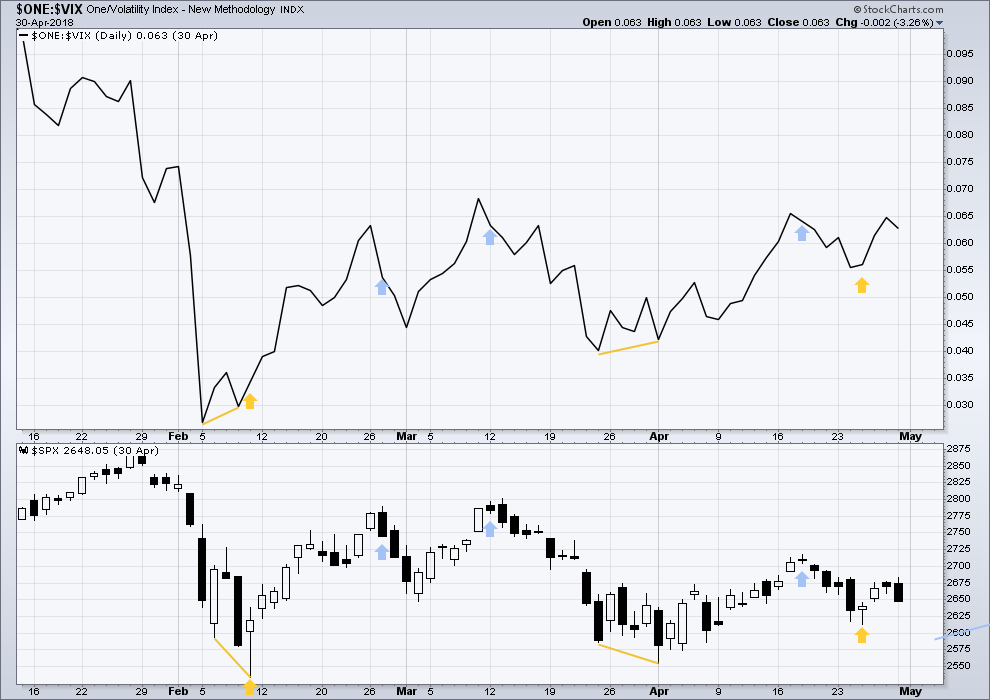
DAILY CHART
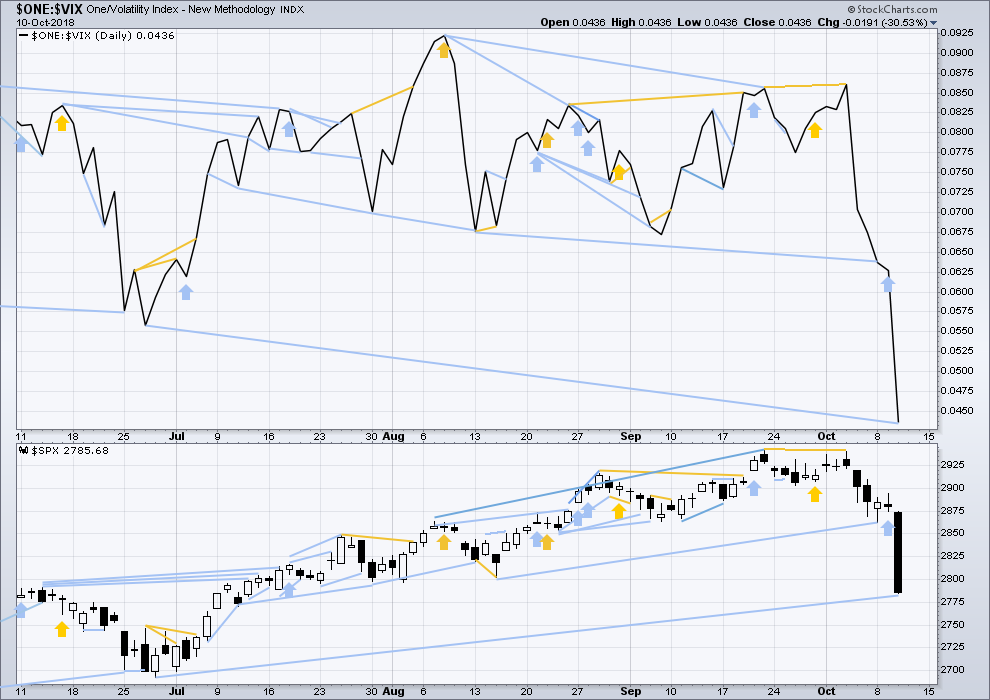
Click chart to enlarge. Chart courtesy of StockCharts.com. So that colour blind members are included, bearish signals
will be noted with blue and bullish signals with yellow.
Normally, volatility should decline as price moves higher and increase as price moves lower. This means that normally inverted VIX should move in the same direction as price.
There is mid term divergence with a new all time high from price not supported by a corresponding new all time high from inverted VIX. This divergence is bearish.
Mid term bearish divergence between price and inverted VIX can be seen on both daily and weekly charts now. There is now enough mid term bearish divergence to offer reasonable support to the main Elliott wave count.
There is now long term bearish divergence between the low for inverted VIX today and the prior swing low of the 27th/28th June. Inverted VIX has made new lows, but price has not.
BREADTH – AD LINE
WEEKLY CHART
Click chart to enlarge. Chart courtesy of StockCharts.com.
When primary wave 3 comes to an end, it may be valuable to watch the AD line at the weekly time frame as well as the daily.
There is now triple bearish divergence between price and the AD line. The AD line this week has made a new strong swing low, but price has not. This offers reasonable support now to the main Elliott wave count.
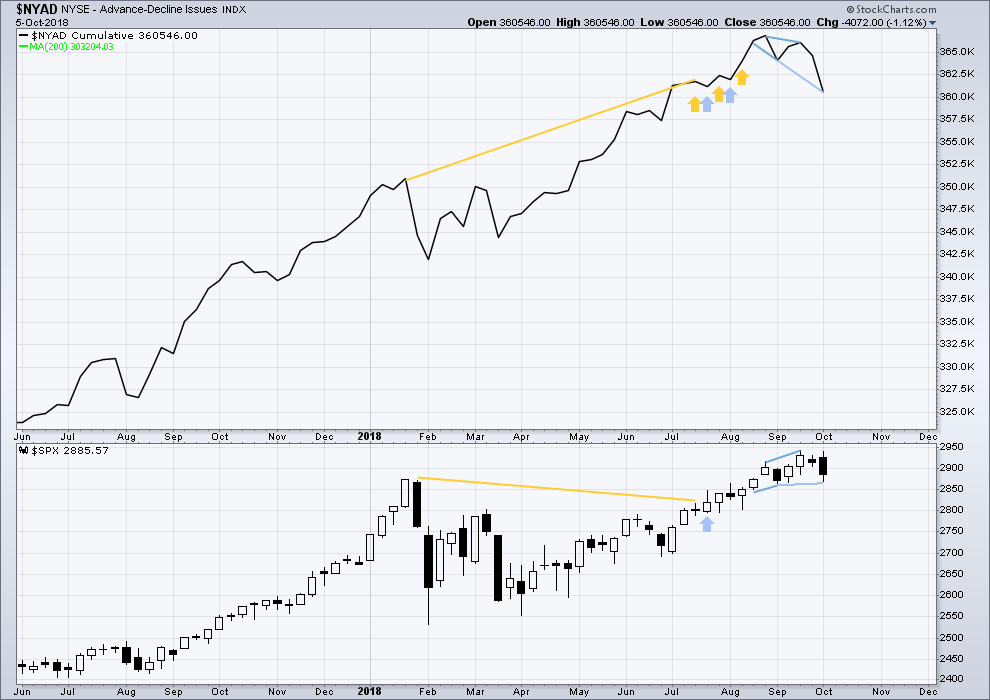
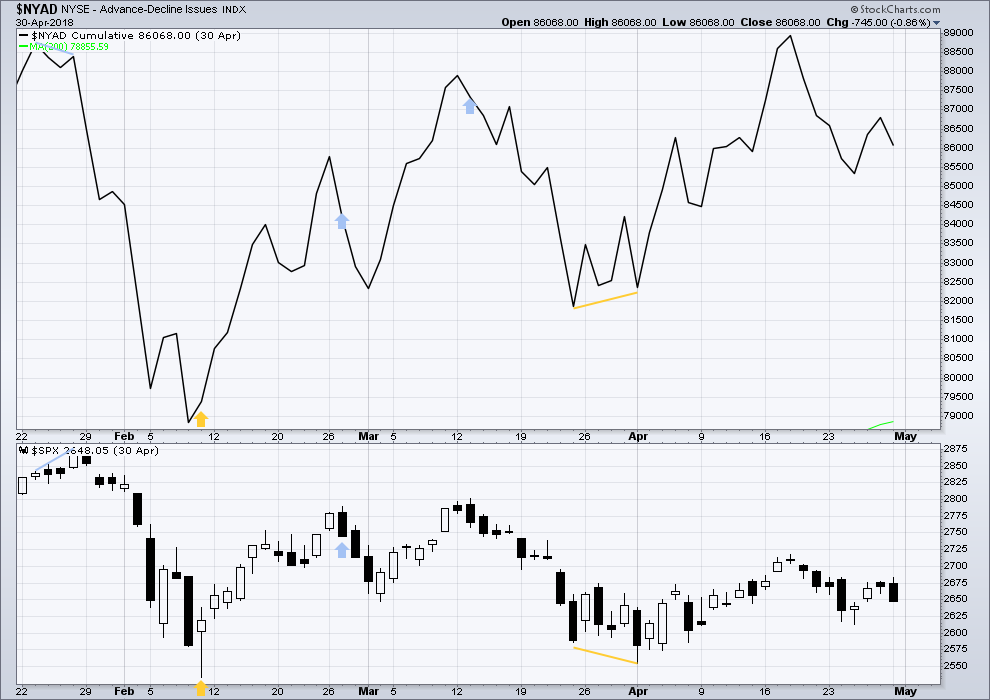
DAILY CHART
Click chart to enlarge. Chart courtesy of StockCharts.com.
There is normally 4-6 months divergence between price and market breadth prior to a full fledged bear market. This has been so for all major bear markets within the last 90 odd years. With no longer term divergence yet at this point, any decline in price should be expected to be a pullback within an ongoing bull market and not necessarily the start of a bear market. New all time highs from the AD line on the 29th of August means that the beginning of any bear market may be at the end of December 2018, but it may of course be a lot longer than that. My next expectation for the end of this bull market may now be October 2019.
Breadth should be read as a leading indicator.
There is now a cluster of bearish signals at the daily chart from the AD line; this offers now some reasonable support to the main Elliott wave count.
Downwards movement has support from falling market breadth. There is no short term nor mid term divergence between today’s low in price or the AD line.
All of large, mid and small caps are moving strongly lower. This fall in price has support from falling breadth.
DOW THEORY
The following lows need to be exceeded for Dow Theory to confirm the end of the bull market and a change to a bear market:
DJIA: 23,360.29.
DJT: 9,806.79.
S&P500: 2,532.69.
Nasdaq: 6,630.67.
All of DJIA, DJT, S&P500 and Nasdaq have made recent new all time highs. This provides Dow Theory confirmation that the bull market continues.
Charts showing each prior major swing low used for Dow Theory may be seen at the end of this analysis here.
ANALYSIS OF INTERMEDIATE WAVE (3)
TECHNICAL ANALYSIS
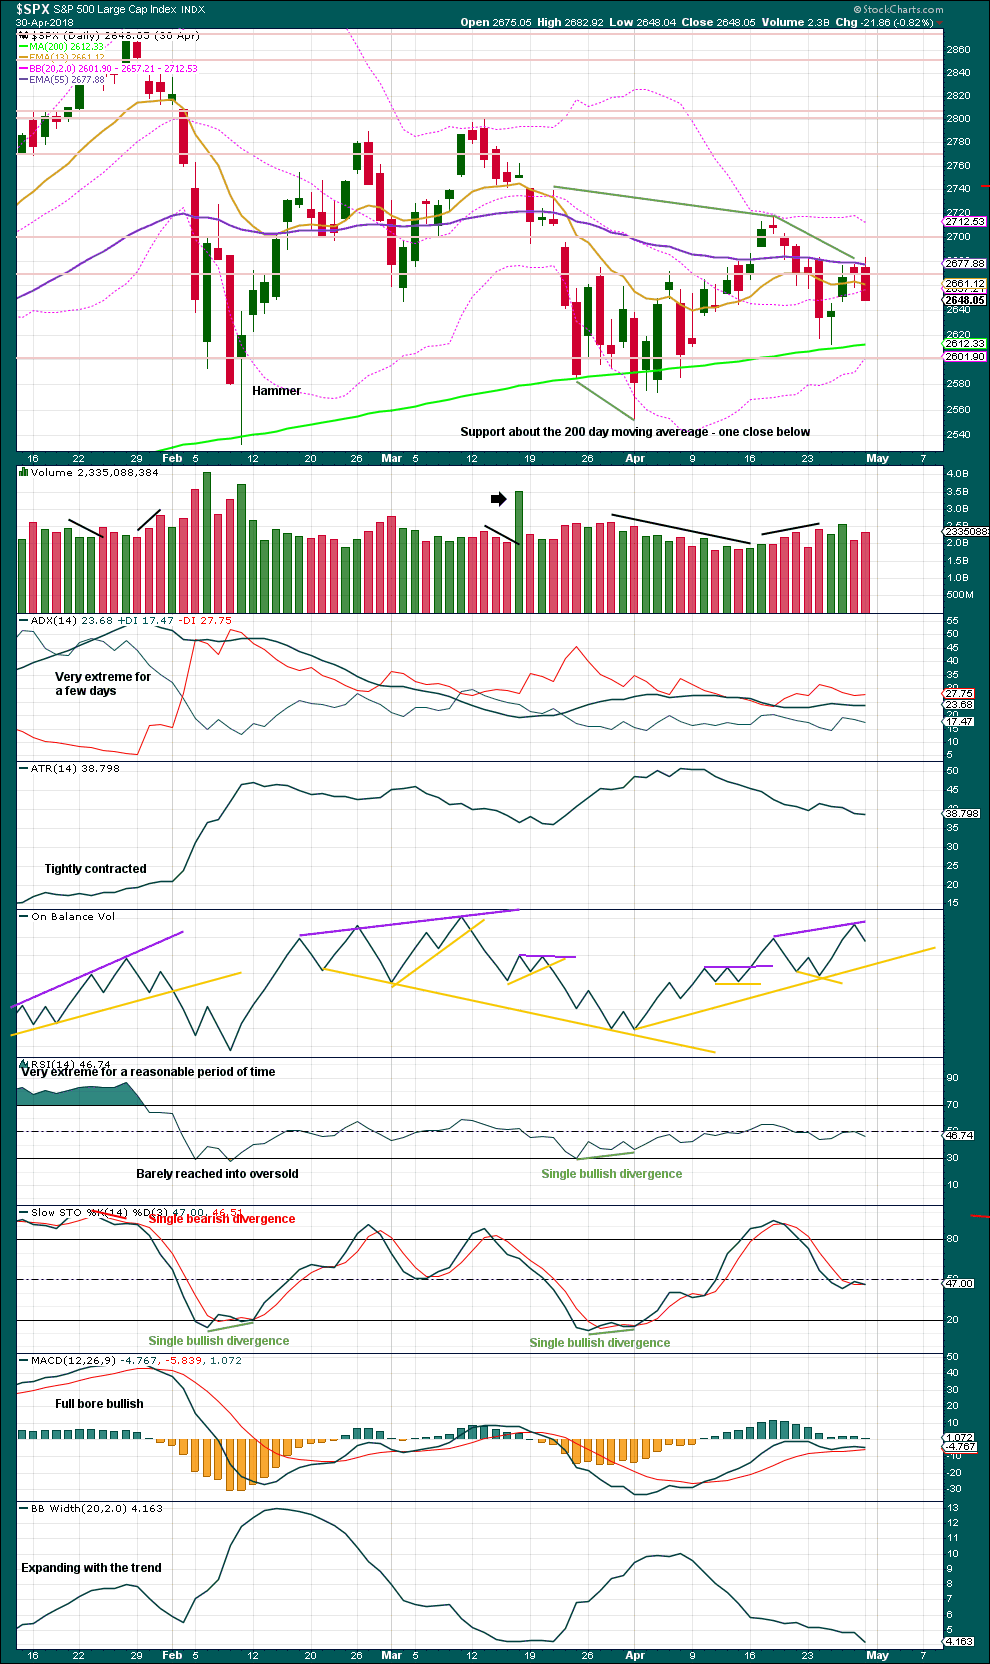
Click chart to enlarge. Chart courtesy of StockCharts.com.
Intermediate wave (4) was a large symmetrical triangle. The deepest wave was the first wave. At its low there was a clear candlestick reversal pattern and bullish divergence between price and Stochastics.
RSI barely managed to reach into oversold.
The current correction for primary wave 4 may behave differently, but there should be some similarities.
VIX
Click chart to enlarge. Chart courtesy of StockCharts.com.
This is a daily chart.
At the two major lows within intermediate wave (4), inverted VIX exhibited single short term bullish divergence.
At highs within intermediate wave (4), inverted VIX exhibited one single day bullish divergence with price.
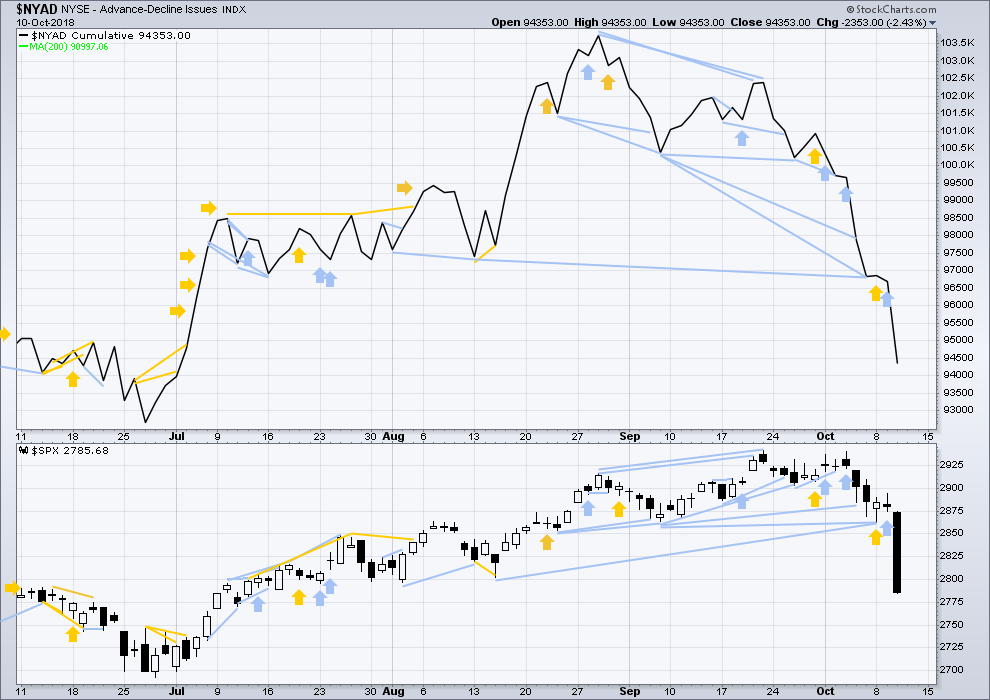
AD LINE
Click chart to enlarge. Chart courtesy of StockCharts.com.
This is a daily chart.
At the two major lows within intermediate wave (4), there was bullish divergence between price and the AD line. At the two major highs within intermediate wave (4), there was each one instance of single day bearish divergence.
Published @ 06:36 p.m. EST.
—
Careful risk management protects your trading account(s).
Follow my two Golden Rules:
1. Always trade with stops.
2. Risk only 1-5% of equity on any one trade.
I say let it wash out for another week… that would be very healthy overall.
The break of 3.26% on the 30 Year Treasury turned out to be a strong signal for the equity market sell off. Just like the old days!
There was NOT a major acceleration up in that yield… so if it doesn’t happen in the next few days, it will be a signal of a major bounce or the start of new wave up for equities.
If it breaks back below 3.26% and accelerates down, then BUY BUY BUY the market for new highs.
If we are back to the good old days of market interactions… that is exactly what will occur!
All things being equal, we should be looking for a bounce.
However, make no mistake. Critical trend-lines going back to 2009 lows decisively broken. As master trader Jeff Clark used to say, nothing is more bearish than a market that cannot get up off the mat, and Mr. Market is supine.
VIX will tell the near term tale!
Have a great evening everyone!
well, beers on me……
Where do I meet you?
Make mine GUINNESS!!!
As we we say in de islands…
It’s GOOD, and GOOD for you! 🙂
BVIs baby
Updated main hourly chart:
If intermediate wave (A) subdivides as a five, then minor 3 could be over at the last low.
It could of course continue lower. But there’s no Fibonacci ratio I can use now for a target, so using zones of support below would be the best.
The 200 day MA should provide support.
Notice that price did close below the 200 day MA once during intermediate wave (4) on the 2nd of April, and then immediately turned back up above it. A close below this line does not mean price must continue falling.
Alternate hourly updated:
If intermediate (A) subdivides as a zigzag then it could be over at today’s low.
this?
Yep. Entirely possible.
my best trading day ever…. so thank you Lara, Kevin, Rod, Verne…
fun site to hang out on
Awesome! It is easier when there’s a good strong trend to make $
that was V=I
I’ve got a 100% at 2736. If that one goes…next stop down is some overlapped fibos at 2694. And as the volume profile shows, 2677 area is a “strange attractor” for SPX due to very high volume around that price area.
gone
It is not unusual for a return to the apex / crux of a triangle sometime after the breakout. If we return to the apex / crux of the Intermediate 4 triangle (Feb – May), then we are headed for 2650 – 2600. Wowza!
I am thinking we are still in a 3rd wave.
Here we go again!
Hi Everyone
If we close below the 200 day moving average I would think that’s going to add a little bit more selling pressure here?
All comments welcome
Thank You
Thoughts guys. Is the 200MA at 2765. Then hence if it closes below that then next week will not be pretty.
So is a long worth it at sub 2740 in the view theists pump in the last hour
inside 15 min candle SPX
If you play for short time frames there are a lot of interesting buy opportunities out there. Of course, the move up may only last a few days, possibly even less I suppose. At any rate…JPM is bouncing off a major 61.8%, and I’ve sold puts just underneath, under the theory that option prices are sky high right now and I want to be a seller not a buyer. Very similar story in BABA.
2646 turn. Like clockwork. Right off the 78.6%. The three most critical levels are 61.8%, 78.6%, and 1.27% extensions. They “function” far more often than any other level. In my experience and opinion.
chart?
sure
oops I meant 2746 obviously….
man, i would have never measured that way, thanks for opening my eyes
Glad to help. I don’t know any other way re: fibo work.
Time to pay attention to retrace (back up) levels. I see two key swings, and shock and awe…most of the fibo levels overlap! Ain’t market fractal geometry awesome?
From a volume profile perspective, the natural target for SPX to arrive and “rest” is all the way down at 2677. (The chart is SPY, in order to get volume data.)
BTW the sell off in SPX so far has it down from it’s peak at -6.6%. Vs. the intermediate 4 which maxed out at -11%. Suffice to say “this is no where near done”. The total primary 4 size should be at least comparable to the intermediate 4; I’d say -8% total MINIMUM, with more than -11% likely, and -15% wouldn’t be surprising. So if you missed this last short opportunity…another one will present itself reasonably soon. In my opinion.
SPX now hitting support at 2746 area. May or may not turn here. But if there are turn indications, this one might be real for the start of a B up (the one early this morning was in no-man’s land, pretty likely to fail).
Anyone take CVX short right at the top of the D wave? I need to learn how to be more bold, “coulda/shoulda/woulda”. I do have a bear spread on it now, obviously looking for CVX at 115 to complete the E wave. But sometimes E waves are shorties, so gotta be careful.
GLD pushing up out of it’s 2 month range where I had my butterfly (Oct 19 expiry). Drat!! Discipline requires I exit after 2 months with a very small loss, though part of me “knows” that GLD ain’t going anywhere and will probably be back in that range by Monday. Oh well, any landing…
Maybe. I think that it has broken to the upside thought that Lara was talking about. Nervous shorts may decide to cover. We might have to wait for the bounce in the market (.spx) to get over before we see fireworks in gold.
It appears to be a flight to “safety” and a parking spot for $$$. With a B wave of some days duration in SPX, gold might settle back down quickly. Or maybe not, and there’s a bull market in gold at least through this P4 period.
RUT daily. Still waiting for signs of a real turn. The current price area looks solid for it. Interest rates backing off slightly (TLT up 0.5% today so far), which will help.
When RUT starts moving up, the B wave in SPX is almost certainly “in play”. (I’m assuming SPX is doing some kind of ABC and has or is completing an A now) I suspect.
For those who like their falling knives fast and sharp…there’s GS, which reports next Tuesday, approaching a 1.27% at 211.6, where I have pretty good confidence there will be a significant bounce. Though earnings on Tuesday is a wild card.
What happened to social mood
Social mood is as fickle as the wind. Back in Feb-April SPX was crazy whipping, down 2% one day, up 2% a few days later! I suspect we’ll see similar action before this P4 is over.
Anyone got the fibs for the 4 up? (Away from computer) Looks like 2816 up next ?
Re-selling closed positions at 2779….Lets go back down please
Open old gap 2864-2868. Close it and bounce up?
I won’t be surprised if we see over 2820
OK, the gap WAS 2764-2768 (july 6), and its closed now…. will this provide resistance now?
nope
Futures to 2747 and then back to 2787 , another wild one today?
And possibly higher
Hi Verne,
do you have any link to your Chris Cole reference?
Hi Nick. Sorry I missed your question. I think Chris’ fund is closed to new investors but you can search for his recent articles on ZeroHedge.
Chris Cole is once again right on the money, and I have learned to not only pay attention to WHAT he says, but also WHEN he says it. I trade big lots, and increasingly both sell and buy side executions are seeing my order split into batches. It is really un-nerving to see option trades getting filled in some cases one at a time!! Very ominous.
This used to rarely happen, and could be foreshadowing Chris’ predicted coming liquidity crisis. Remember the joke about the young fish swimming in water yet having no idea what, or how essesntial to their survival it was?
Hats off to Chris and the Artemis Capital crew!
Selling half my shorts and happy to wait and see what the next move is.
As much as I see more downside on the table and potential profit nobody goes bust taking profits
Happy trading all!!
Kevin, do you have any fibo clusters, trend lines, or any gaps you’re seeing that might hint at a bounce (start of intermediate B)?
If markets open tomorrow as futures are acting now, we’ll have a higher VIX with a 5th day above its BB
Looks to me like massive support at 2746 area. Overlapped fibo’s, symmetric projection, and lots of pivot highs over the last year right in that area.
Critical to keep in mind that this move is almost certainly only an “a” move down of some type of structure as described by Lara. So 2746 area might stop the A train…but not the C train! (We are all chasing the Col-trane!)
Futures down 30, how you guys playing this ?
Most of the easy money has been made on this leg down for the short term imo. Thankfully I got my November VIX calls last week when we were hovering near ATHS!
I’ll be selling half at the open and looking for a decent re-entry. The chart is looking outlandishly oversold in the near term.
Ari:
I meant to get back to you on your question about some of the triggers we use for directional trades but as you can imagine, I have been busy the last few days.
I have made reference to these on the forum in the past and even recently I believe.
The first thing we monitor closely is price action around contested pivots. We had been monitoring money flow around these pivots for some time and were quite confident that because of the incredible inflows comitted to defending them, once they gave way, the price action would be significant. SPX 2900 was the most recent battleground and once it broke, we backed up the 18 wheelers.
Another price pattern we closely pay attention to is what we affectionately call the COIL.
I am not sure if I mentioned it before but the recent one was one of the biggest we have seen in some time, and it was entered in a down-trend.
We traded based on both as the combination triggers were YUGE!
Hope that helps a bit bud! 🙂
Hi Verne. Thanks for answering my question 🙂
I do miss your postings here the last few days. It does sometimes help my trading and understanding. Post more often my man 🙂
I understand the logic of the pivots and I remember your posts on that before. You said the first wave down on a Primary wave should shatter previous pivots on the first wave down… which has happened 🙂
My understanding of “coiling” is what price does inside tight Bollinger Bands for a while before it let’s loose either up or down. Is this what you mean by coiling? And also did you mean coiling of volatility, stock index prices, or both?
Good to hear from yah Verne! Please post more often like Kevin does. Learning a lot from y’all.
Most welcome Ari.
The “COIL” is essentially a sideways wedge, featuring price action in a narrowing range, AND, this is key, RISING volatility. Having even just a few patterns that you know well and instantly recognize can be a real game changer for a trader. You can trade less often, but more confidently with bigger lots.
Thanks for the analysis on this somewhat historic day.
BTW – FIRST!