
A new swing low at the daily chart level indicates the Elliott wave counts should now be swapped over.
Summary: Because of a new swing low, it now looks like there may have been a trend change. Primary wave 4 may now be in its very early stages.
A primary degree correction should last several weeks and should show up on the weekly and monthly charts. Primary wave 4 may total a Fibonacci 8, 13 or 21 weeks. The preferred target for it to end is now about 2,717.
The final target for this bull market to end remains at 3,616, which may be met in October 2019.
New updates to this analysis are in bold.
The biggest picture, Grand Super Cycle analysis, is here.
Last historic analysis with monthly charts is here, video is here.
MAIN ELLIOTT WAVE COUNT
WEEKLY CHART
Click chart to enlarge.
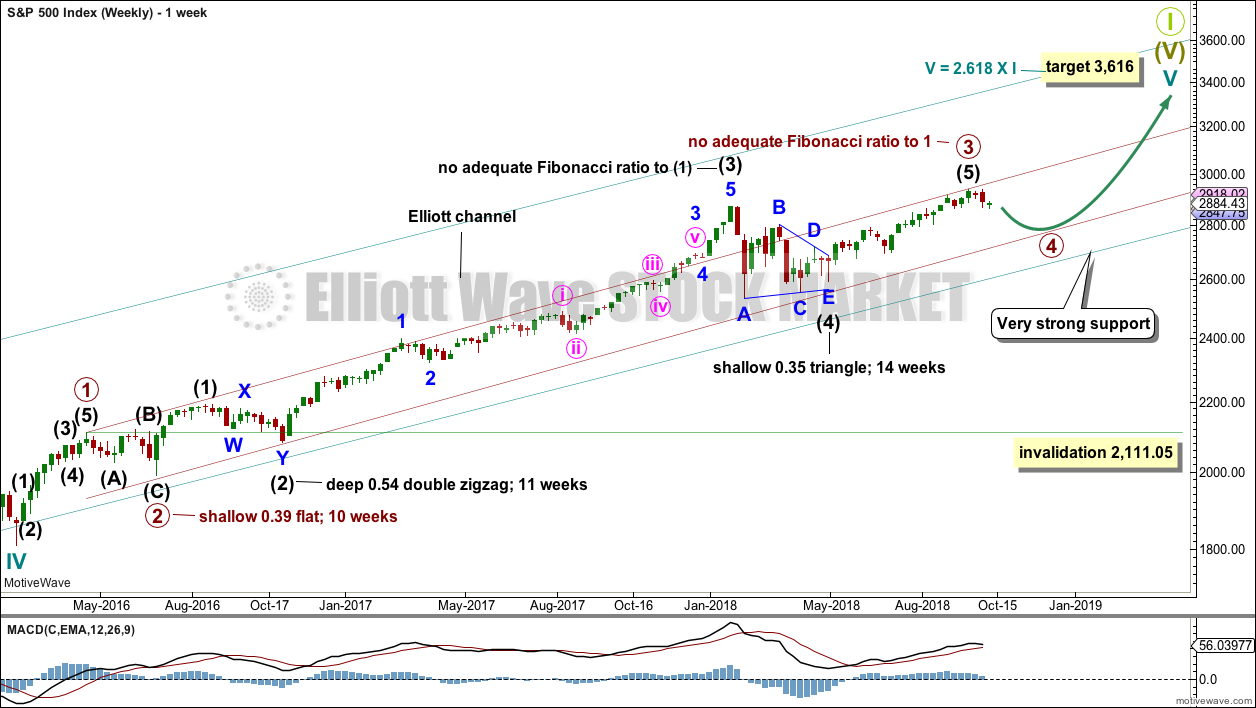
Cycle wave V must complete as a five structure, which should look clear at the weekly chart level and also now at the monthly chart level. It may only be an impulse or ending diagonal. At this stage, it is clear it is an impulse.
Within cycle wave V, the third waves at all degrees may only subdivide as impulses.
Primary wave 3 may now be complete. Within primary wave 3, there is perfect alternation and excellent proportion between intermediate waves (2) and (4).
The channel is now drawn about primary degree waves. The first trend line is drawn from the ends of primary waves 1 to 3, then a parallel copy is placed upon the low of primary wave 2. Primary wave 4 may find support about the lower edge of this maroon channel.
Fourth waves do not always end within channels drawn using this technique. If primary wave 4 breaks out of the narrow maroon channel, then it may find very strong support about the lower edge of the teal channel. This channel is copied over from the monthly chart and contains the entire bull market since its beginning in March 2009. While Super Cycle wave (V) is incomplete, this channel should not be breached.
Primary wave 4 may not move into primary wave 1 price territory below 2,111.05. However, it is not expected to get anywhere near this invalidation point as it should remain above the lower edge of the teal channel.
When primary wave 4 may be complete, then the final target may be also calculated at primary degree. At that stage, the final target may widen to a small zone, or it may change.
At this stage, the expectation is for the final target to be met in October 2019. If price gets up to this target and either the structure is incomplete or price keeps rising through it, then a new higher target would be calculated.
DAILY CHART
Click chart to enlarge.
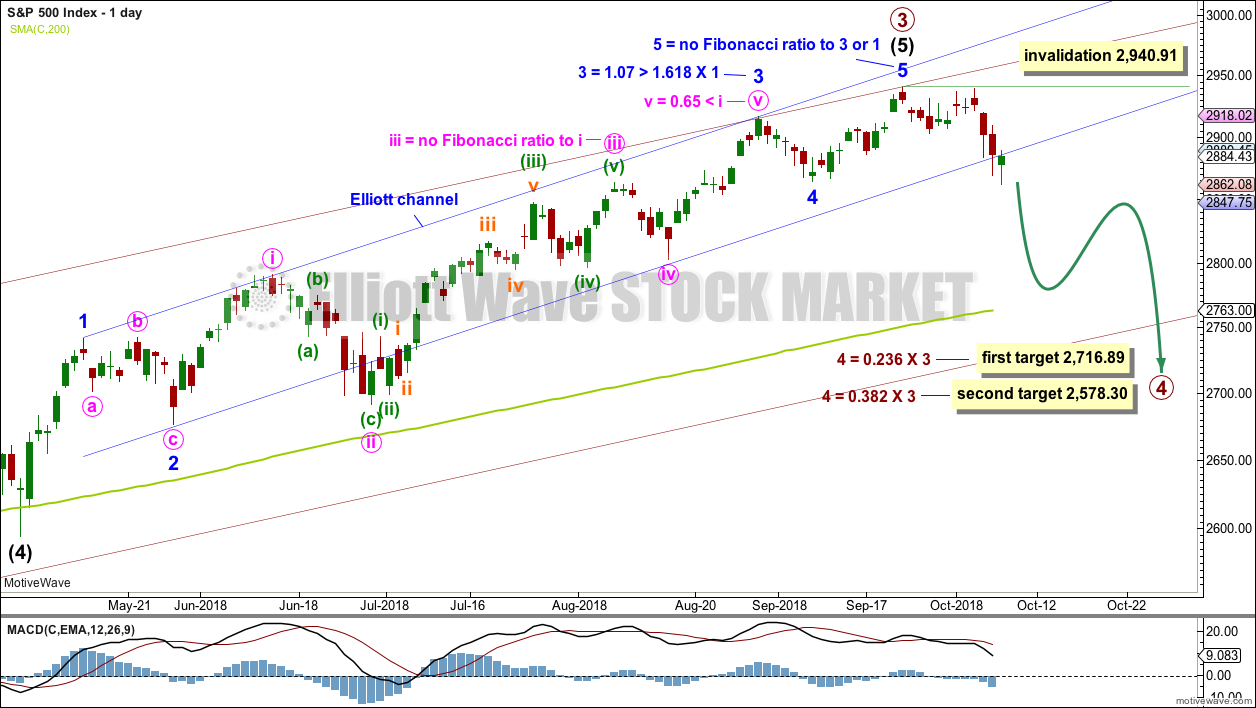
It is reasonably common for the S&P to exhibit a Fibonacci ratio between two actionary waves within an impulse, and uncommon for it to exhibit Fibonacci ratios between all three actionary waves within an impulse. The lack of a Fibonacci ratio for minor wave 5 within this wave count is not of any concern; this looks typical.
There are two excellent Fibonacci ratios within this wave count. The Fibonacci ratios for this wave count are better than for the alternate wave count.
Primary wave 4 would most likely end somewhere within the price territory of the fourth wave of one lesser degree. Intermediate wave (4) has its price territory from 2,872.87 to 2,532.69. Within this range sit two Fibonacci ratios giving two targets. The upper 0.236 Fibonacci ratio may be more likely as that would see primary wave 4 only slightly overshoot the maroon channel.
Primary wave 2 unfolded as a shallow regular flat correction lasting 10 weeks. Primary wave 4 may exhibit alternation in structure and may most likely unfold as a zigzag, triangle or combination. Primary wave 4 may last a Fibonacci 8 weeks at the earliest, and more likely a Fibonacci 13 or 21 weeks in total. A zigzag would be the most likely structure as these are the most common corrective structures and would provide the best alternation with primary wave 2.
Primary wave 4 may not move into primary wave 1 price territory below 2,111.05. However, the lows in primary wave 4 should not get close to this point. The lower edge of the teal channel on the weekly chart should provide very strong support.
HOURLY CHART
Click chart to enlarge.
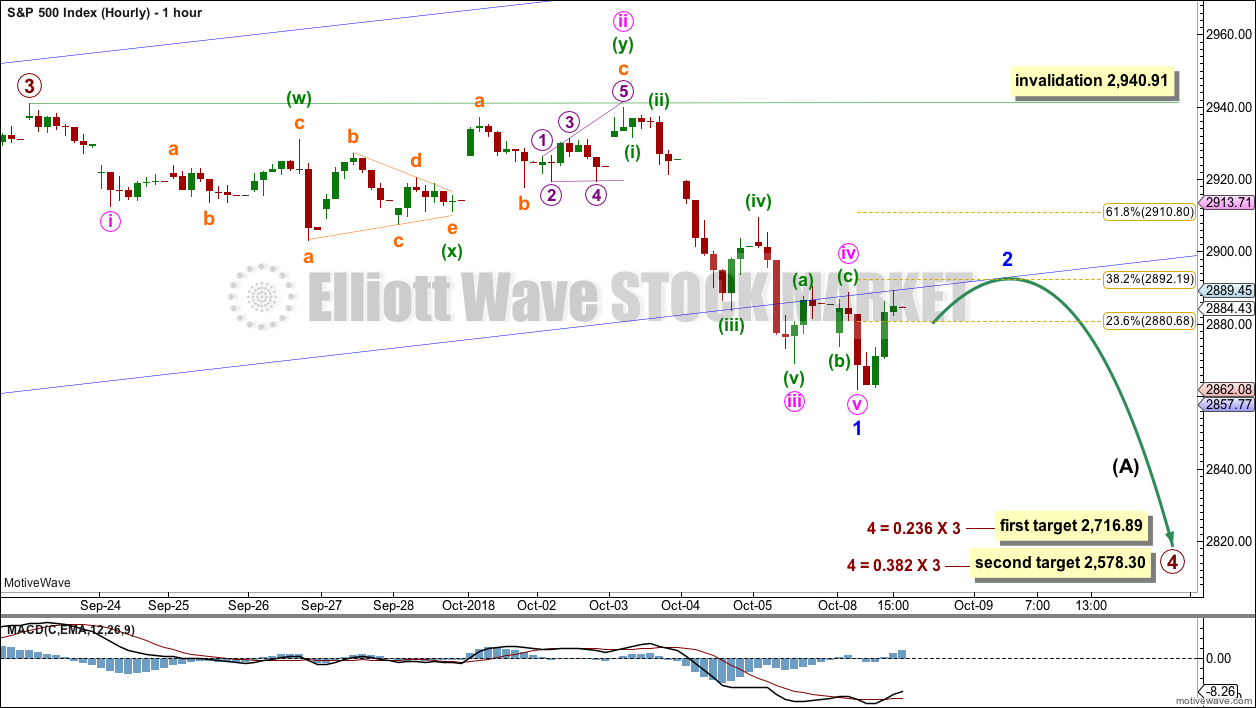
A movement at primary wave degree should begin with a five wave structure downwards. Today that may now be complete. There is disproportion within minor wave 1 between minute waves ii and iv. This is reasonably acceptable for this market; the S&P does not always exhibit good proportion. In bearish waves it may behave like a commodity, exhibiting strong third waves and brief shallow fourth waves.
Minor wave 2 may now unfold sideways over one to a few days as a shallow zigzag, flat or combination. A zigzag would be the most likely structure. If it finds resistance about the lower edge of the blue channel, then it may be shallow, ending close to the 0.382 Fibonacci ratio of minor wave 1 about 2,892.
Minor wave 2 may not move beyond the start of minor wave 1 above 2,940.91.
ALTERNATE ELLIOTT WAVE COUNT
DAILY CHART
Click chart to enlarge.
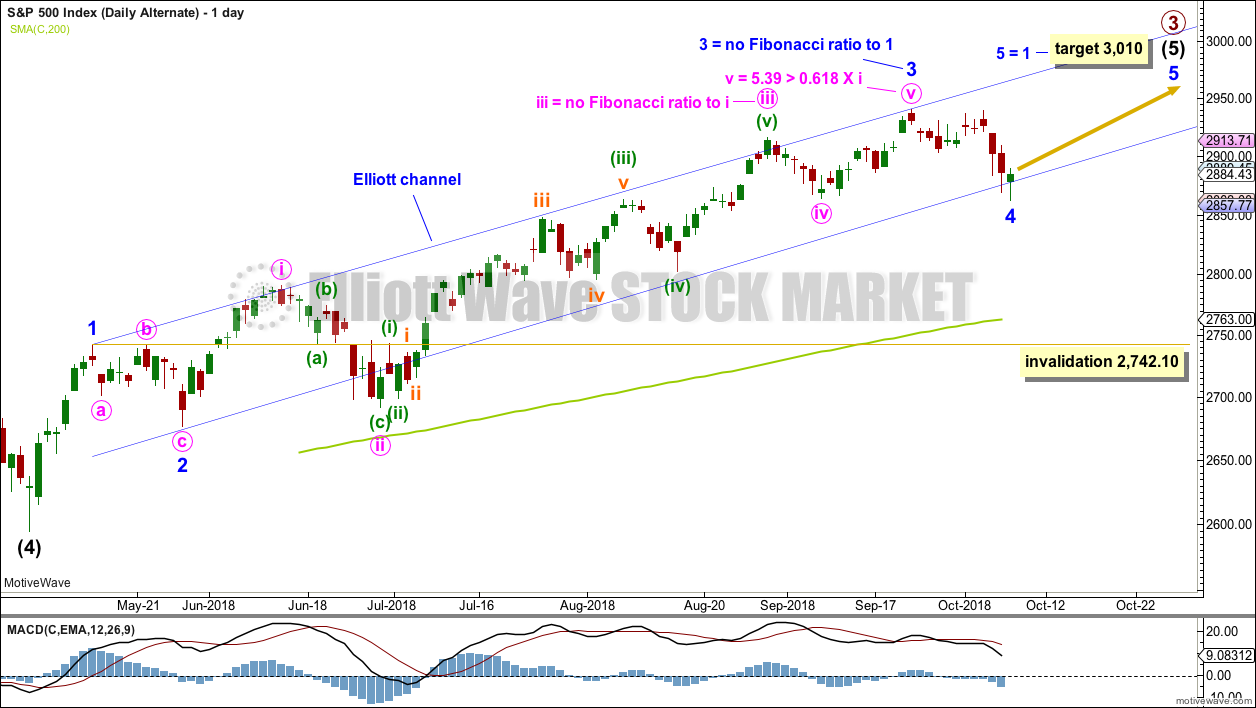
This was the main wave count up until today; with a new swing low below 2,864.12, it is swapped over to an alternate.
Intermediate wave (3) exhibits no Fibonacci ratio to intermediate wave (1). It is more likely then that intermediate wave (5) may exhibit a Fibonacci ratio to either of intermediate waves (1) or (3). Intermediate wave (5) has passed equality in length and 1.618 the length of intermediate wave (1). The next Fibonacci ratio in the sequence is 2.618 giving a target at 3,124. If the target at 3,010 is met and passed, then this would be the next calculated target.
A target for intermediate wave (5) to end is calculated at minor degree.
It is possible now that the pullback of the last three weeks may be minor wave 4, but relabelling intermediate wave (5) in this way loses a good Fibonacci ratio between minor waves 3 and 1; now the Fibonacci ratios for this wave count are not very good.
I have checked on the hourly chart the subdivisions of the middle of the third wave, subminuette wave iii. This wave count will fit, but there is some gross disproportion between corrections within subminuette wave iii for it to work. The S&P500 does not always exhibit good proportion.
The Elliott channel is redrawn. Minor wave 4 may have ended with a slight overshoot of the lower trend line.
Minor wave 4 may not move into minor wave 1 price territory below 2,742.10.
HOURLY CHART
Click chart to enlarge.
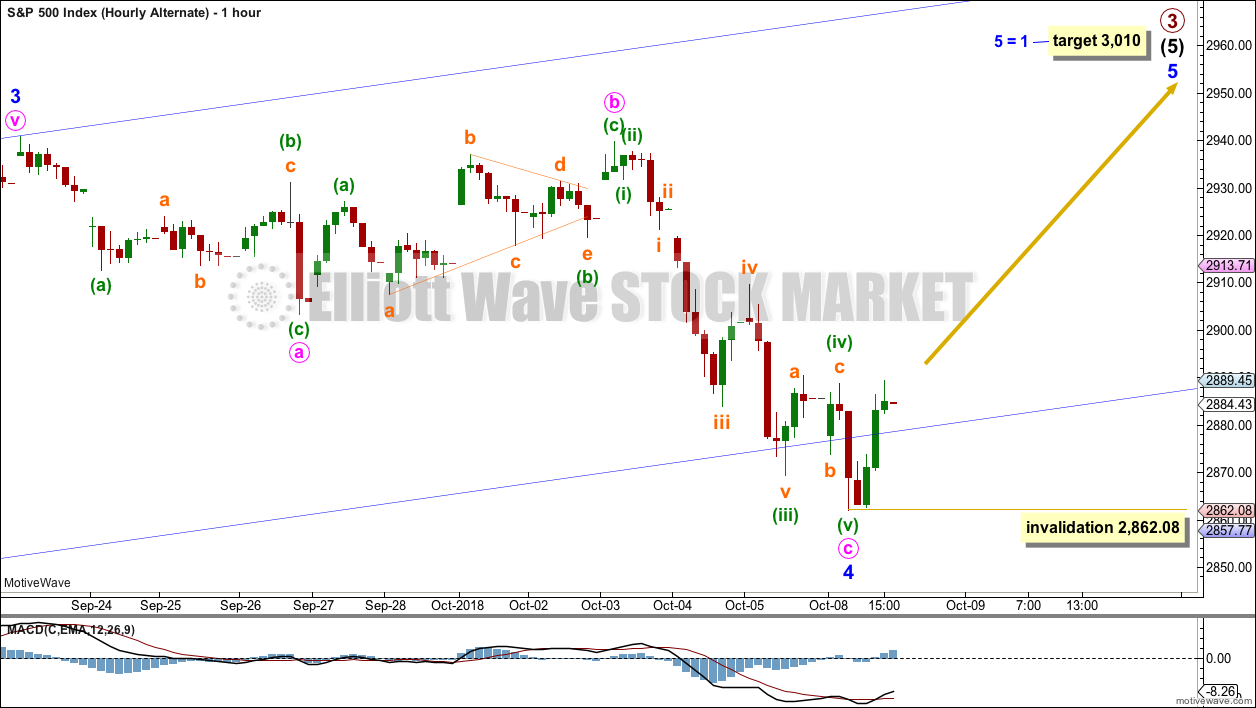
Minor wave 4 may now be a complete flat correction; this would be a regular flat because minute wave b is longer than 0.9 the length of minute wave a but less than 1.05 the length of minute wave a.
There is no adequate Fibonacci ratio between minute waves a and c.
Minute wave c no longer subdivides well as a five wave impulse.
Within minor wave 5, no second wave correction may move beyond the start of its first wave below 2,862.08.
TECHNICAL ANALYSIS
WEEKLY CHART
Click chart to enlarge. Chart courtesy of StockCharts.com.
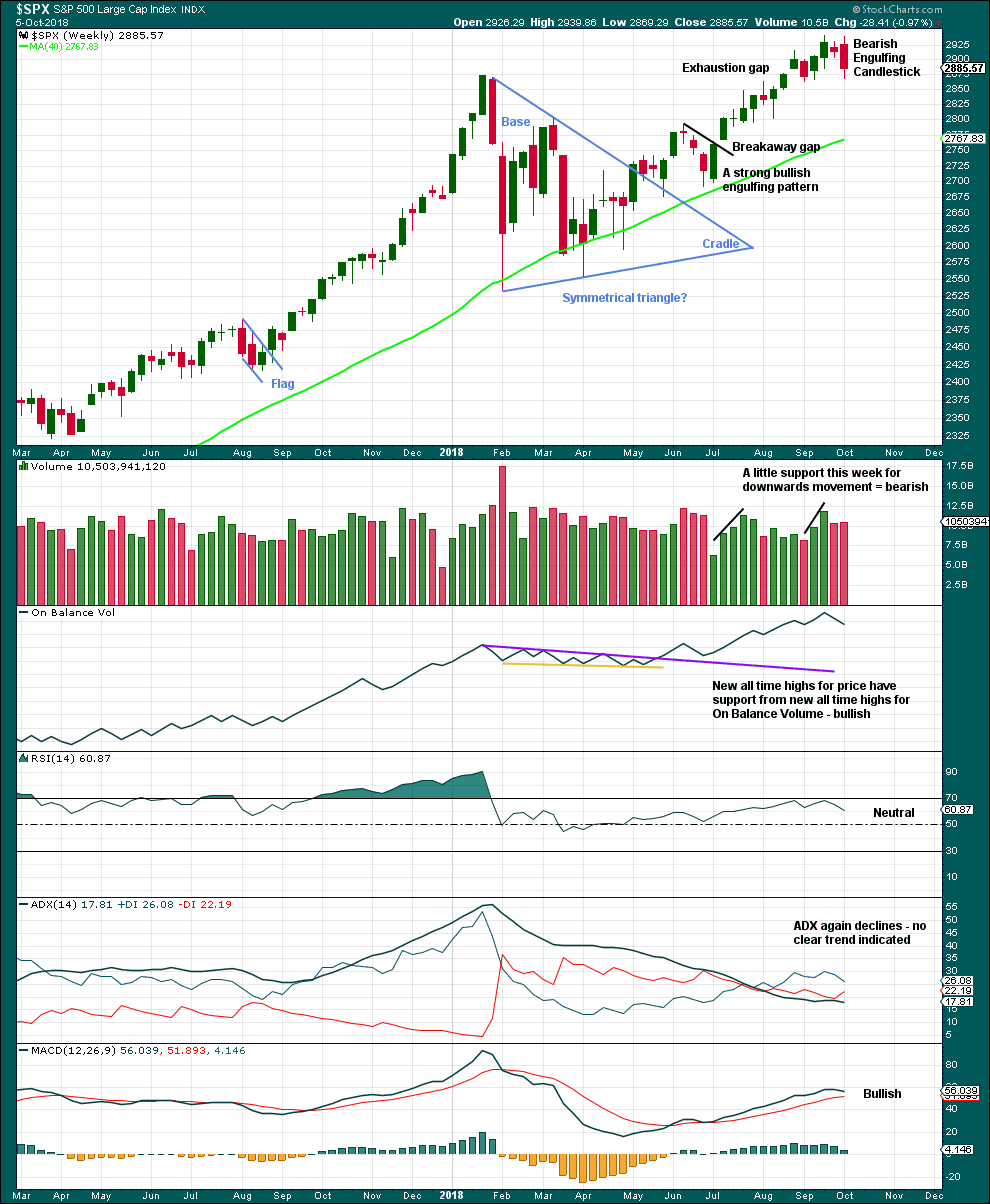
The symmetrical triangle base distance is 340.18. Added to the breakout point of 2,704.54 this gives a target at 3,044.72. This target has not yet been met.
Last week completes a Bearish Engulfing candlestick pattern (the strongest candlestick reversal pattern), which also has support from a slight increase in volume. This favours the main Elliott wave count.
DAILY CHART
Click chart to enlarge. Chart courtesy of StockCharts.com.
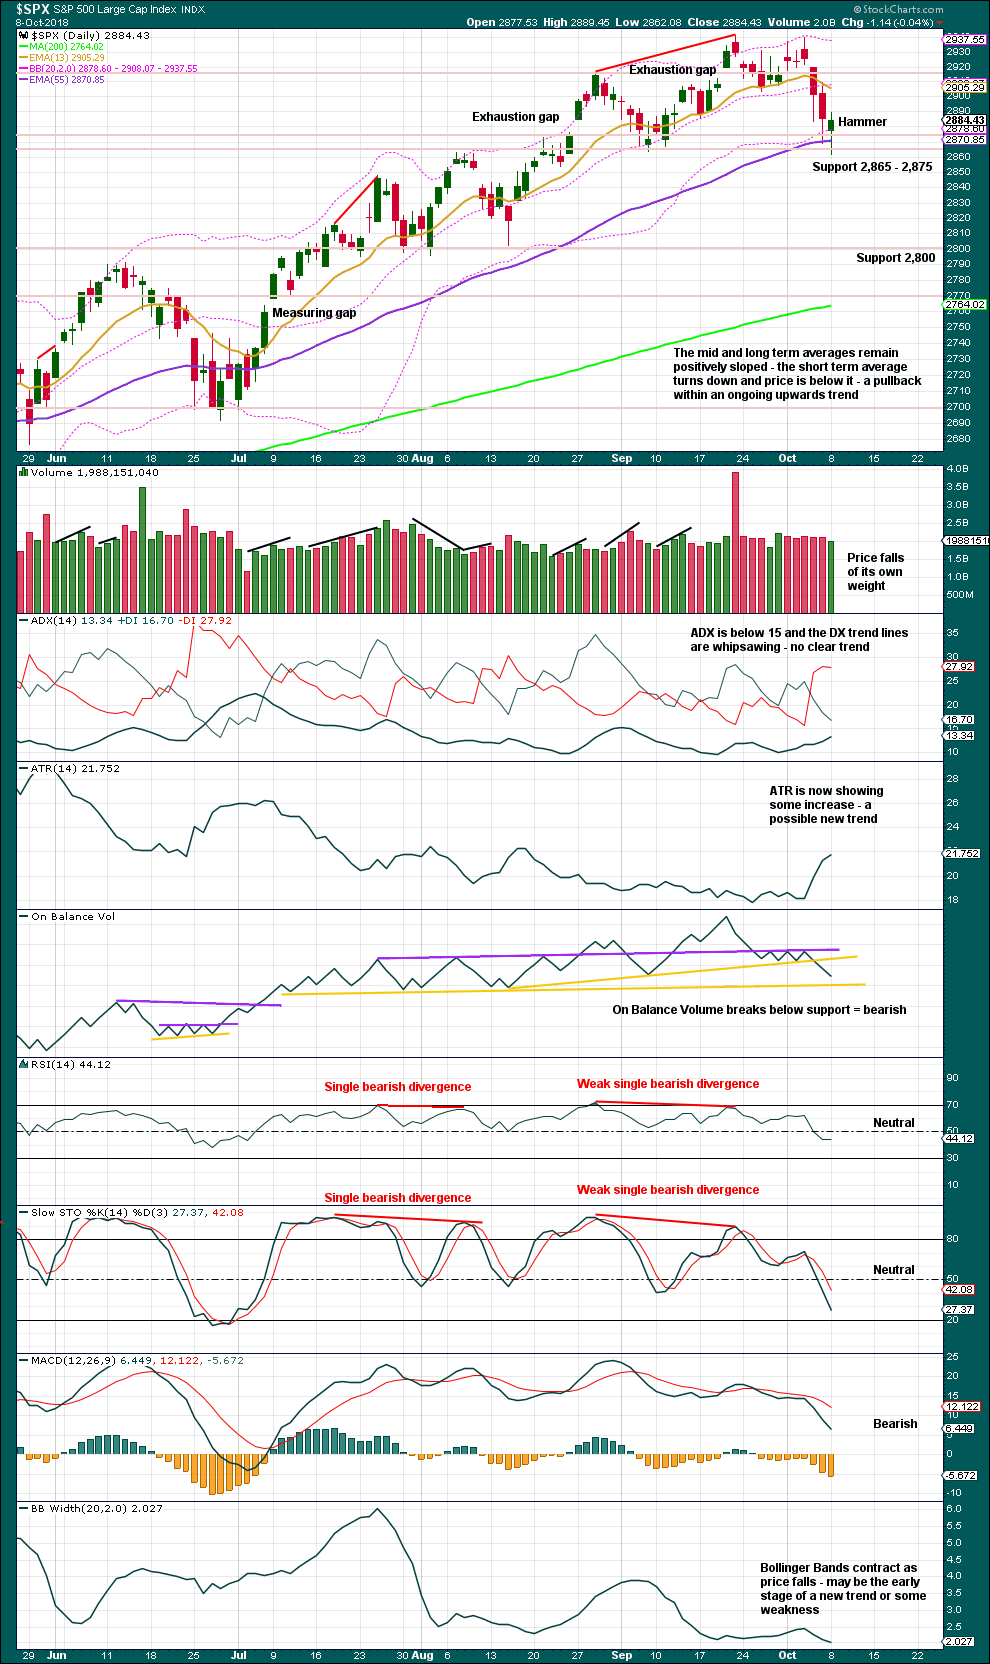
Today is the first new swing low since the upwards trend began in April. There is no longer a series of continuing higher highs and higher lows. With a lower low, there is now some indication from price of a possible trend change.
With a hammer candlestick pattern about support today, a bounce here may be expected.
VOLATILITY – INVERTED VIX CHART
WEEKLY CHART
Click chart to enlarge. Chart courtesy of StockCharts.com. So that colour blind members are included, bearish signals
will be noted with blue and bullish signals with yellow.
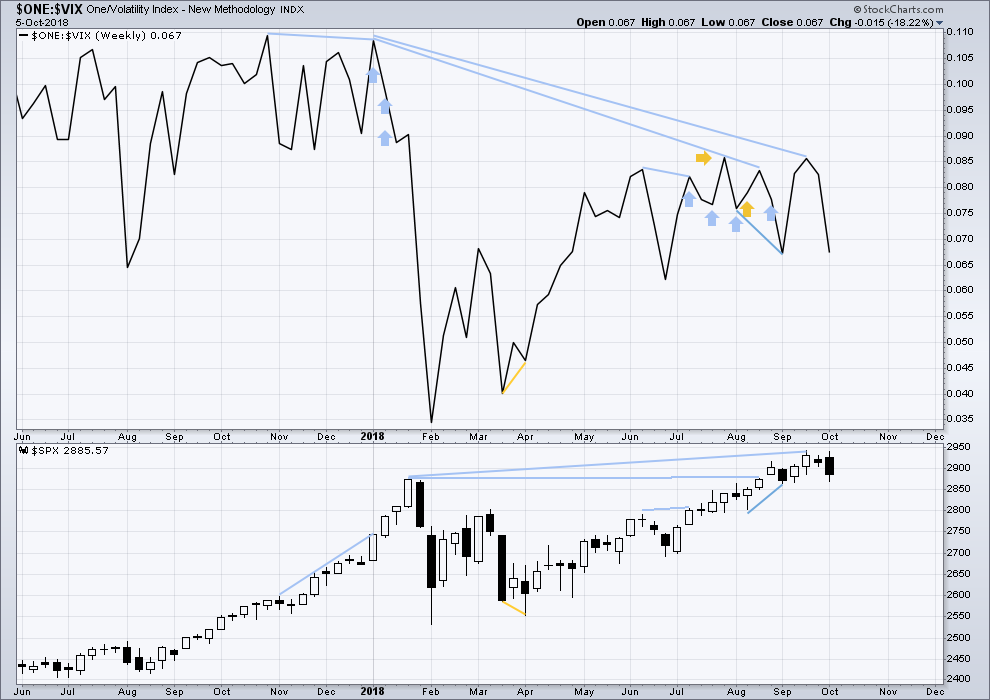
To keep an eye on the all time high for inverted VIX a weekly chart is required at this time.
Notice how inverted VIX has very strong bearish signals four weeks in a row just before the start of the last large fall in price. At the weekly chart level, this indicator may be useful again in warning of the end of primary wave 3.
At this time, there is mid term bearish divergence between price and inverted VIX: price has made another new all time high, but inverted VIX has not. This divergence may persist for some time. It may remain at the end of primary wave 3, and may develop further to the end of primary wave 5.
Both inverted VIX and price have moved lower and neither have made new swing lows. There is no divergence.
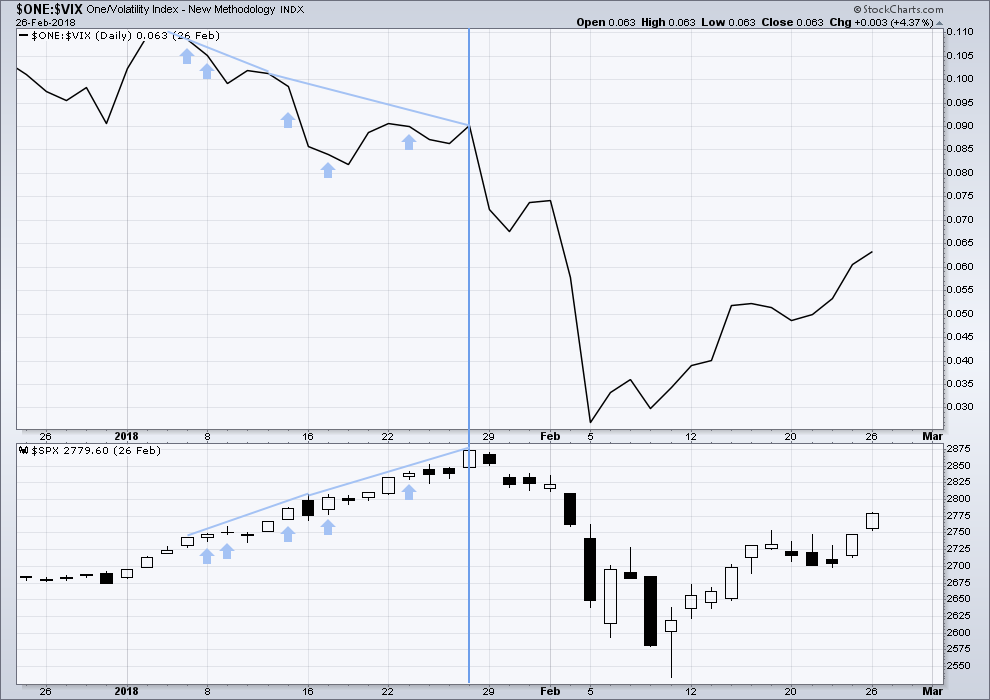
DAILY CHART
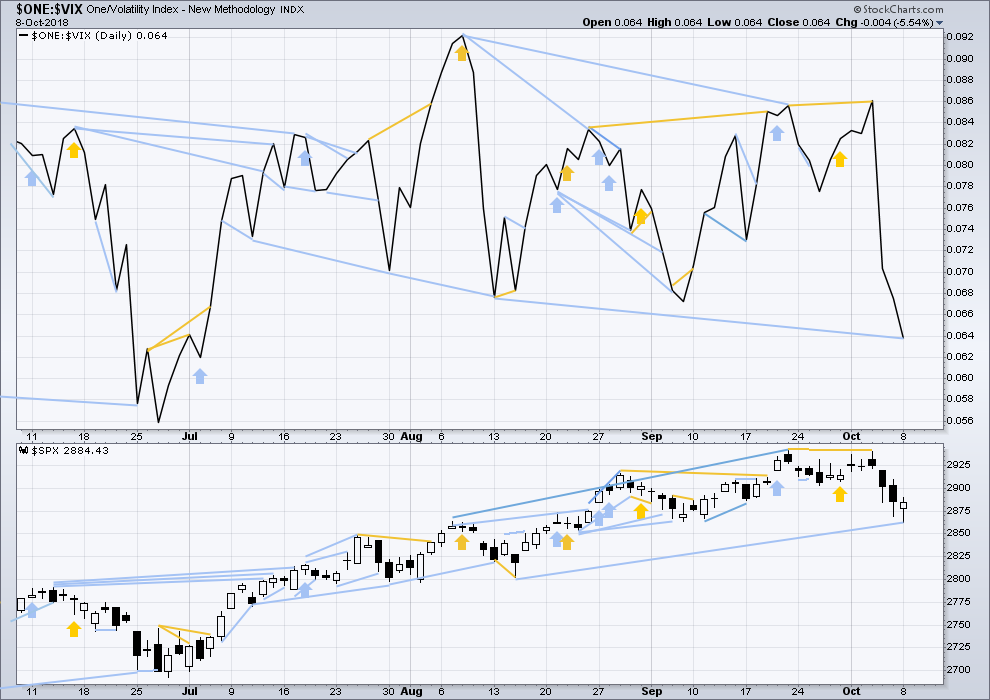
Click chart to enlarge. Chart courtesy of StockCharts.com. So that colour blind members are included, bearish signals
will be noted with blue and bullish signals with yellow.
Normally, volatility should decline as price moves higher and increase as price moves lower. This means that normally inverted VIX should move in the same direction as price.
There is mid term divergence with a new all time high from price not supported by a corresponding new all time high from inverted VIX. This divergence is bearish.
Inverted VIX has made a new low today below the swing low of the 13th / 15th of August, but price has not. This divergence is bearish; it is mid term. This supports the main Elliott wave count.
Mid term bearish divergence between price and inverted VIX can be seen on both daily and weekly charts now. There is now enough mid term bearish divergence to offer reasonable support to the main Elliott wave count.
BREADTH – AD LINE
WEEKLY CHART
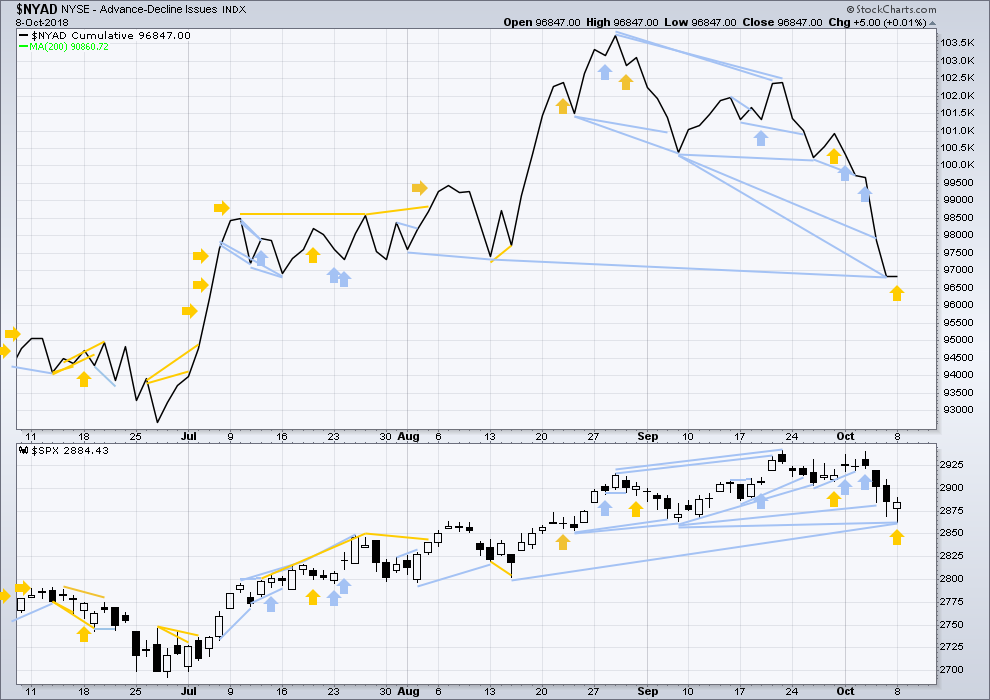
Click chart to enlarge. Chart courtesy of StockCharts.com.
When primary wave 3 comes to an end, it may be valuable to watch the AD line at the weekly time frame as well as the daily.
There is now triple bearish divergence between price and the AD line. The AD line this week has made a new strong swing low, but price has not. This offers reasonable support now to the main Elliott wave count.
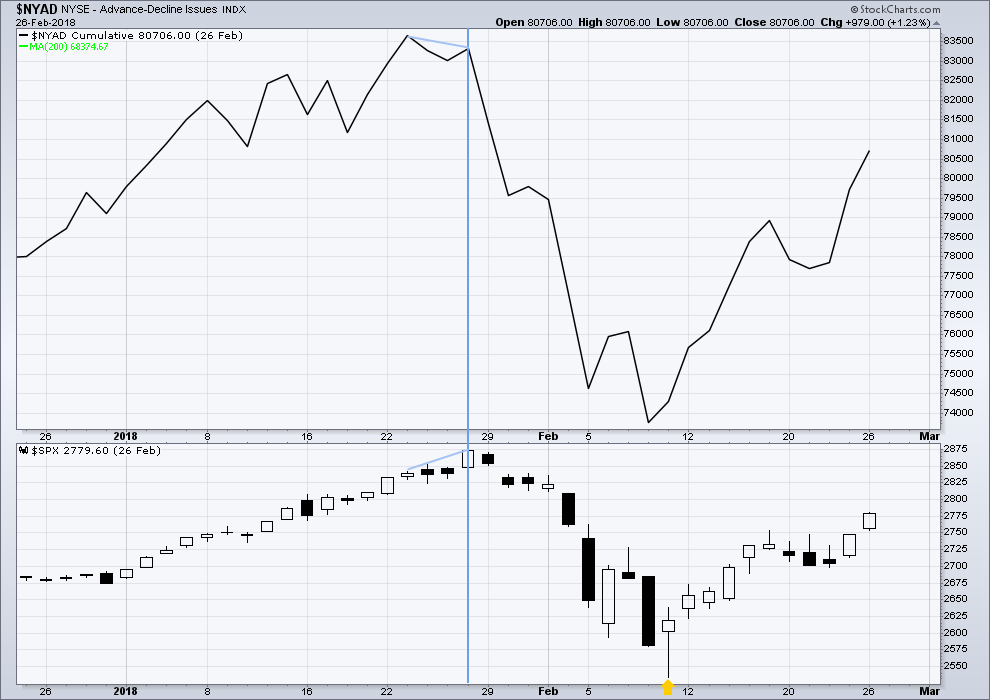
DAILY CHART
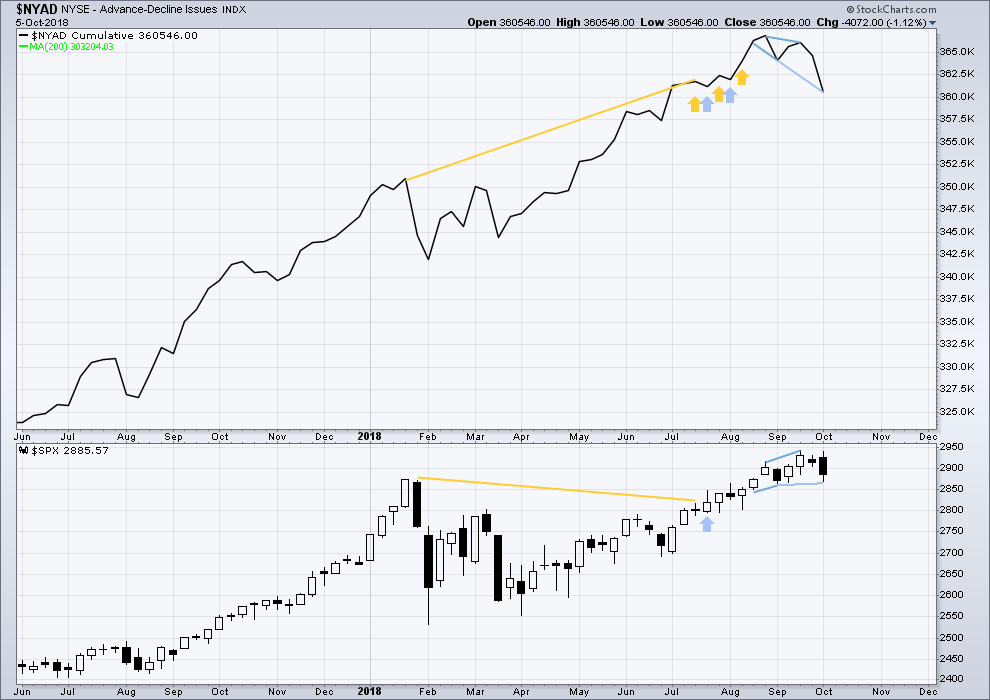
Click chart to enlarge. Chart courtesy of StockCharts.com.
There is normally 4-6 months divergence between price and market breadth prior to a full fledged bear market. This has been so for all major bear markets within the last 90 odd years. With no longer term divergence yet at this point, any decline in price should be expected to be a pullback within an ongoing bull market and not necessarily the start of a bear market. New all time highs from the AD line on the 29th of August means that the beginning of any bear market may be at the end of December 2018, but it may of course be a lot longer than that. My next expectation for the end of this bull market may now be October 2019.
Breadth should be read as a leading indicator.
There is now a cluster of bearish signals at the daily chart from the AD line; this offers now some reasonable support to the main Elliott wave count.
The AD line has made a new low today below the prior swing low of the 13th / 15th of August, but price has not. This is another instance now of mid term bearish divergence, which supports the main Elliott wave count.
Both small and mid caps are making strong new lows below their respective last swing lows. Large caps have today caught up.
DOW THEORY
The following lows need to be exceeded for Dow Theory to confirm the end of the bull market and a change to a bear market:
DJIA: 23,360.29.
DJT: 9,806.79.
S&P500: 2,532.69.
Nasdaq: 6,630.67.
All of DJIA, DJT, S&P500 and Nasdaq have made recent new all time highs. This provides Dow Theory confirmation that the bull market continues.
Charts showing each prior major swing low used for Dow Theory may be seen at the end of this analysis here.
ANALYSIS OF THE END OF INTERMEDIATE WAVE (3)
TECHNICAL ANALYSIS
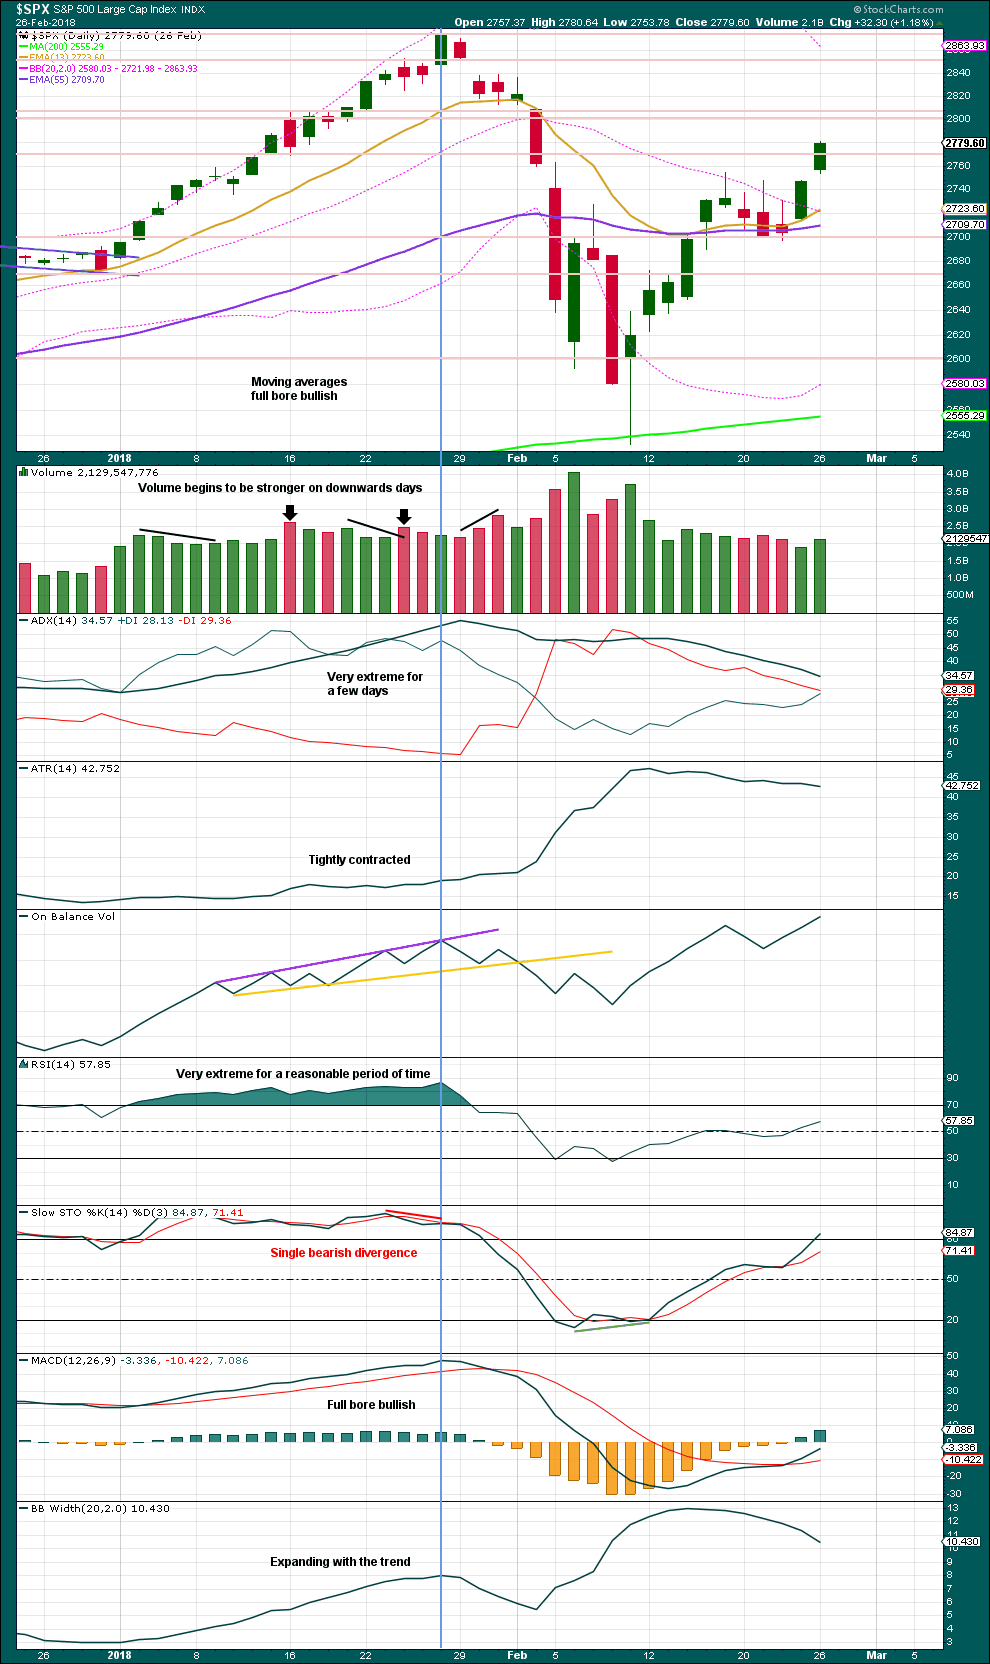
Click chart to enlarge. Chart courtesy of StockCharts.com.
This chart looked overly bullish at the end of intermediate wave (3). The only warning in hindsight may have been from volume spiking slightly on downwards days. There was no bearish divergence between price and either of RSI or On Balance Volume.
Single bearish divergence between price and Stochastics was weak, which is often an unreliable signal.
VIX
Click chart to enlarge. Chart courtesy of StockCharts.com.
This is a daily chart.
The strongest warning of an approaching intermediate degree correction at the daily chart level came from inverted VIX.
There was strong double bearish divergence at the high of intermediate wave (3), which is noted by the vertical line. There was also a sequence of five days of bearish divergence, days in which price moved higher but inverted VIX moved lower.
AD LINE
Click chart to enlarge. Chart courtesy of StockCharts.com.
This is a daily chart.
There was only single bearish divergence between price and the AD line at the end of intermediate wave (3). Approaching the high, there were no instances of price moving higher and the AD line moving lower.
Conclusion: When studying the behaviour of price and these indicators just before the start of intermediate wave (4), we may see some clues for warning us of primary wave 4. A cluster of bearish signals from VIX along with a bearish divergence from price and the AD line or On Balance Volume may warn of primary wave 4. The next instance will probably not behave the same as the last, but there may be similarities.
At this time, it does not look like primary wave 4 may begin right now, but we need to be aware of its approach.
Published @ 06:36 p.m. EST.
—
Careful risk management protects your trading account(s).
Follow my two Golden Rules:
1. Always trade with stops.
2. Risk only 1-5% of equity on any one trade.
And the power of the 1.27% extension, shown here in TLT. I took a bull call spread the moment it showed the start of a turn off it at 112.6. When you get comfortable with these things and how often they are “in play”, you can trade off them rather aggressively, and on the other side…with extremely tight stops, resulting in exceptional win/loss ratios.
GLD demonstrating again the power of the 78.6% retrace level. Sitting right on it for seven weeks now. I “need” (would like) about 7-8 more days sitting right there around 113, please (113 centered butterfly spread)…I don’t know if it’s gonna last though.
Updated hourly chart for the main wave count:
A five up to begin minor 2 looks complete, now a three down may also be complete.
Or, the degree of labelling within minor 2 could be moved down one degree, and it may be only minute a coming to an end shortly.
Either a C or and 3rd.
going long spx (for now) with a stop at 13:00 low
Kevin.
Does the RUT have a bearing on the SPX
I know it’s a stupid question but believe me. This is all new to me.
Hi Nino. It’s not a stupid question. But no, there is no reliable correlation between the two markets.
StockCharts have a correlation co-efficient tool. Looking at $SPX and $RUT their correlation co-efficient swings from positive right through 0 to negative.
This article over at Elliott Wave Gold explains it better.
Lara and Kevin
Thanks for the response. I’m really doing the 100 meter sprint in trying too absorb the info you guys are putting out.
I was certain today was a big down day. Never the less it’s comming. I think.
Thanks guys.
Lara
You should really look at doing lessons too guys like myself. M
We now have a flight that does Dubai Baki Auckland. So if I ever I get down your way. I will buy you the white wines you supply the good oil.
LMAO I do like a good Savignon Blanc from Marlborough, and New Zealand does produce some exceptional wines.
Always happy to meet up with members IRL, no wine payment necessary 🙂
I did offer one on one lessons a few years back, using Skype. But I just never really enjoyed doing it. So I stopped. I have a bunch of short videos on my education page, and over at Elliott Wave Gold in the education category (choose it from the drop down box on the RH sidebar, access this when you’re viewing public articles) I have lots of posts covering classic TA and some EW too.
I think that by watching my weekly videos, over time you’ll learn how to do it. And buy the book “Elliott Wave Principle” by Frost and Prechter, 10th edition.
The RUT is the Russell 2000 “small cap” stock index. It is composed of 2000 American companies of relatively small size. The SPX is the SP500 index, 500 relatively large companies, with a lot more international exposure than the RUT companies. When big market moves happen…they move together. But many times they move more independently, for all kinds of reasons. Interest rates changes tend to affect RUT companies more. International trade issues tend to effect the SPX companies (and perhaps helps RUT, because money moves from SPX company stock to RUT company stock). To sum it up: it’s complicated!
RUT has so far been unable to bust it’s bearish symmetry. So…at this point in time, RUT’s strong down trend continues. More bearish evidence. If RUT > 1643, then the push up in price is larger than any during the sell off, and that would signal me that the sell off is most likely over and I might get long to catch some of the bounce up. But nyet.
Break the trend line….break the bearish symmetry (the white horizontal line)…and I believe the big wave down is complete. Adding to that view: the squat/turn on the overlapped fibo levels (shown), and the fact that this overall move is EXACTLY the same length (“symmetry”) with a recent prior RUT sell off.
Thank You Kevin, and thanks for all the intraday info
You are welcome Debbie. Helps keep me out of trouble…sometimes.
SPX inside candle on the 15 min… lets see where she wants to go
Guys do you think we may see subb lows tonight. Sorry the novice
If you mean over night lows that are below the recent SPX low of 2862…I suspect everyone has a different perspective on that.
It really depends on the next 3 hours. Price may be free falling well below that into the close for all we know right now. Or…taking off like a rocket upward (unlikely but possible).
Assuming price generally holds here, I’d say overnight lows under 2862 are only about 20% likely, but that’s just a guess. Not trading advice!
I do note that today, similar to the last week or two, the early morning is up…then selling, selling, selling. Getting started now….
Lara,
Just curious, when does the time frame start for primary wave 4, starting from the all time high or the break of 2864?
Since Lara is probably is la-la land at the moment…as currently modeled in the main daily and weekly charts, it starts with the high on 10/3 (which is labeled with a brown “circle 3” i.e., the end of the primary 3, and hence start of primary 4).
LOL I was fast asleep. New Zealand time zone is pretty much opposite to New York.
Kevin’s answered correctly anyway. Thanks Kevin!
SPX daily. Clearly inside it’s intermediate 5 channel with a perfect bounce off the lower trend line. I remain mildly bullish that TL is broken (though I have a variety of shorts in preparation…).
Note the two days of squeeze now present in SPX daily. I think the odds of that resolving with upward price movement is very high given all the evidence.
BTW loved the LUV .
It is breaking down according to Hoyle off the 78.6%. I’m still holding LUV puts. I’m looking for a 62% retrace of the up move, to around 55, or perhaps even more as the P4 unfolds.
Something I just now noticed. The weekly shows a H/S (massive!) in development, with the recent peak the 2nd shoulder. The neck line is down at 50. A measuring rule collapse below that would put LUV at <35. Unlikely but we'll see.
For those who like their triangles Big and Strong. CVX, weekly. Note the 10 weeks of squeeze as well.
D completes around 128, then back down in E?
This is good stuff Kevin…
TLT did a (double) bounce on the 127.2% extension at 112.6 yesterday, and has turned back up slightly today. I’ve taken a bull call spread on it. I expect a lot of upward “backing and filling” over the next few days, maybe even weeks.
First! Take that silly rabbit!
Haha! I miss Doc… where is he???
It’s funny he hardly commented other than being first and posting pics of Looney Tunes characters…
The fun loving nature and camaraderie of this blog waxes and wanes. I enjoy the community and enjoy the humor as well.
Yes to both points, Rodney! I check here many times most days. Good market insights often and a good chuckle sometimes too.
Hangin’ with da’ boyz, Doc!
Some big developments at Bottarelli Research…. 🙂