
A signal from On Balance Volume and another signal from the AD line this week all support the alternate Elliott wave count. Price is the ultimate determinator though, so a specific price point is given for members that may indicate which wave count is correct.
Summary: At this stage, it would be best to let price tell us if primary wave 3 is over or not.
While price remains above 2,864.12, then this may still be another pullback within an ongoing upwards trend. The target is now at 3,017.
If price makes a new low by any amount at any time frame below 2,864.12, then some confidence that primary wave 4 has begun may be had. Targets are either 2,716.89 or 2,578.30.
At the end of this week, there is now a candlestick reversal pattern on the weekly chart, reasonable bearish signals from the AD line, and a bearish signal from On Balance Volume. The alternate wave count should be seriously considered now.
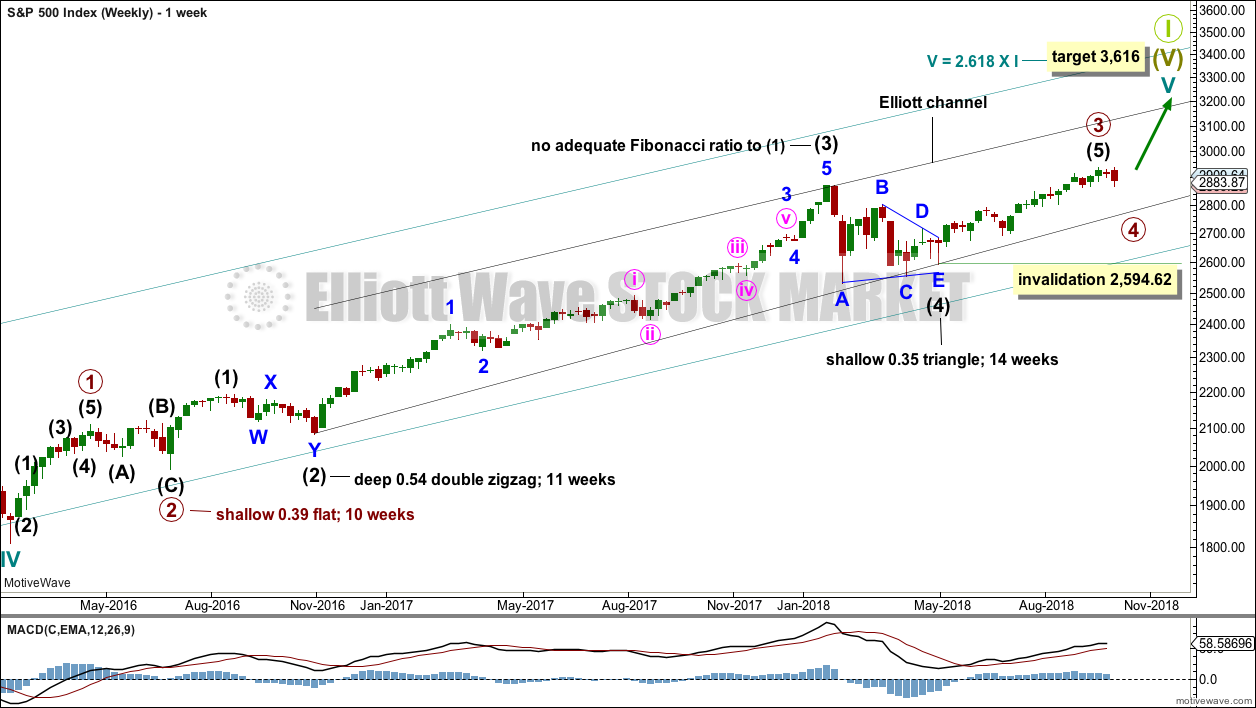
The final target for this bull market to end remains at 3,616, which may be met in October 2019.
New updates to this analysis are in bold.
The biggest picture, Grand Super Cycle analysis, is here.
Last historic analysis with monthly charts is here, video is here.
MAIN ELLIOTT WAVE COUNT
WEEKLY CHART
Click chart to enlarge.
Cycle wave V must complete as a five structure, which should look clear at the weekly chart level and also now at the monthly chart level. It may only be an impulse or ending diagonal. At this stage, it is clear it is an impulse.
Within cycle wave V, the third waves at all degrees may only subdivide as impulses.
Intermediate wave (4) has breached an Elliott channel drawn using Elliott’s first technique. The channel is redrawn using Elliott’s second technique: the first trend line from the ends of intermediate waves (2) to (4), then a parallel copy on the end of intermediate wave (3). Intermediate wave (5) may end either midway within the channel, or about the upper edge.
There is perfect alternation and excellent proportion between intermediate waves (2) and (4).
At this stage, the expectation is for the final target to me met in October 2019. If price gets up to this target and either the structure is incomplete or price keeps rising through it, then a new higher target would be calculated.
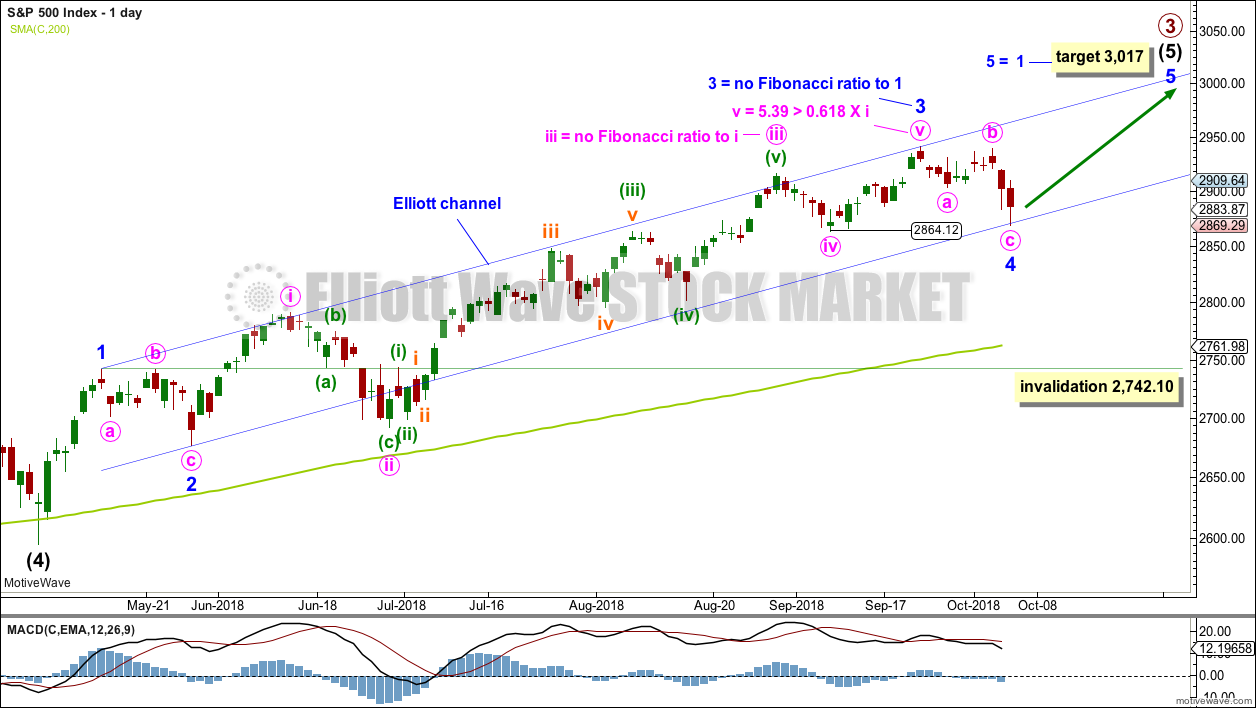
DAILY CHART
Click chart to enlarge.
This wave count at the end of this week has reasonably less support from classic technical analysis than the alternate wave count. However, while price remains above 2,864.12, there is still a series of higher highs and higher lows in place. For confidence, this wave count now requires price to remain above 2,864.12 next week.
Intermediate wave (5) avoided a truncation now that it has a new high above the end of intermediate wave (3) at 2,872.87.
Intermediate wave (3) exhibits no Fibonacci ratio to intermediate wave (1). It is more likely then that intermediate wave (5) may exhibit a Fibonacci ratio to either of intermediate waves (1) or (3). Intermediate wave (5) has passed equality in length and 1.618 the length of intermediate wave (1). The next Fibonacci ratio in the sequence is 2.618 giving a target at 3,124. If the target at 3,012 is met and passed, then this would be the next calculated target.
A target for intermediate wave (5) to end is calculated at minor degree.
At the end of this week, the structure of intermediate wave (5) is relabelled because the last main wave count no longer had good proportion. It is possible now that the pullback of the last three weeks may be minor wave 4, but relabelling intermediate wave (5) in this way loses a good Fibonacci ratio between minor waves 3 and 1; now the Fibonacci ratios for this wave count are not very good.
I have checked on the hourly chart the subdivisions of the middle of the third wave, subminuette wave iii. This wave count will fit, but there is some gross disproportion between corrections within subminuette wave iii for it to work. The S&P500 does not always exhibit good proportion.
The Elliott channel is redrawn. Minor wave 4 may end here about support at the lower trend line.
Minor wave 4 may not move into minor wave 1 price territory below 2,742.10. However, this wave count may be discarded if price makes a new swing low below 2,864.12, because then there would no longer be a series of higher highs and higher lows in place, so a trend change would be indicated.
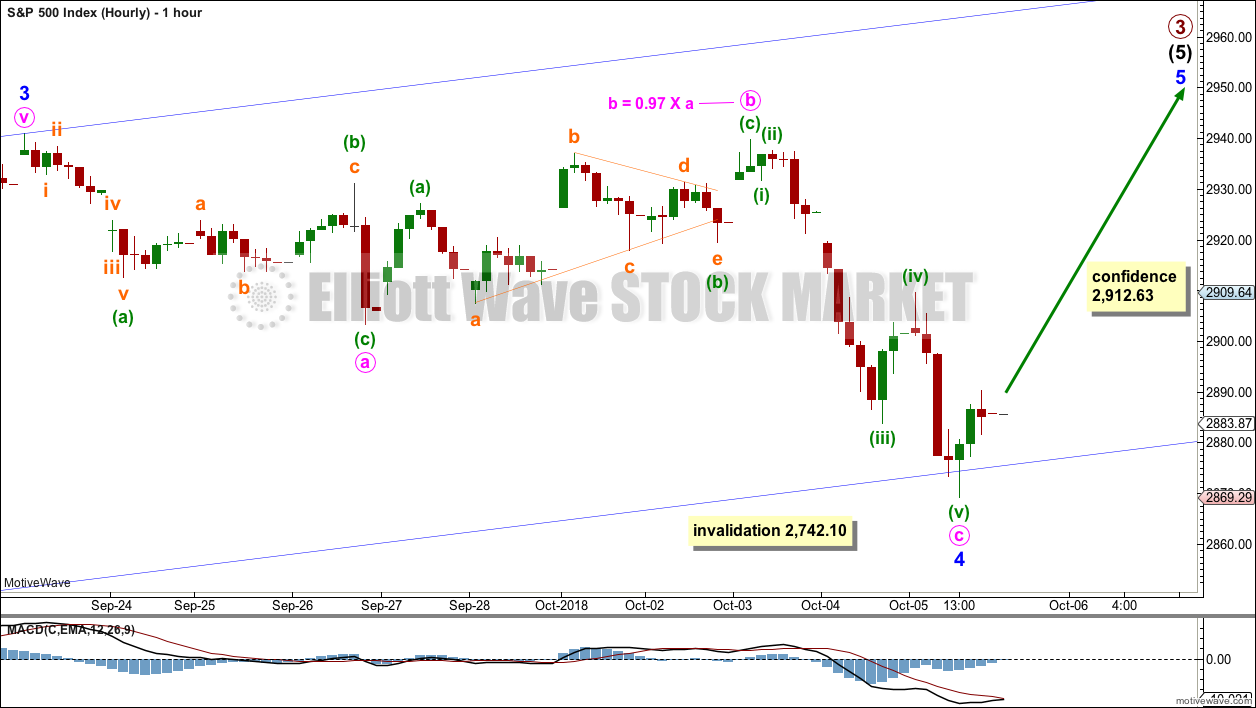
HOURLY CHART
Click chart to enlarge.
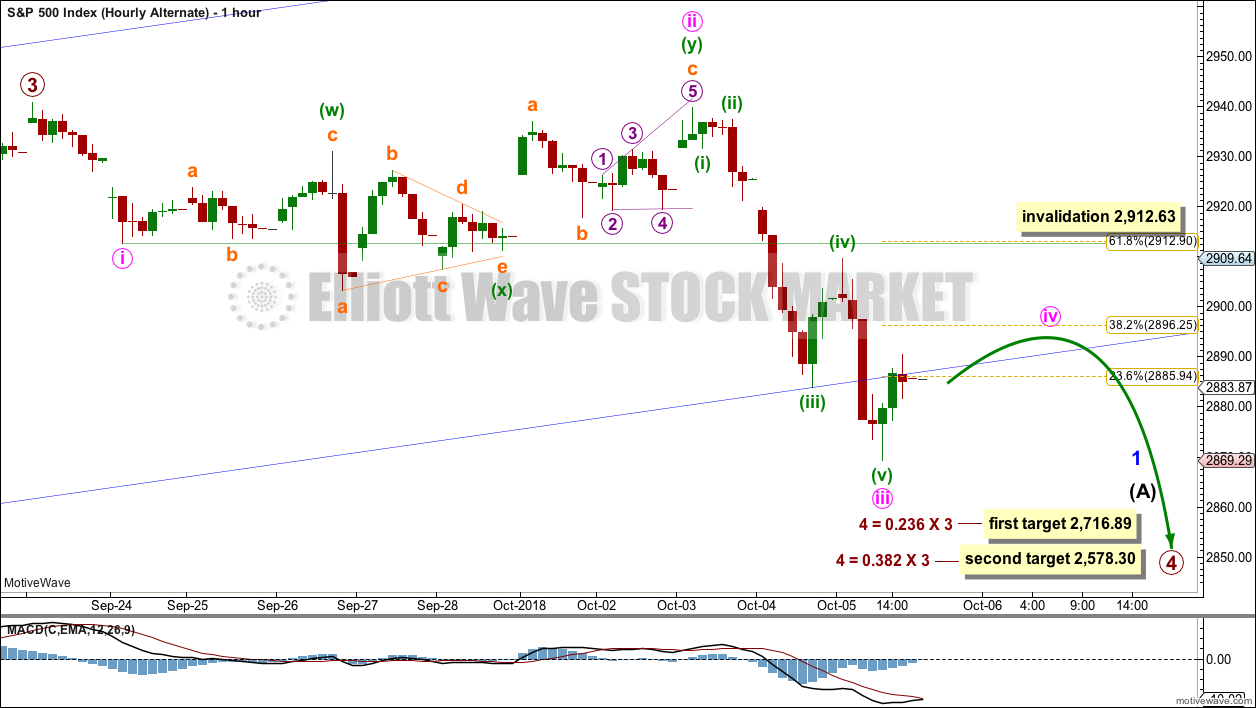
Minor wave 4 may now be a complete flat correction; this would be a regular flat because minute wave b is longer than 0.9 the length of minute wave a but less than 1.05 the length of minute wave a.
There is no longer any adequate Fibonacci ratio between minute waves a and c.
While it is possible that minor wave 4 could continue lower, a new low below 2,864.12 would indicate a trend change, so this wave count may be discarded.
ALTERNATE ELLIOTT WAVE COUNT
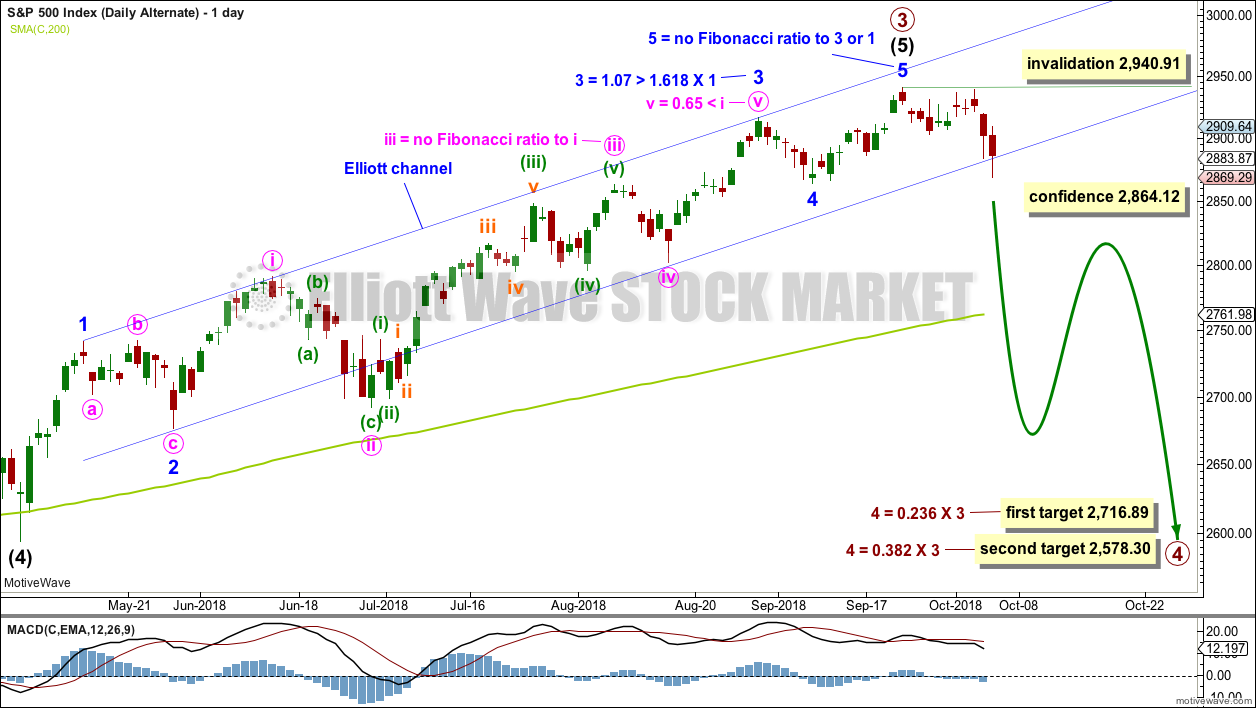
DAILY CHART
Click chart to enlarge.
It is possible to see now that primary wave 3 could be over at the last high by simply moving the degree of labelling within minor wave 5 up one degree.
It is reasonably common for the S&P to exhibit a Fibonacci ratio between two actionary waves within an impulse, and uncommon for it to exhibit Fibonacci ratios between all three actionary waves within an impulse. The lack of a Fibonacci ratio for minor wave 5 within this wave count is not of any concern; this looks typical.
There are two excellent Fibonacci ratios within this wave count. The Fibonacci ratios for this wave count are better than for the main wave count.
Primary wave 4 would most likely end somewhere within the price territory of the fourth wave of one lesser degree. Intermediate wave (4) has its price territory from 2,872.87 to 2,532.69. Within this range sit two Fibonacci ratios giving two targets. The lower 0.382 Fibonacci ratio may be more likely.
Primary wave 2 unfolded as a shallow regular flat correction lasting 10 weeks. Primary wave 4 may exhibit alternation in structure and may most likely unfold as a zigzag, triangle or combination. A zigzag would be the most likely structure as these are the most common corrective structures and would provide the best alternation with primary wave 2.
Primary wave 4 may not move into primary wave 1 price territory below 2,111.05. However, the lows in primary wave 4 should not get close to this point. The lower edge of the teal channel on the weekly chart should provide very strong support.
HOURLY CHART
Click chart to enlarge.
A movement at primary wave degree should begin with a five wave structure downwards. So far that would be incomplete.
The first five down may be labelled minor wave 1. So far minute waves i through to iii may now be complete. There is now an adequate Fibonacci ratio between minute waves i and iii.
Minute wave iii has shown a strong increase in downwards momentum.
Minute wave iv may now unfold sideways over a few days as a shallow correction, most likely ending about the 0.382 Fiboancci ratio. Minute wave iv may exhibit alternation with the combination of minute wave ii as a zigzag or triangle.
Minute wave iv may not move into minute wave i price territory above 2,912.63.
If this invalidation point is breached, then it would also be possible that minute wave iii may be incomplete. Within minute wave iii, no second wave correction may move beyond the start of its first wave above 2,939.86. Only a new high above this point would fully invalidate the bearish wave count at this stage.
TECHNICAL ANALYSIS
WEEKLY CHART
Click chart to enlarge. Chart courtesy of StockCharts.com.
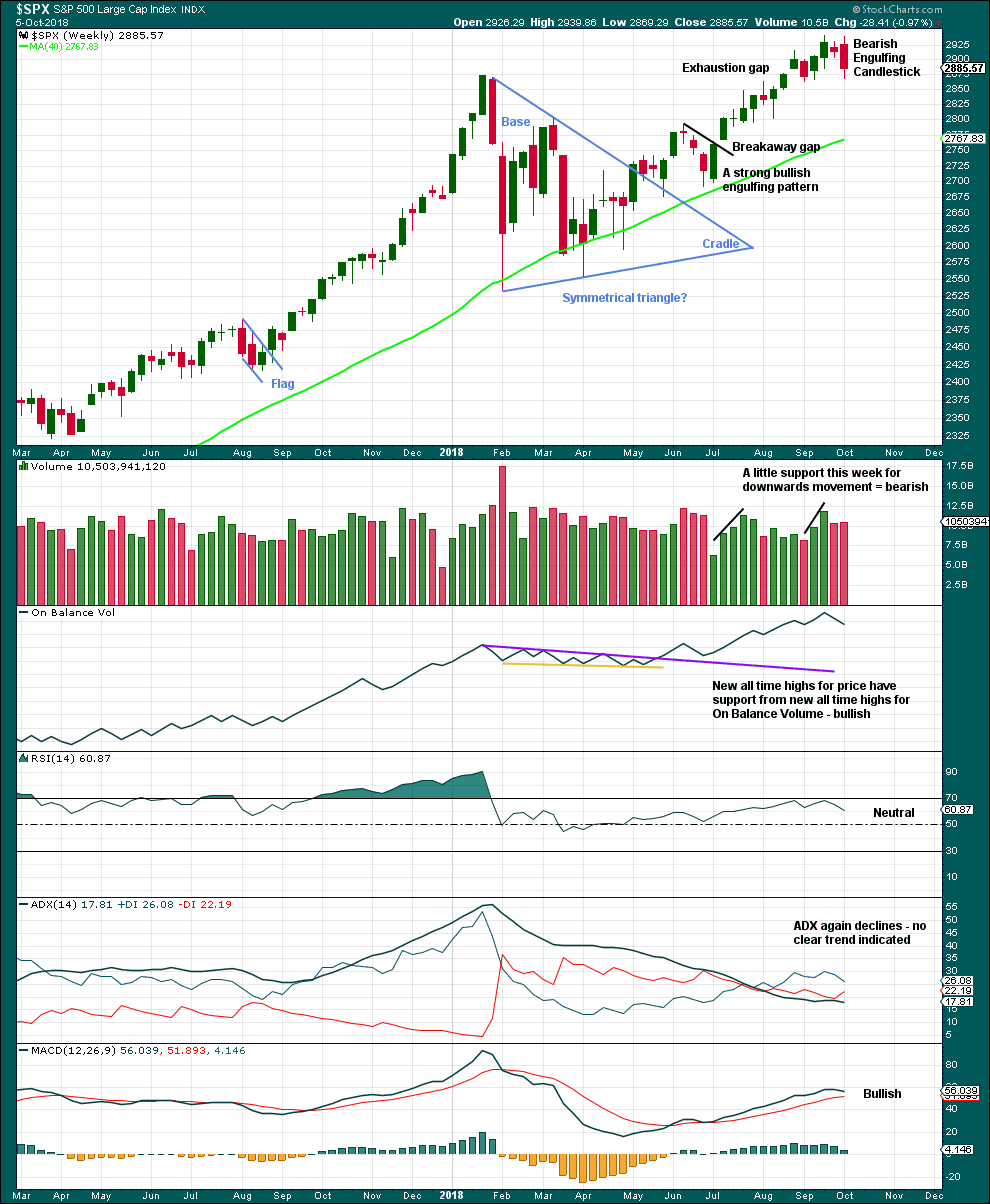
The symmetrical triangle base distance is 340.18. Added to the breakout point of 2,704.54 this gives a target at 3,044.72. This target has not yet been met.
This week completes a Bearish Engulfing candlestick pattern (the strongest candlestick reversal pattern), which also has support from a slight increase in volume. This favours the alternate Elliott wave count.
DAILY CHART
Click chart to enlarge. Chart courtesy of StockCharts.com.
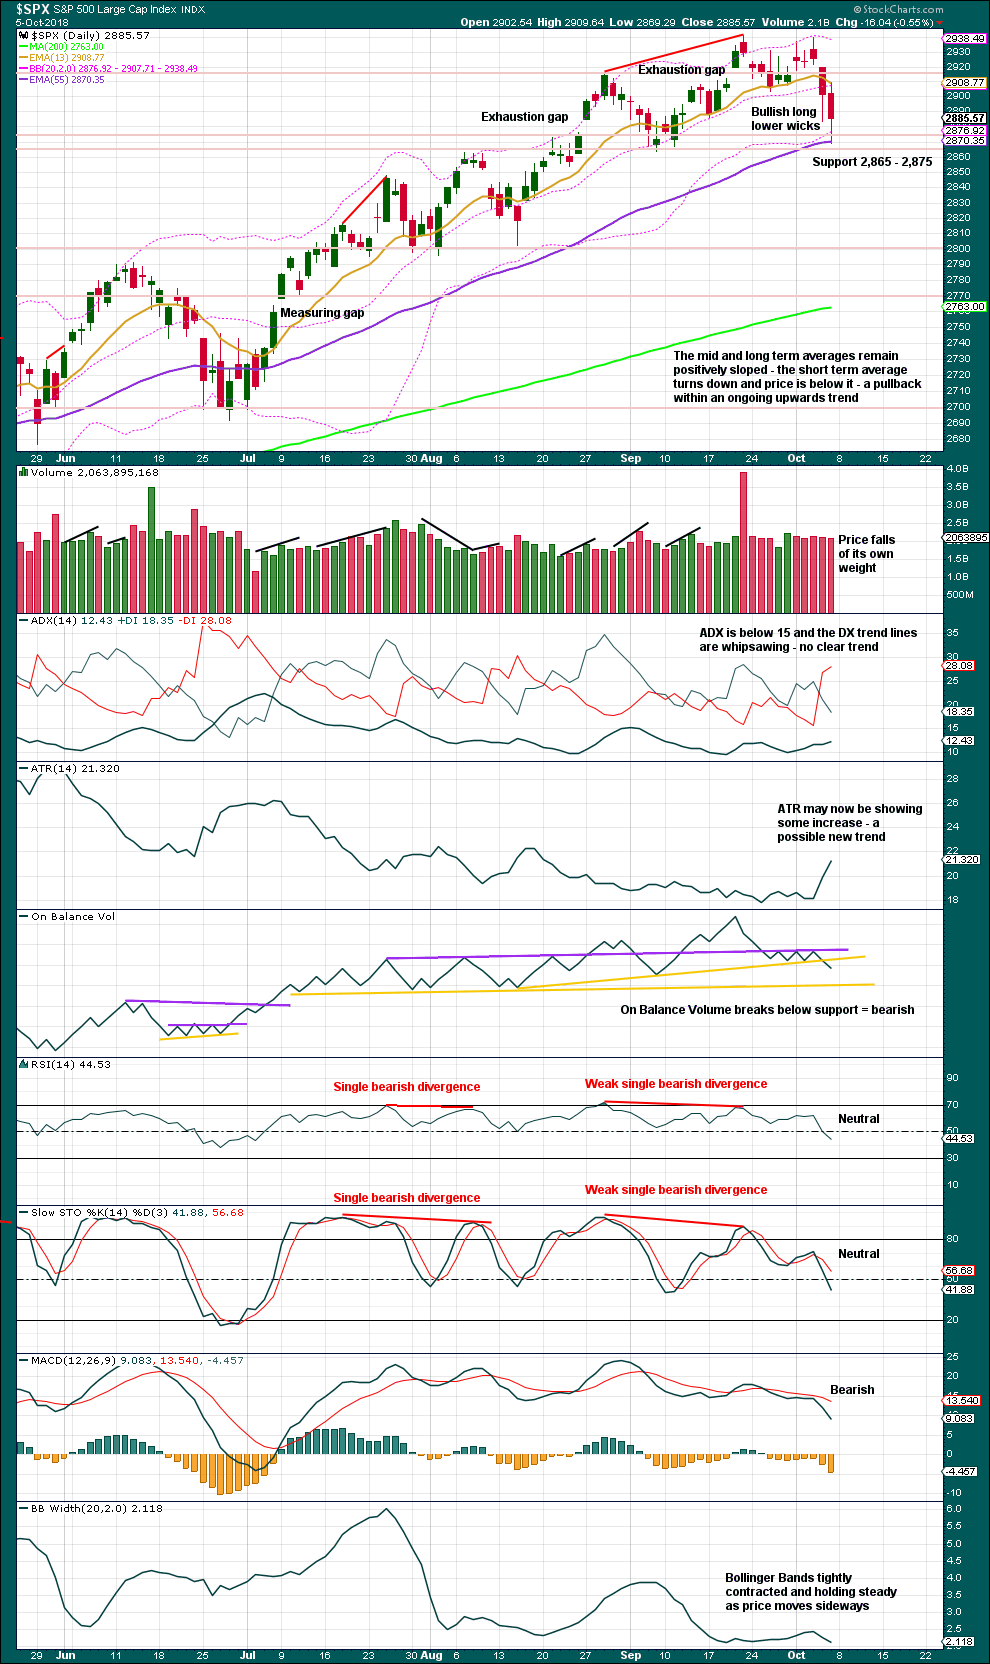
The last two sessions of the week show some bearish strength. The signal from On Balance Volume is reasonable. This supports the alternate Elliott wave count now.
The bottom line remains that an upwards trend remains intact until price makes a new swing low. Look now for strong support about 2,875 – 2,865. If price makes a new swing low below 2,864.12, that would indicate a change from an upwards trend to either a larger sideways consolidation or a new downwards trend.
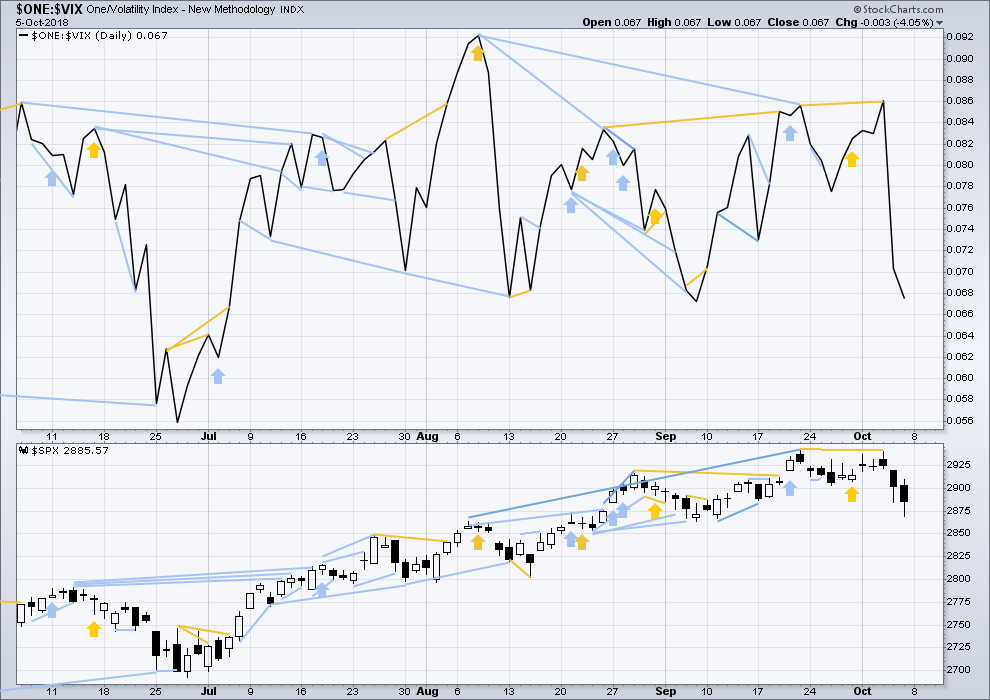
VOLATILITY – INVERTED VIX CHART
WEEKLY CHART
Click chart to enlarge. Chart courtesy of StockCharts.com. So that colour blind members are included, bearish signals
will be noted with blue and bullish signals with yellow.
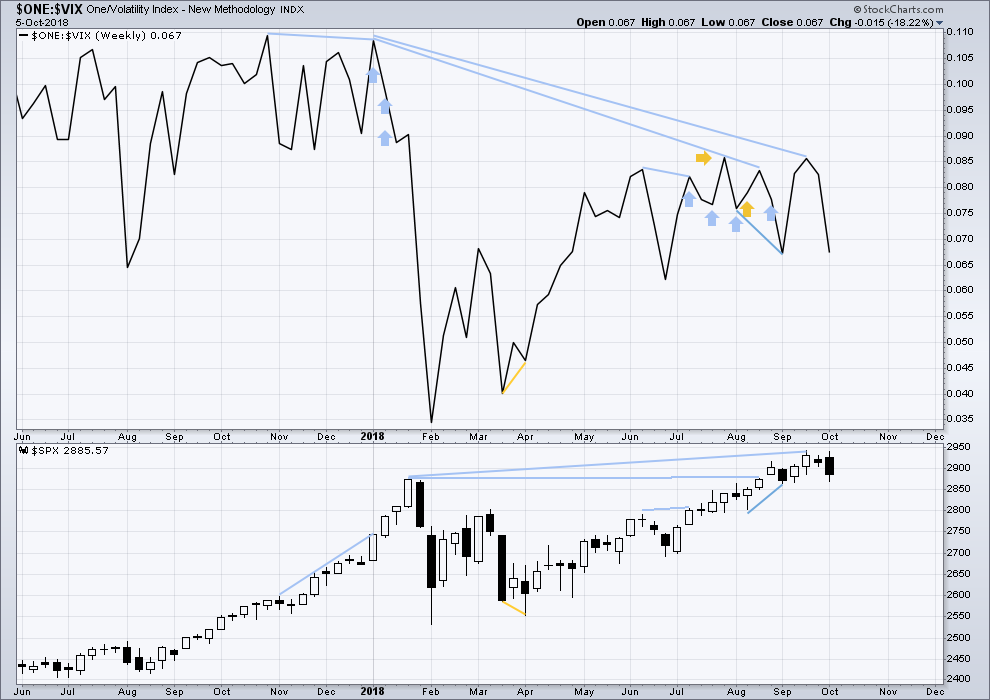
To keep an eye on the all time high for inverted VIX a weekly chart is required at this time.
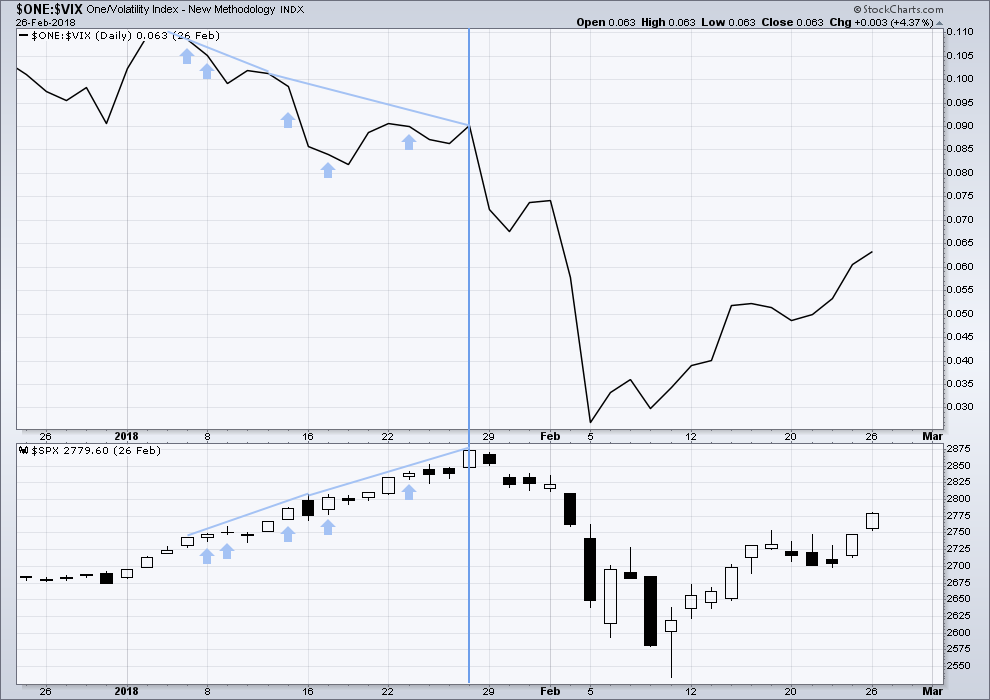
Notice how inverted VIX has very strong bearish signals four weeks in a row just before the start of the last large fall in price. At the weekly chart level, this indicator may be useful again in warning of the end of primary wave 3.
At this time, there is mid term bearish divergence between price and inverted VIX: price has made another new all time high, but inverted VIX has not. This divergence may persist for some time. It may remain at the end of primary wave 3, and may develop further to the end of primary wave 5.
Both inverted VIX and price this week have moved lower and neither have made new swing lows. There is no divergence.
DAILY CHART
Click chart to enlarge. Chart courtesy of StockCharts.com. So that colour blind members are included, bearish signals
will be noted with blue and bullish signals with yellow.
Normally, volatility should decline as price moves higher and increase as price moves lower. This means that normally inverted VIX should move in the same direction as price.
There is mid term divergence with a new all time high from price not supported by a corresponding new all time high from inverted VIX. This divergence is bearish.
Both price and inverted VIX have moved lower. Both have lows slightly above the prior swing low of the 7th of September. There is no divergence.
Mid term bearish divergence between price and inverted VIX can be seen on both daily and weekly charts now. However, this may not be a good timing tool in identifying the end of primary wave 3; divergence may develop further before primary wave 3 ends.
BREADTH – AD LINE
WEEKLY CHART
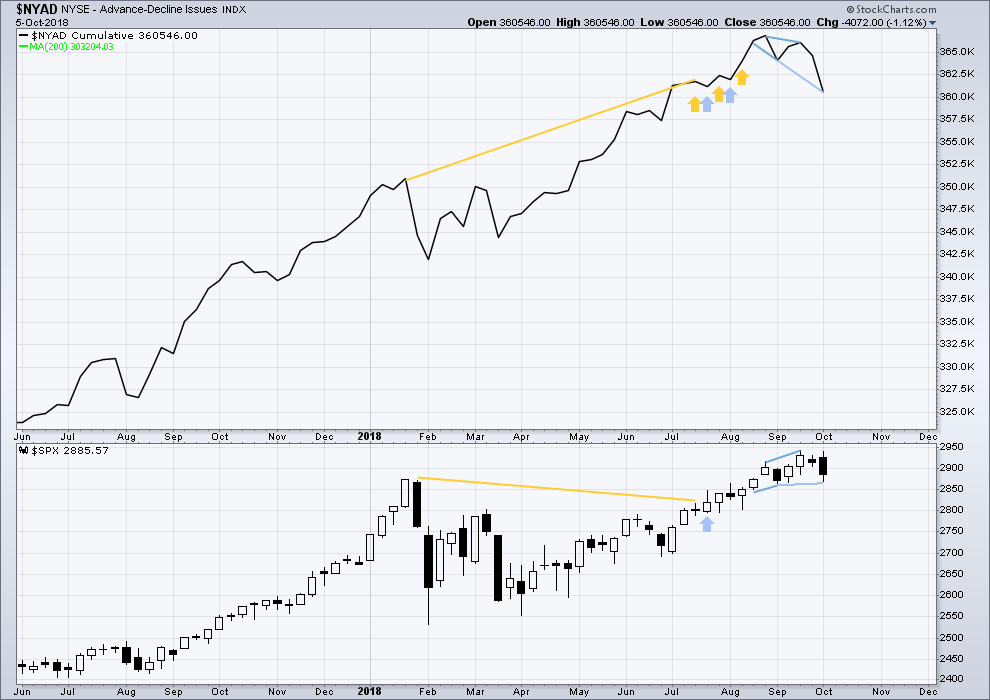
Click chart to enlarge. Chart courtesy of StockCharts.com.
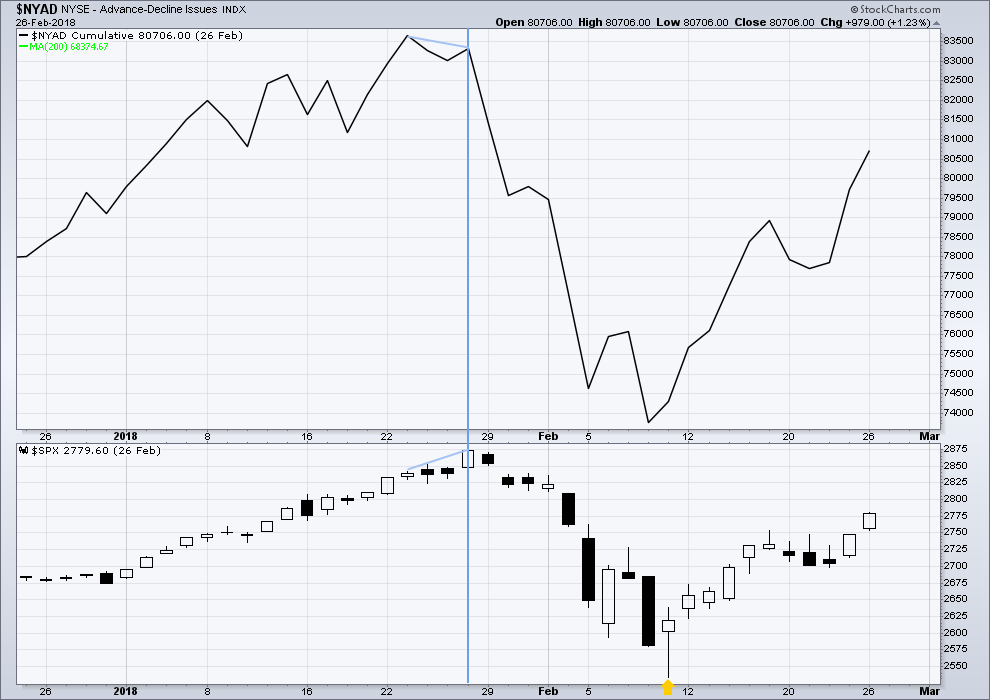
When primary wave 3 comes to an end, it may be valuable to watch the AD line at the weekly time frame as well as the daily.
There is now triple bearish divergence between price and the AD line. The AD line this week has made a new strong swing low, but price has not. This offers reasonable support now to the alternate Elliott wave count.
DAILY CHART
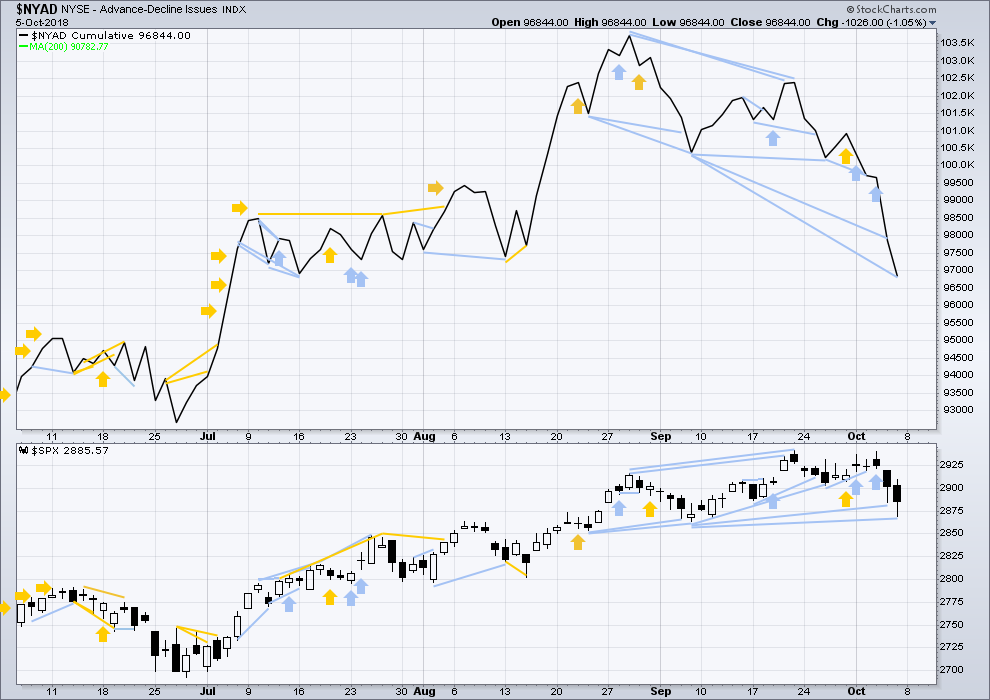
Click chart to enlarge. Chart courtesy of StockCharts.com.
There is normally 4-6 months divergence between price and market breadth prior to a full fledged bear market. This has been so for all major bear markets within the last 90 odd years. With no longer term divergence yet at this point, any decline in price should be expected to be a pullback within an ongoing bull market and not necessarily the start of a bear market. New all time highs from the AD line on the 29th of August means that the beginning of any bear market may be at the end of December 2018, but it may of course be a lot longer than that. My next expectation for the end of this bull market may now be October 2019.
Breadth should be read as a leading indicator.
There is now for two sessions in a row strong bearish divergence between price and the AD line.
There is now a cluster of bearish signals at the daily chart from the AD line; this offers now some reasonable support to the alternate Elliott wave count.
Both small and mid caps are making strong new lows below their respective last swing lows. Large caps may be lagging; they may catch up next week.
DOW THEORY
The following lows need to be exceeded for Dow Theory to confirm the end of the bull market and a change to a bear market:
DJIA: 23,360.29.
DJT: 9,806.79.
S&P500: 2,532.69.
Nasdaq: 6,630.67.
All of DJIA, DJT, S&P500 and Nasdaq have made recent new all time highs. This provides Dow Theory confirmation that the bull market continues.
Charts showing each prior major swing low used for Dow Theory may be seen at the end of this analysis here.
ANALYSIS OF THE END OF INTERMEDIATE WAVE (3)
TECHNICAL ANALYSIS
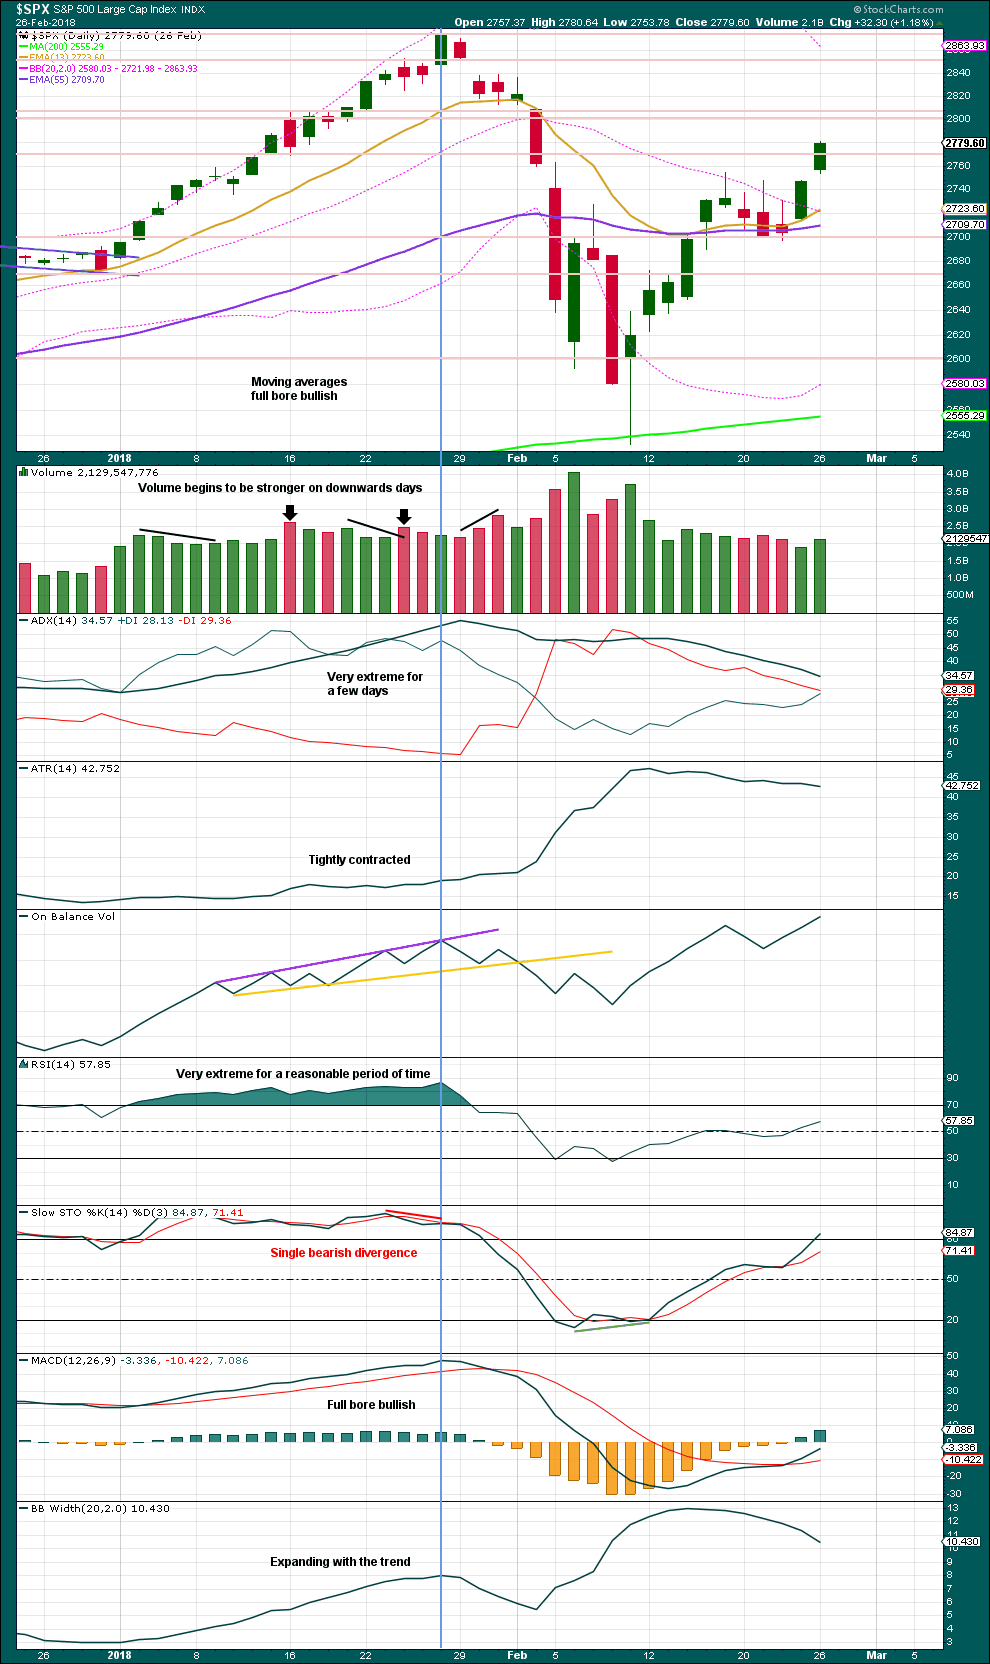
Click chart to enlarge. Chart courtesy of StockCharts.com.
This chart looked overly bullish at the end of intermediate wave (3). The only warning in hindsight may have been from volume spiking slightly on downwards days. There was no bearish divergence between price and either of RSI or On Balance Volume.
Single bearish divergence between price and Stochastics was weak, which is often an unreliable signal.
VIX
Click chart to enlarge. Chart courtesy of StockCharts.com.
This is a daily chart.
The strongest warning of an approaching intermediate degree correction at the daily chart level came from inverted VIX.
There was strong double bearish divergence at the high of intermediate wave (3), which is noted by the vertical line. There was also a sequence of five days of bearish divergence, days in which price moved higher but inverted VIX moved lower.
AD LINE
Click chart to enlarge. Chart courtesy of StockCharts.com.
This is a daily chart.
There was only single bearish divergence between price and the AD line at the end of intermediate wave (3). Approaching the high, there were no instances of price moving higher and the AD line moving lower.
Conclusion: When studying the behaviour of price and these indicators just before the start of intermediate wave (4), we may see some clues for warning us of primary wave 4. A cluster of bearish signals from VIX along with a bearish divergence from price and the AD line or On Balance Volume may warn of primary wave 4. The next instance will probably not behave the same as the last, but there may be similarities.
At this time, it does not look like primary wave 4 may begin right now, but we need to be aware of its approach.
Published @ 10:20 p.m. EST.
—
Careful risk management protects your trading account(s).
Follow my two Golden Rules:
1. Always trade with stops.
2. Risk only 1-5% of equity on any one trade.
I won’t fully switch to “bearish” however unless/until the intermediate 5 lower channel line is fully broken. It was just about perfectly tagged today…and reversed off of pretty strongly. I closed lots of shorts put on only tactical longs (out already). Cautiously watching to see how price behaves now.
I vote to bring Vern back…
I too like beer…a lot…
He’ll be back when he’s ready. I expect he is with his posse making lots of $ on this fall in price.
Lol I agree…thanks Lara. Good analysis BTW.
You can catch him here:
https://worldcyclesinstitute.com/danger-under-the-hood/
Thanks
RUT will both break it’s sharpest down trend line on the hourly and bearish symmetry (largest retrace move up during the entire sell off) at RUT > 1642.
There is now a lower low, this has not happened since April. That is why I am switching the main wave count to now see primary wave 4 in it’s very early stages.
A lower low indicates a potential trend change.
Any bounce at this stage may find resistance now at the lower edge of the blue channel.
I’m going to have Primary wave 4 as now the main wave count.
This will now be the alternate, but as Rodney quite rightly points out, it does remain valid.
So far the bullish side is winning/has won in this crux set up this morning. My call for a price and time for a low was right on on price…and about one day early. Not bad (if it holds).
Remember, 2864.12 is not a confirmation of the alternate count indicating Primary 3 is over. Rather, it is a “confidence” point that Primary 3 is over. Confirmation of the alternate count will only come when the Main Count is invalidated at 2742.10.
In my view this whole decline looks corrective . As Rodney said 2864.12 doesn’t validate nor invalidate either count. My view is that this is minor wave 4 and I and looking for a pullback to and area below 2864.12. The bear count came within 0.15 of a point of invalidating itself at the beginning of this decline which is a little concerning to me for a wave 2 retracement while I am aware it is possible. There was some mention that a move below 2864.12 would diminish its viability I disagree but that’s what makes markets. My downside targets are around 2859 and then the 2835 area. If the later is broken I would be more of the opinion that this is primary 4.IMHO
You’re very right. Thanks for the reminder Rodney…
2864 taken out! The question is will we get a bounce up before going further down?
I think a bounce then down it will go
If there’s another leg up in this market before the P4…there are a lot of buy set up’s in play. PANW an extremely strong tech stock is coming down to…somewhere. Maybe the 61.8% at 211, or maybe the cluster at 203-206. I also see the credit card co’s (which have been going straight up for years) in a nice pullback (V, MA). CRM also. Many…which isn’t to say buying’s going to be the correct thing, but we’ll see soon enough.
Haha, Kevin nice. I’m with you on this one. Puts spreads are nice on it too(not trading advice)
CVS weekly. A heck of a dog, overall.
On my list of short candidates, looking for a turn back down and sell triggers off either the 78.6% price is one, or the swing highs around 85 (and the major down trend line).
gap down, gap up (on the 5 min)…..
Interesting how the weekly candle is a bearish engulfing candle, but the last 2 daily candles (the biggest down days) both finished with long lower wicks.
There is still buying going on. If we get a massive 3-4% day down next week that would definitely be a game changer…
Have a great wknd everyone!
Leading up to the elections there are always possibilities for surprises. For example, the fed could decide to keep rates flat for a while to see what happens. The China trade war could go away like the Canadian dispute did. The democrats could be clear winners in congress and the market may not like that. Right now I think the Republicans are running out of upside bullets. Whatever they have they may use soon. If they look like clear losers then the republicans can step away from supporting the market. Lots of possibilities, hard to navigate but that is what makes it exciting , right?
I’m going to approach this from a pure EW point of view.
The wave count is primary, and what the Fed or politicians do is influenced by the wave count (as an expression of social mood). Not the other way around.
And so a pure EW view says that the Fed, elections, politicians and pundits do not influence what the markets do.
If primary wave 4 has arrived then social mood should be deteriorating. And so negative social results may ensue.
I know this is a really unpopular view, and that’s okay. But that’s the EW view.
That’s the way it is.
Trading via EW is often difficult but as a barometer of market analysis and/or social mood,there’s nothing better.
So what we are really wave counting is the ongoing cycling of “sentiment”. And the markets are just barometers of sentiment, and news arrives as required to support the shifting sentiment. I buy that, generally.
All my attention is on 2864.
Price on Friday bounced perfectly off a 1.27 at 2869. The sell off trend line and the intermediate 5 channel line meet Tuesday…right at 2864. Surprise surprise.
I suspect the market firms here if not immediately (ala the swing low in August) then over several days (ala the swing low in June), and new highs are reached before the P4 begins.
But my “sentiment” changes instantly at SPX < 2864!!!