
Downwards movement remains above the invalidation point for the main Elliott wave count and above the last swing low on the daily chart. Two Elliott wave counts remain valid.
Summary: At this stage, it would be best to let price tell us if primary wave 3 is over or not.
While price remains above 2,864.12, then this may still be another pullback within an ongoing upwards trend. The target is now at 3,012. Downwards movement today may present another opportunity to join the trend; risk is at 2,864.12.
If price makes a new low by any amount at any time frame below 2,864.12, then some confidence that primary wave 4 has begun may be had. Targets are either 2,716.89 or 2,578.30. There is now enough bearishness from the AD line to take this possibility fairly seriously. Primary wave 4 is expected to be a large choppy consolidation, which may last about a Fibonacci 13 weeks.
The final target for this bull market to end remains at 3,616, which may be met in October 2019.
New updates to this analysis are in bold.
The biggest picture, Grand Super Cycle analysis, is here.
Last historic analysis with monthly charts is here, video is here.
MAIN ELLIOTT WAVE COUNT
WEEKLY CHART
Click chart to enlarge.
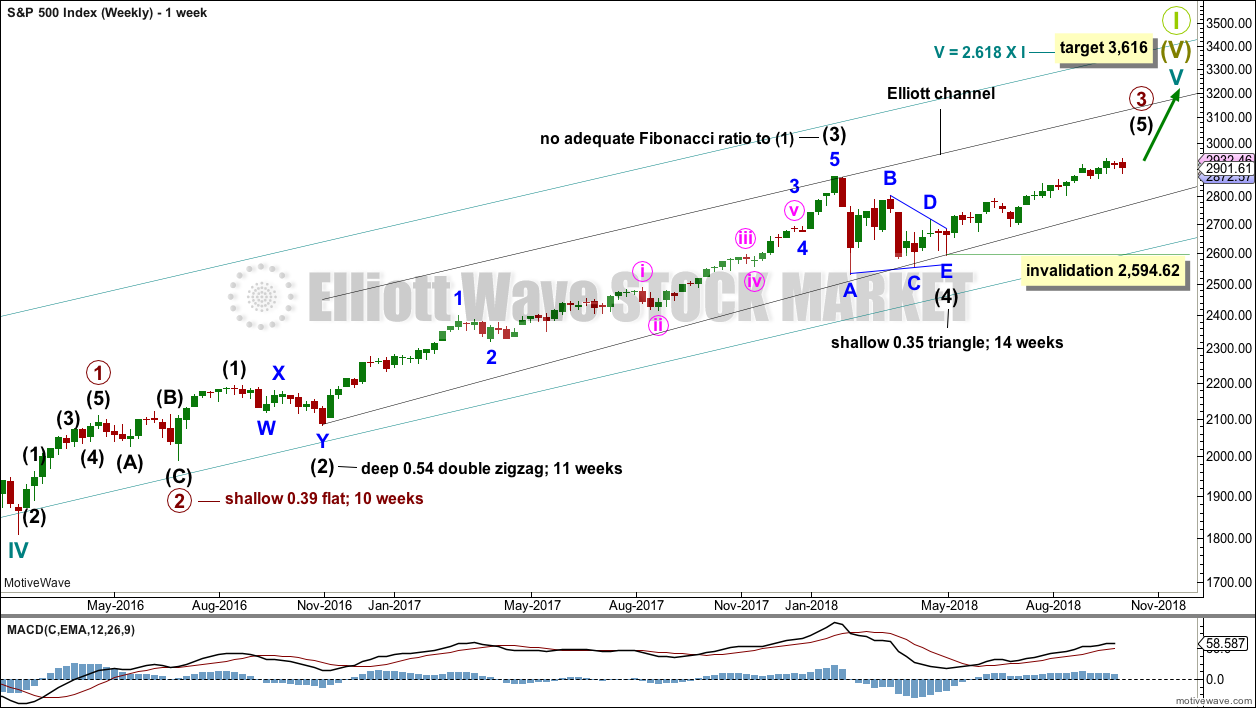
Cycle wave V must complete as a five structure, which should look clear at the weekly chart level and also now at the monthly chart level. It may only be an impulse or ending diagonal. At this stage, it is clear it is an impulse.
Within cycle wave V, the third waves at all degrees may only subdivide as impulses.
Intermediate wave (4) has breached an Elliott channel drawn using Elliott’s first technique. The channel is redrawn using Elliott’s second technique: the first trend line from the ends of intermediate waves (2) to (4), then a parallel copy on the end of intermediate wave (3). Intermediate wave (5) may end either midway within the channel, or about the upper edge.
There is perfect alternation and excellent proportion between intermediate waves (2) and (4).
At this stage, the expectation is for the final target to me met in October 2019. If price gets up to this target and either the structure is incomplete or price keeps rising through it, then a new higher target would be calculated.
DAILY CHART
Click chart to enlarge.
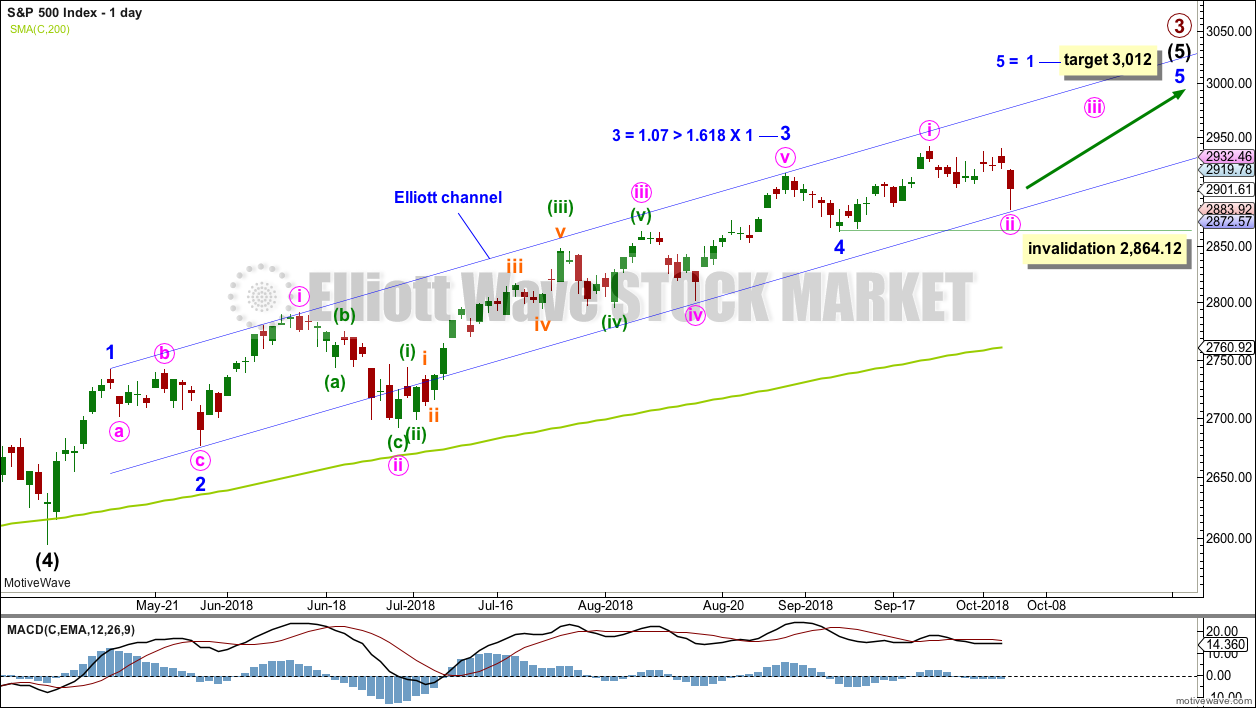
Intermediate wave (5) avoided a truncation now that it has a new high above the end of intermediate wave (3) at 2,872.87.
Intermediate wave (3) exhibits no Fibonacci ratio to intermediate wave (1). It is more likely then that intermediate wave (5) may exhibit a Fibonacci ratio to either of intermediate waves (1) or (3). Intermediate wave (5) has passed equality in length and 1.618 the length of intermediate wave (1). The next Fibonacci ratio in the sequence is 2.618 giving a target at 3,124. If the target at 3,012 is met and passed, then this would be the next calculated target.
A target for intermediate wave (5) to end is calculated at minor degree.
Intermediate wave (5) is unfolding as an impulse, and within it minor waves 1 through to 4 may now all be complete.
Within intermediate wave (5), minor wave 3 was extended. Minor wave 5 may also extend.
Minute wave ii may not move beyond the start of minute wave i below 2,864.12. Minute wave ii today has found strong support about the lower edge of the Elliott channel. This is some small indication that this wave count may be correct.
HOURLY CHART
Click chart to enlarge.
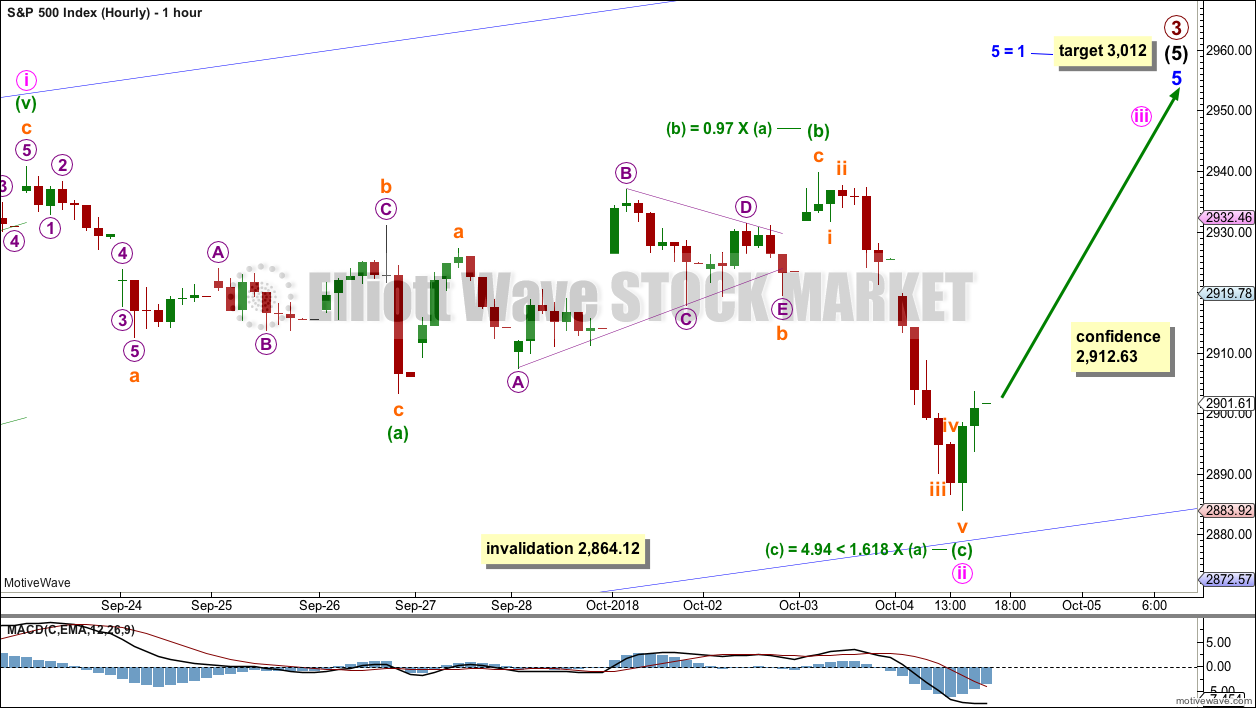
Minute wave ii may now be a complete flat correction; this would be a regular flat because minuette wave (b) is longer than 0.9 the length of minuette wave (a) but less than 1.05 the length of minuette wave (a).
There is an adequate Fibonacci ratio between minuette waves (a) and (c).
It remains possible that minuette wave (c) may continue lower.
Minute wave ii may not move beyond the start of minute wave i below 2,864.12.
ALTERNATE ELLIOTT WAVE COUNT
DAILY CHART
Click chart to enlarge.
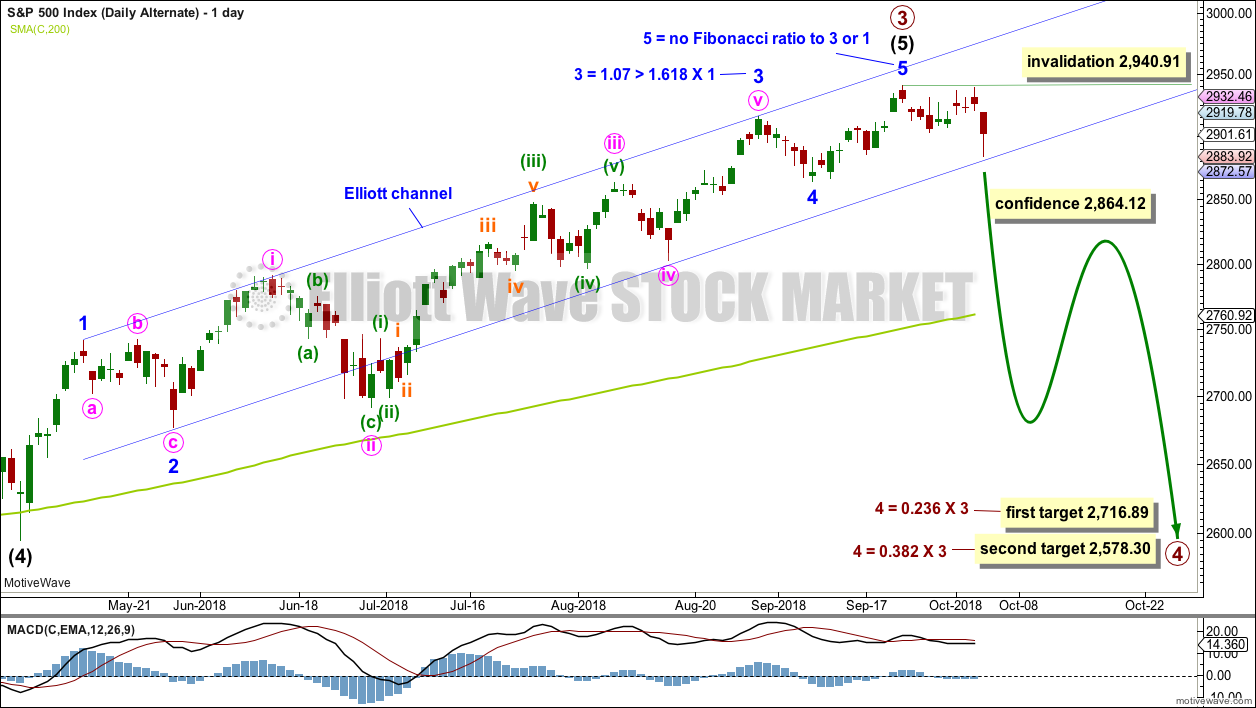
It is possible to see now that primary wave 3 could be over at the last high by simply moving the degree of labelling within minor wave 5 up one degree.
It is reasonably common for the S&P to exhibit a Fibonacci ratio between two actionary waves within an impulse, and uncommon for it to exhibit Fibonacci ratios between all three actionary waves within an impulse. The lack of a Fibonacci ratio for minor wave 5 within this wave count is not of any concern; this looks typical.
Primary wave 4 would most likely end somewhere within the price territory of the fourth wave of one lesser degree. Intermediate wave (4) has its price territory from 2,872.87 to 2,532.69. Within this range sit two Fibonacci ratios giving two targets. The lower 0.382 Fibonacci ratio may be more likely.
Primary wave 2 unfolded as a shallow regular flat correction lasting 10 weeks. Primary wave 4 may exhibit alternation in structure and may most likely unfold as a zigzag, triangle or combination. A zigzag would be the most likely structure as these are the most common corrective structures and would provide the best alternation with primary wave 2.
Primary wave 4 may not move into primary wave 1 price territory below 2,111.05. However, the lows in primary wave 4 should not get close to this point. The lower edge of the teal channel on the weekly chart should provide very strong support.
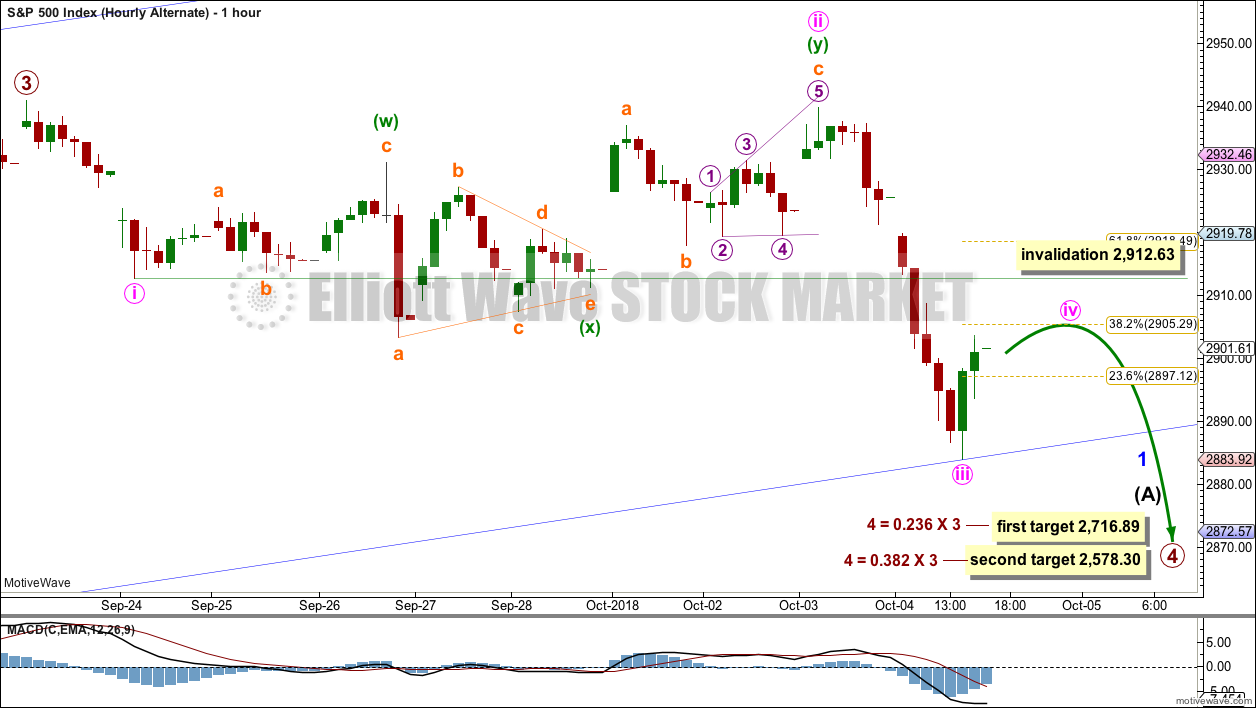
HOURLY CHART
Click chart to enlarge.
A movement at primary wave degree should begin with a five wave structure downwards. So far that would be incomplete.
The first five down may be labelled minor wave 1. So far minute waves i through to iii may now be complete. There is no Fibonacci ratio between minute waves i and iii, but minute wave iii is longer than 1.618 the length of minute wave i.
Minute wave iii has shown a strong increase in downwards momentum.
Minute wave iv may now unfold sideways over a few days as a shallow correction, most likely ending about the 0.382 Fiboancci ratio. Minute wave iv may exhibit alternation with the combination of minute wave ii as a zigzag or triangle.
Minute wave iv may not move into minute wave i price territory above 2,912.63.
If this invalidation point is breached, then it would also be possible that minute wave iii may be incomplete. Within minute wave iii, no second wave correction may move beyond the start of its first wave above 2,939.86. Only a new high above this point would fully invalidate the bearish wave count at this stage.
TECHNICAL ANALYSIS
WEEKLY CHART
Click chart to enlarge. Chart courtesy of StockCharts.com.
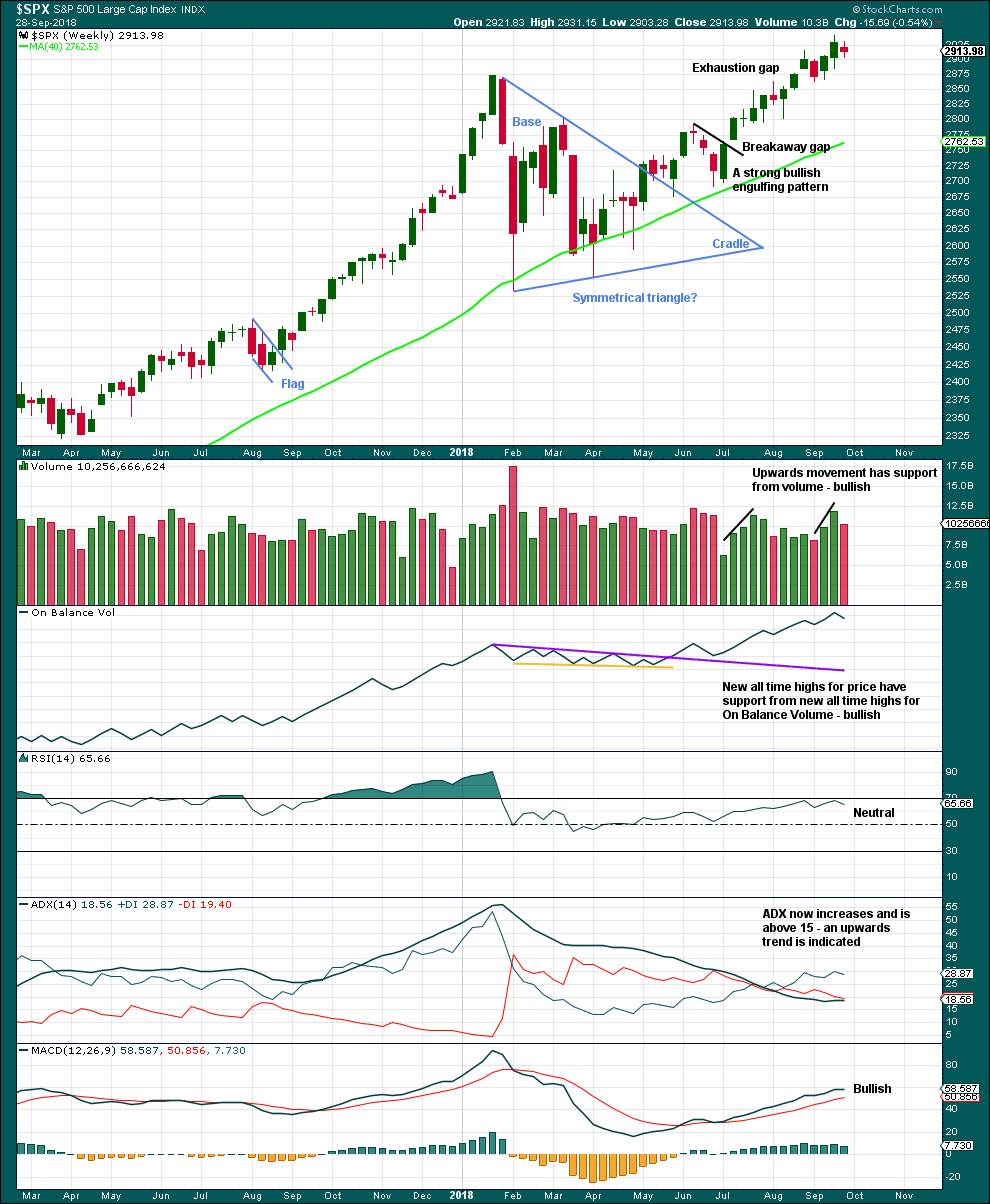
The symmetrical triangle base distance is 340.18. Added to the breakout point of 2,704.54 this gives a target at 3,044.72. This target has not yet been met.
Last week completed an inside week with the balance of volume downwards and the candlestick closing red. Downwards movement within last week does not have support from volume. At this time frame, this week looks like a small pause within an ongoing upwards trend.
DAILY CHART
Click chart to enlarge. Chart courtesy of StockCharts.com.
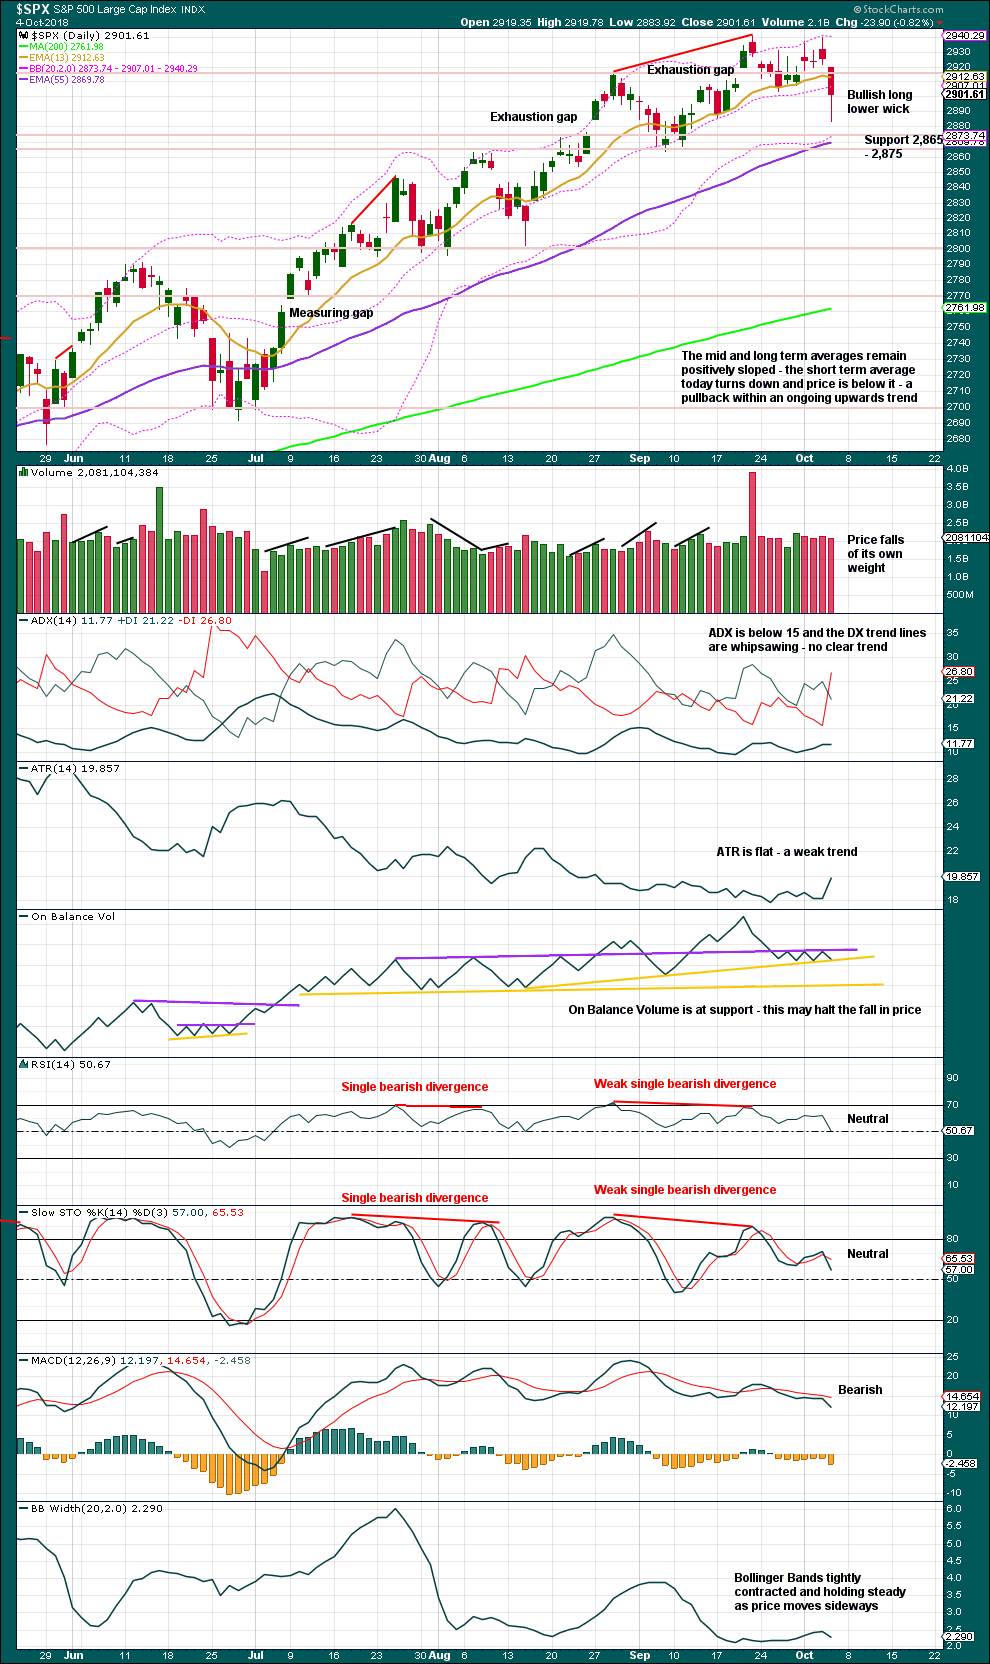
Closure of the last gap is bearish. The gap is now labelled an exhaustion gap.
Next support is strong at about 2,865 – 2,875. Today price is above this support zone, and On Balance Volume is at support. So far this still looks like a pullback within an ongoing upwards trend, which may be used as an opportunity to join the trend. Risk is at 2,864.12.
The bottom line remains that an upwards trend remains intact until price makes a new swing low. Look now for strong support about 2,875 – 2,865. If price makes a new swing low below 2,864.12, that would indicate a change from an upwards trend to either a larger sideways consolidation or a new downwards trend.
VOLATILITY – INVERTED VIX CHART
WEEKLY CHART
Click chart to enlarge. Chart courtesy of StockCharts.com. So that colour blind members are included, bearish signals
will be noted with blue and bullish signals with yellow.
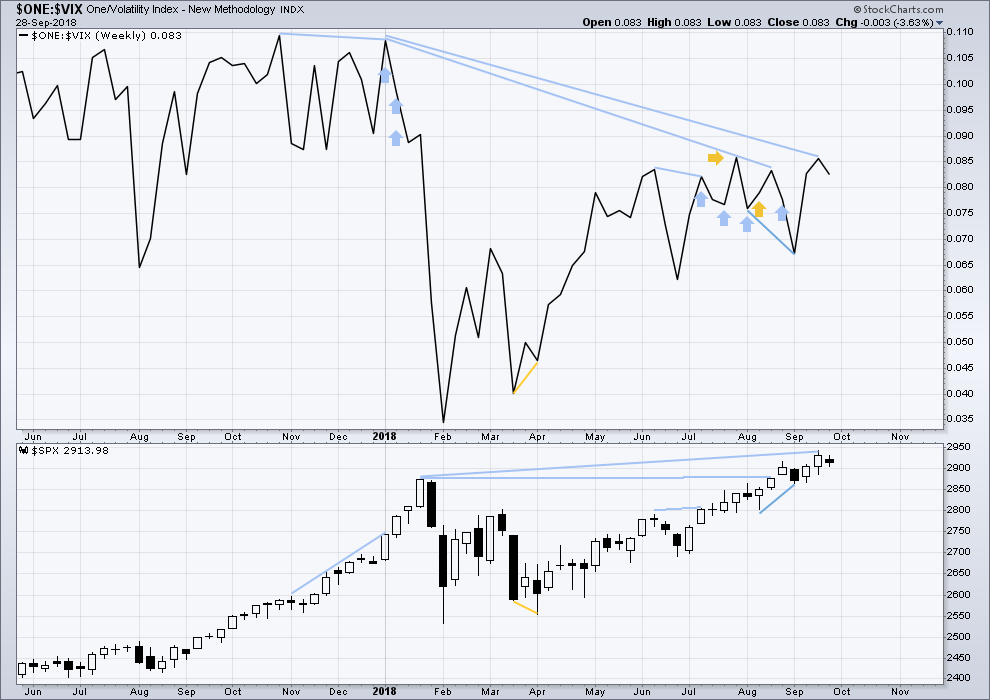
To keep an eye on the all time high for inverted VIX a weekly chart is required at this time.
Notice how inverted VIX has very strong bearish signals four weeks in a row just before the start of the last large fall in price. At the weekly chart level, this indicator may be useful again in warning of the end of primary wave 3.
At this time, there is mid term bearish divergence between price and inverted VIX: price has made another new all time high, but inverted VIX has not. This divergence may persist for some time. It may remain at the end of primary wave 3, and may develop further to the end of primary wave 5.
Downwards movement within last week has support from a normal increase in market volatility. There is no new short term divergence.
DAILY CHART
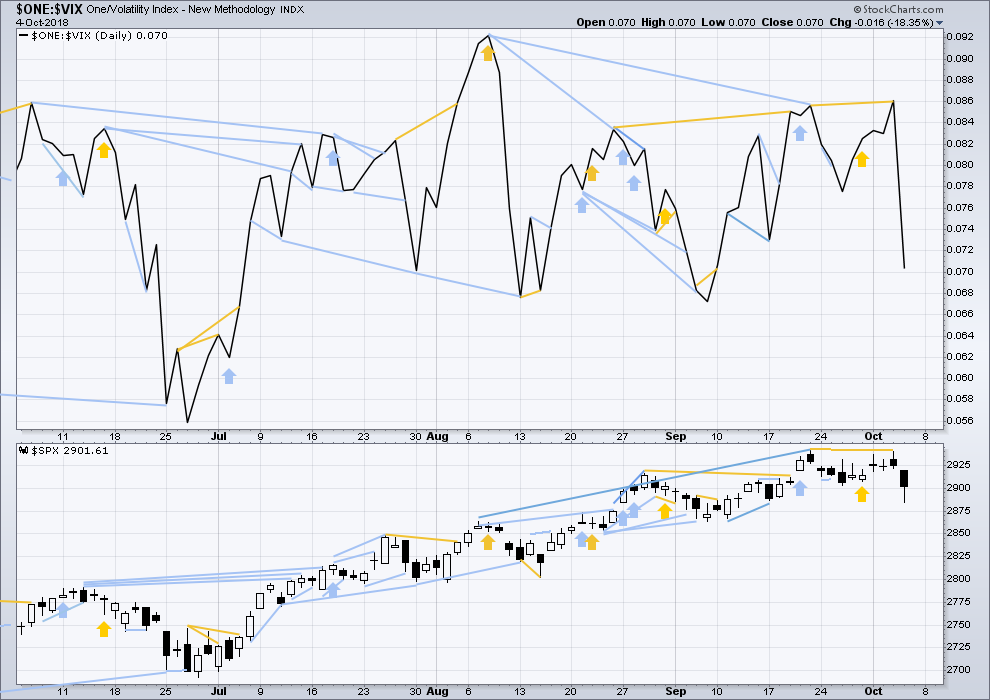
Click chart to enlarge. Chart courtesy of StockCharts.com. So that colour blind members are included, bearish signals
will be noted with blue and bullish signals with yellow.
Normally, volatility should decline as price moves higher and increase as price moves lower. This means that normally inverted VIX should move in the same direction as price.
There is mid term divergence with a new all time high from price not supported by a corresponding new all time high from inverted VIX. This divergence is bearish.
Short term weak bullish divergence noted in last analysis has not been followed by any upwards movement, so it is considered to have failed.
Both price and inverted VIX have moved strongly lower today. Both have made new lows below the prior low of the 17th of September; there is no divergence.
Mid term bearish divergence between price and inverted VIX can be seen on both daily and weekly charts now. However, this may not be a good timing tool in identifying the end of primary wave 3; divergence may develop further before primary wave 3 ends.
BREADTH – AD LINE
WEEKLY CHART
Click chart to enlarge. Chart courtesy of StockCharts.com.
When primary wave 3 comes to an end, it may be valuable to watch the AD line at the weekly time frame as well as the daily.
There is still short term bearish divergence at the weekly chart level between price and the AD line. It is possible now that the end of primary wave 3 is quite close.
For the last completed week, price moved sideways. Downwards movement within the week has support from an increase in breadth.
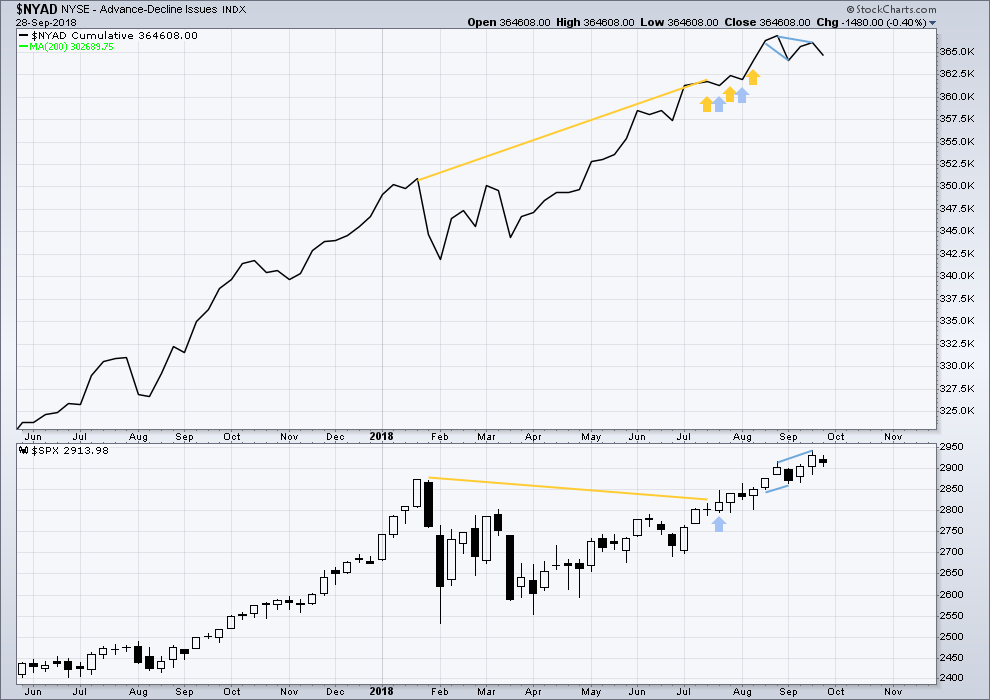
DAILY CHART
Click chart to enlarge. Chart courtesy of StockCharts.com.
There is normally 4-6 months divergence between price and market breadth prior to a full fledged bear market. This has been so for all major bear markets within the last 90 odd years. With no longer term divergence yet at this point, any decline in price should be expected to be a pullback within an ongoing bull market and not necessarily the start of a bear market. New all time highs from the AD line on the 29th of August means that the beginning of any bear market may be at the end of December 2018, but it may of course be a lot longer than that. My next expectation for the end of this bull market may now be October 2019.
Breadth should be read as a leading indicator.
Bearish divergence has been followed now by some downwards movement. Today the AD line has made a strong new low below the prior low of the 7th of September, but price has not. This divergence is bearish; it is strong, and it supports the alternate Elliott wave count.
There is now a cluster of bearish signals at the daily chart from the AD line; this offers now some reasonable support to the new alternate Elliott wave count.
Small and mid caps made new all time highs on the 27th of August. Large caps made another new all time high on the 21st of September, but small and mid caps did not. Small caps have now made a new swing low, so they may be leading the market at this time.
DOW THEORY
The following lows need to be exceeded for Dow Theory to confirm the end of the bull market and a change to a bear market:
DJIA: 23,360.29.
DJT: 9,806.79.
S&P500: 2,532.69.
Nasdaq: 6,630.67.
All of DJIA, DJT, S&P500 and Nasdaq have made recent new all time highs. This provides Dow Theory confirmation that the bull market continues.
Charts showing each prior major swing low used for Dow Theory may be seen at the end of this analysis here.
ANALYSIS OF THE END OF INTERMEDIATE WAVE (3)
TECHNICAL ANALYSIS
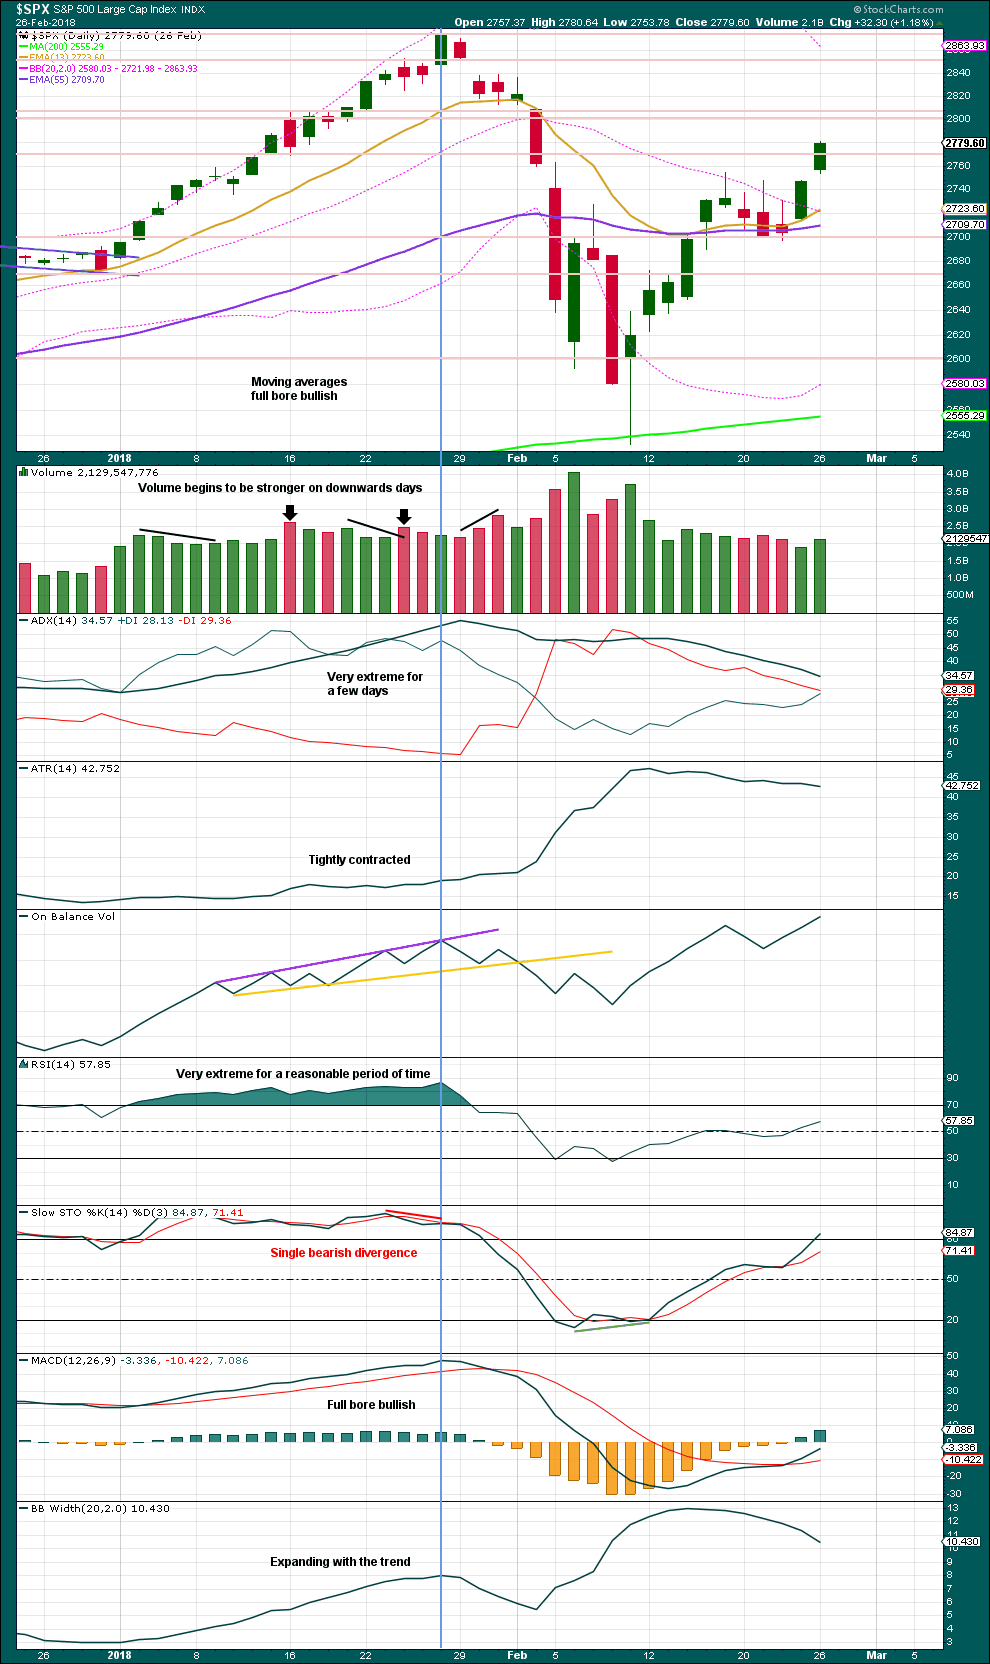
Click chart to enlarge. Chart courtesy of StockCharts.com.
This chart looked overly bullish at the end of intermediate wave (3). The only warning in hindsight may have been from volume spiking slightly on downwards days. There was no bearish divergence between price and either of RSI or On Balance Volume.
Single bearish divergence between price and Stochastics was weak, which is often an unreliable signal.
VIX
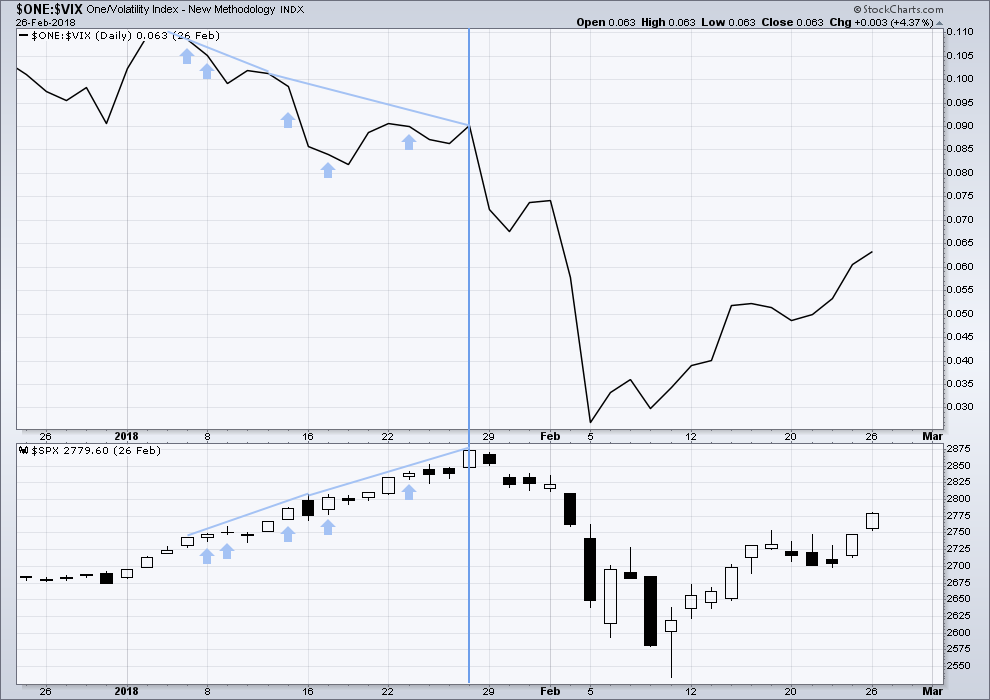
Click chart to enlarge. Chart courtesy of StockCharts.com.
This is a daily chart.
The strongest warning of an approaching intermediate degree correction at the daily chart level came from inverted VIX.
There was strong double bearish divergence at the high of intermediate wave (3), which is noted by the vertical line. There was also a sequence of five days of bearish divergence, days in which price moved higher but inverted VIX moved lower.
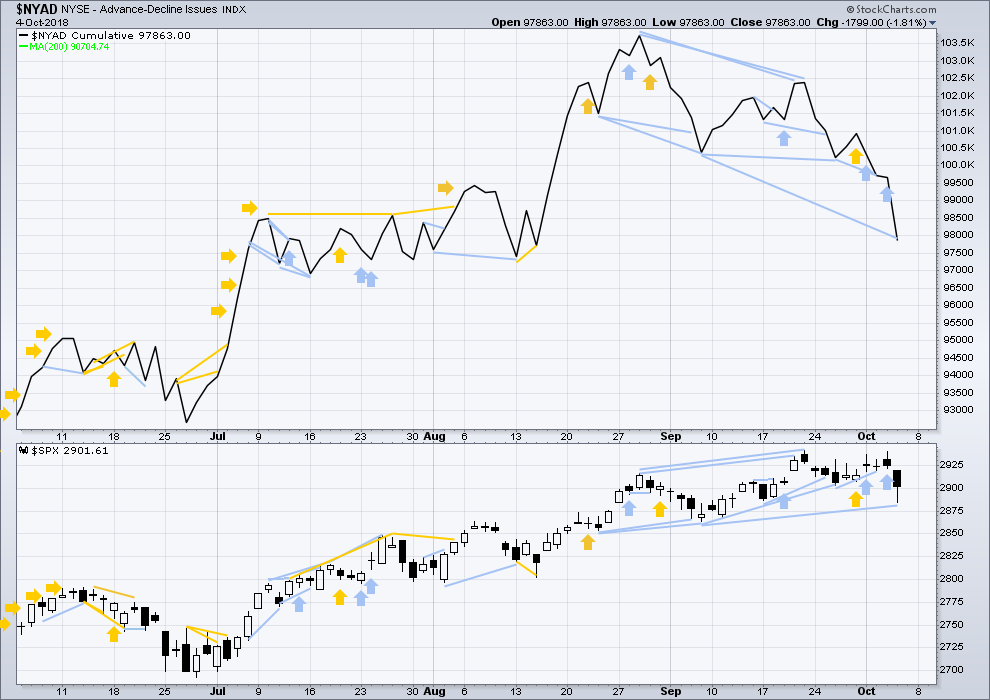
AD LINE
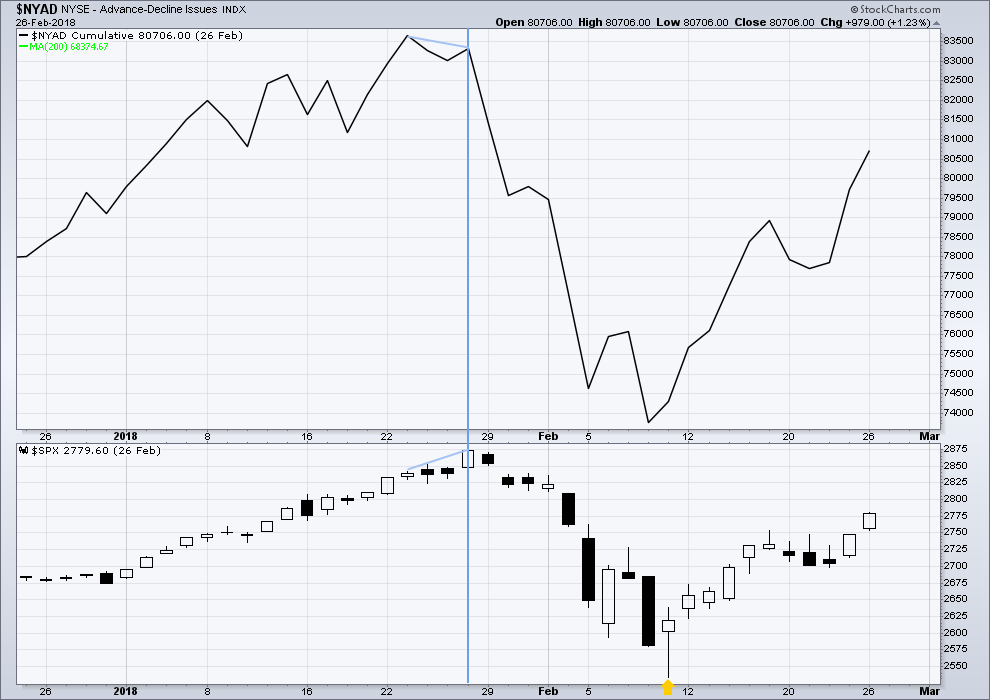
Click chart to enlarge. Chart courtesy of StockCharts.com.
This is a daily chart.
There was only single bearish divergence between price and the AD line at the end of intermediate wave (3). Approaching the high, there were no instances of price moving higher and the AD line moving lower.
Conclusion: When studying the behaviour of price and these indicators just before the start of intermediate wave (4), we may see some clues for warning us of primary wave 4. A cluster of bearish signals from VIX along with a bearish divergence from price and the AD line or On Balance Volume may warn of primary wave 4. The next instance will probably not behave the same as the last, but there may be similarities.
At this time, it does not look like primary wave 4 may begin right now, but we need to be aware of its approach.
Published @ 09:08 p.m. EST.
—
Careful risk management protects your trading account(s).
Follow my two Golden Rules:
1. Always trade with stops.
2. Risk only 1-5% of equity on any one trade.
Lara
Do you think we may see a test of 2864. If that is the case like you mentioned any time frame below 2864 then the trend has changed ?
Do we need to close below 2864 or just break 2864 price handle.
Thankyou again
I’m actually expecting a new low below 2,864.12 on Monday as pretty likely.
If it doesn’t happen Monday, then it should happen next week.
Any amount by any time frame at all below 2,864.12 is enough to make me switch to seeing the bearish wave count as a new main. That’s because the old wave count which saw this pullback as a second wave correction would then be invalidated. And I’d be left only with seeing it as a fourth wave, as I have it for the main wave count in end of week analysis. And as you can see there the Fibonacci ratios just aren’t as good and there’s a problem in how the middle of the third wave unfolds.
Slightly confusing, but I hope this makes sense? If you want anything clarified please do ask in comments on the next post. Cheers!
Hi Lara.
I hope your having a great weekend. Thankyou again for your insight.
I’m still trying to get my brain into thinking social mood and not what governments do into driving the markets.
Keep up the great work
Updated alternate hourly wave count:
Today this is starting to look more likely. Price has now breached the blue Elliott channel.
If minute iii is over then it is now 3.47 points short of 2.618 X minute wave i. That’s fairly good.
Now for minute iv to unfold. If this exhibits commodity like behaviour then minute iv could be more brief than minute i.
For clarification we are headed higher or lower?
I think lower. But what would I know
Retrace to about 2896 and then resume down. A little more up then continue p4 down.
Thanks… Sometimes the comments are a challenge to decipher…
I need end of session and end of week data to answer that question.
There is now a bearish signal from On Balance Volume, it’s now broken below support on the daily chart.
I expect the alternate may now actually be correct. I suspect price may now head lower next week.
very clean 5 up off the bottom
Hope everyone profitably traded the move out of the triangle.
Gotta love ’em!
Have a great weekend everyone! 🙂
Hi Lara and Kevin
What kind of odds do you give this alternative wave count?
Thank You
I’m now giving it about 55%.
A new low below 2,864.12 would see me increase that to about 80%
Actually, the AD line has another reasonable bearish divergence.
I would increase the probability of the alternate now to over 60%.
But 2,864.12 remains important; we need a new low below this point for the trend to have clearly changed.
Until then, there is still a series of higher highs and higher lows. And the risk to calling P4 here is that this pullback may be just another correction within an ongoing upwards trend, and P3 may be exhibiting increasing signs of weakness as it comes to an end.
I do hope that makes sense. And I do hope that you all understand the logic and approach based upon probability.
We are either in Minor 2 or minute III, either way it’s up for now.
BLUE is in a long set up (but no buy triggers yet). The monthly trend is up, the weekly is neutral, and the daily is back to neutral. Several days of squeeze, price sitting for weeks on top of a big 50% retrace level. Hourly now in a squeeze too; no real sell off today, just more ranging. When BLUE goes (up or down)…it’s moves, price volatility is extremely high (check finviz). Not for the faint of heart, be careful to size appropriate;y for your risk tolerance!
Any idea where we may close guys in the sp500. Mr Novice
this guy has no clue. my question is more basic: will the day’s low hold, or do we get a deeper sell off over the next 70 minutes?
A deeper sell off MR Market would be greatly appreciated….but that does not count for much
im good here, 3000 here I come!
maybe ill ask Lara to change my name to Mr 3000
Banksters have been running through the algos the passed few hours.
RUT has a perfect hit and turn on the daily chart off the 200 day ma at 1618.14. And the length of this retrace in the bull trend is almost exactly the length of a similar swing a few months back (and still far from the largest such swing).
30 Year US Treasury now at a 3.412% Yield….
This may signal that 4.00% is on the horizon in the coming months… but the acceleration higher has not been with the force I was looking for so this may just be a false breakout. Should have a better idea by middle of next week.
BTW… I don’t think this will be good for stock prices if this breakout is real. So it may confirm end of P 3 and that primary wave 4 has begun . In the old days… Pre 2008 this would be the case. now ???
Elliot channel penetrated…
SPX in c of abc down and is headed toward that 2864 invalidation level, right where the intermediate 5 lower channel line is. Assuming it breaks the overlapped retrace fibos at 2880.
if a = c that should put us well under 2864, Lara’s invalidation point.
That being said it looks like we may have finished or are close to a 5 wave move down now, from 2910 or so.
I can count down to end between 2864.5-2869.5
There’s a 1.27% at 2869. A turn there has significant potential to hold imo.
took a small bite long
So did I and I’ve already cashed. Of course that was my plan and I even used options expiring today to get leverage and keep my cash exposure really small. I’d say “nailing a turn” is a matter of what is your time frame and when do you sell. I nailed this one for my purposes…even though it may get exceeded any moment now.
nice scalp.!
I also bought a bit OOM Oct 19 expiry SPY calls working more the hourly/daily tf, looking for a leg up through most of next week. BE stop on those now. And I hold a Dec put spread on SPX down 2830-2805 to catch some P4 action, sooner or later. I may be adding to that as we go here…
I wonder if this is C down or it is 1 of (3) down (forgive my labeling). Lara stated that the QQQ’s and IWM have already started there correction, so I think there is a possibility that this is 2 of (3) down.
i’ll be honest, i have never nailed a turn exactly
NDX has just about completed its double top (i.e., price has fallen very close to the low between the two peaks). The “neckline” is about 7400. If price falls below that, the measuring rule indicates that price will drop to just about 7100.
In which case we can all sing, “Goodniiiiiight, Ireeeeeeene!!!!”.
I consider this market pretty close to “at the cusp”, once again. The remainder of today and Monday should be “fascinating”.
LUV a very viable short. Over bought, turning back down off a 78.6% derived retrace level on the weekly/daily, and in a MASSIVE daily squeeze with momentum dropping. It “should” fall out of it’s current low volatility range.
Other good short set ups with some similar properties: IYT, MDT, XOM, QCOM.
Is it possible that this is Minor wave 4? The retracement of Minor wave 4 labeled as Lara has it seems very shallow in terms of proportion just a thought not claiming to be right what do you guys think?
Looks reasonable and interesting to me, I do want to hear Lara’s assessment. Nice work!
Also assuming that the SPX pulls back to the 23.6% retracement that would set up a 1:1 ratio of Minor wave 1 and 5 that should end at her original target of the 3012 area
One other thing that is interesting is with this labeling all the previous 4th wave pullbacks were either a 23.6% or 38.3% retracement.
That’s possible. But I’d have to check the subdivisions of the middle of the third wave on the hourly chart. That looks a bit problematic.
I am missing something, the a/d line made a strong new low below the sept 7 and price has not.is that bullish or bearish? Thanks
Sorry everybody, it’s bearish. My mistake. Fixed now.
Quite bearish actually.
Thanks Robert.
Thanks
Lara, you mentioned that 2864 is the point we can have confidence in the correction taken hold. Do any of the other markets like the QQQ’s or IWM broken down into this correction area already. They may give us fair warning of what will happen with the SPX.
Thanks.
I’d be looking at DJIA, DJT and Nasdaq.
DJT and Nasdaq have both made new swing lows, but DJIA has not.
DJIA has an Evening Doji Star now at the high.
And so if DJT is leading and DJIA now has a reversal pattern, that would tend to support the alternate wave count.
1.0