
Signals from the AD line and VIX at this time are in conflict. On Balance Volume may give a signal tomorrow indicating which of two Elliott wave counts is most likely.
Summary: At this stage, it would be best to let price tell us if primary wave 3 is over or not.
While price remains above 2,864.12, then this may still be another pullback within an ongoing upwards trend. The target is now at 3,012.
If price makes a new low by any amount at any time frame below 2,864.12, then some confidence that primary wave 4 has begun may be had. Targets are either 2,716.89 or 2,578.30. There is now enough bearishness from the AD line to take this possibility fairly seriously. Primary wave 4 is expected to be a large choppy consolidation, which may last about a Fibonacci 13 weeks.
The final target for this bull market to end remains at 3,616, which may be met in October 2019.
New updates to this analysis are in bold.
The biggest picture, Grand Super Cycle analysis, is here.
Last historic analysis with monthly charts is here, video is here.
MAIN ELLIOTT WAVE COUNT
WEEKLY CHART
Click chart to enlarge.
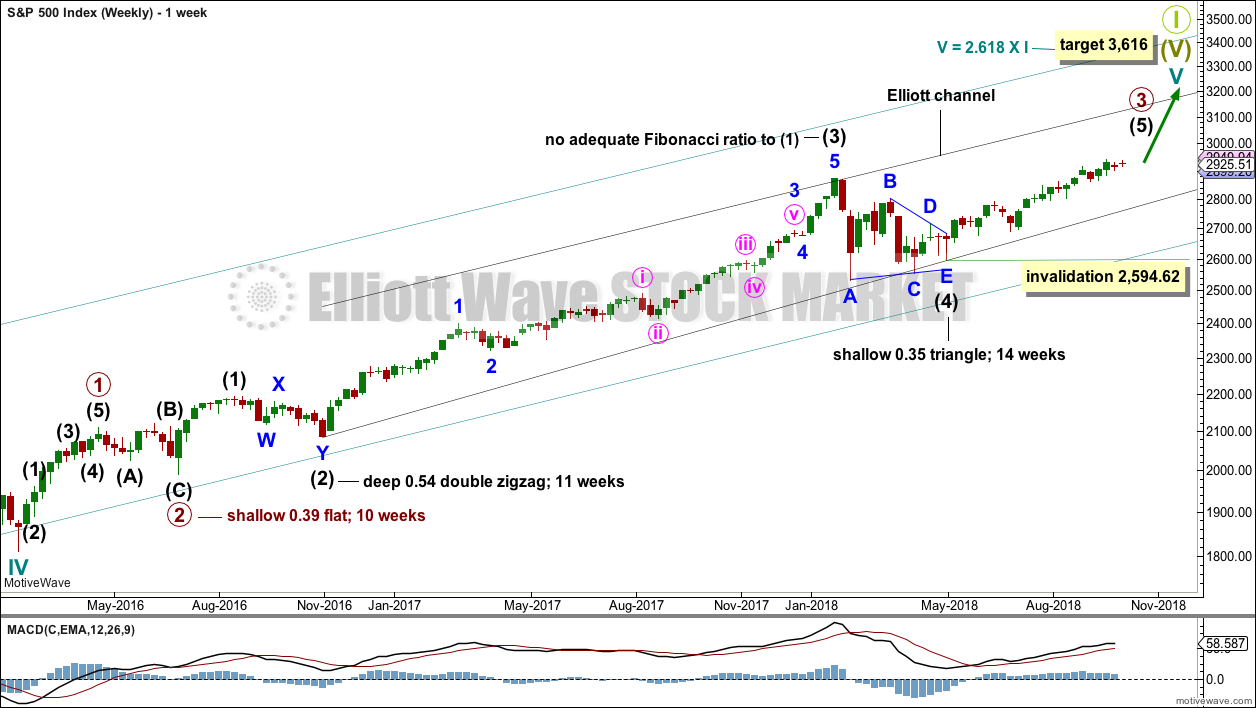
Cycle wave V must complete as a five structure, which should look clear at the weekly chart level and also now at the monthly chart level. It may only be an impulse or ending diagonal. At this stage, it is clear it is an impulse.
Within cycle wave V, the third waves at all degrees may only subdivide as impulses.
Intermediate wave (4) has breached an Elliott channel drawn using Elliott’s first technique. The channel is redrawn using Elliott’s second technique: the first trend line from the ends of intermediate waves (2) to (4), then a parallel copy on the end of intermediate wave (3). Intermediate wave (5) may end either midway within the channel, or about the upper edge.
There is perfect alternation and excellent proportion between intermediate waves (2) and (4).
At this stage, the expectation is for the final target to me met in October 2019. If price gets up to this target and either the structure is incomplete or price keeps rising through it, then a new higher target would be calculated.
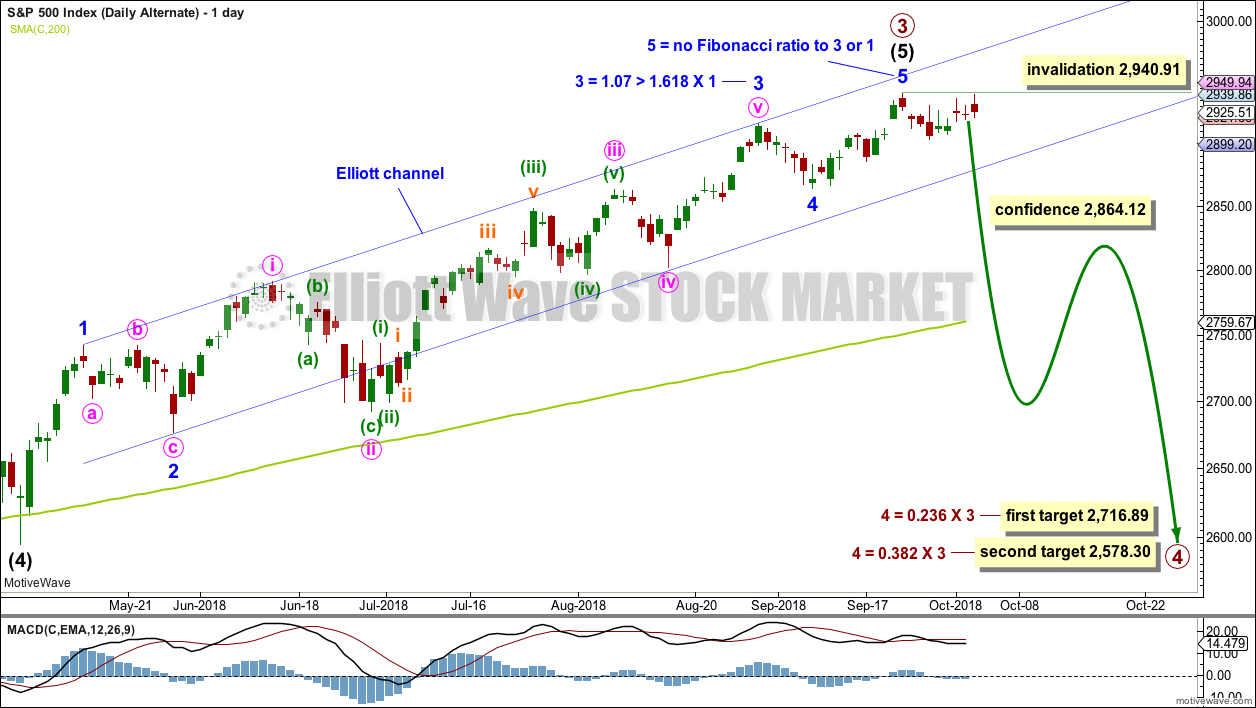
DAILY CHART
Click chart to enlarge.
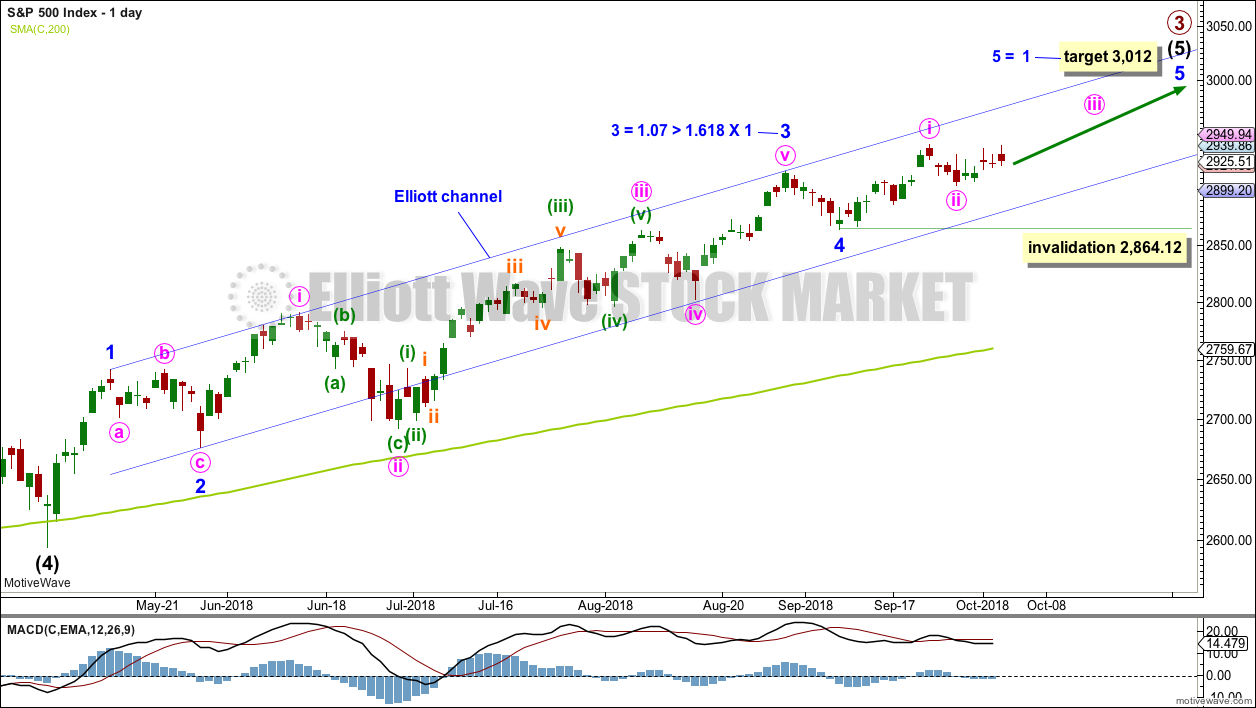
Intermediate wave (5) avoided a truncation now that it has a new high above the end of intermediate wave (3) at 2,872.87.
Intermediate wave (3) exhibits no Fibonacci ratio to intermediate wave (1). It is more likely then that intermediate wave (5) may exhibit a Fibonacci ratio to either of intermediate waves (1) or (3). Intermediate wave (5) has passed equality in length and 1.618 the length of intermediate wave (1). The next Fibonacci ratio in the sequence is 2.618 giving a target at 3,124. If the target at 3,012 is met and passed, then this would be the next calculated target.
A target for intermediate wave (5) to end is calculated at minor degree.
Intermediate wave (5) is unfolding as an impulse, and within it minor waves 1 through to 4 may now all be complete.
Within intermediate wave (5), minor wave 3 was extended. Minor wave 5 may also extend.
Minute wave ii may not move beyond the start of minute wave i below 2,864.12.
HOURLY CHART
Click chart to enlarge.
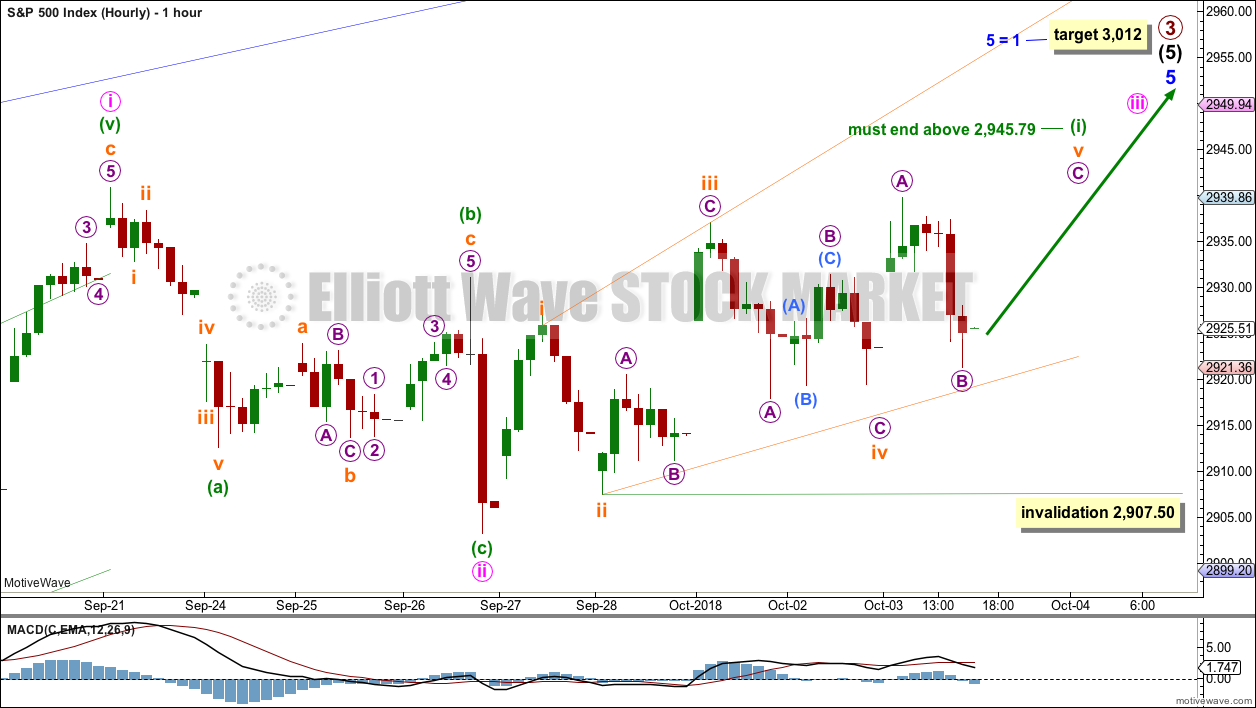
If minor wave 5 extends, then it may have begun with a leading expanding diagonal for minute wave i.
Minute wave ii may be a complete zigzag. Minute wave iii may have begun. This hourly wave count has good proportion at the daily chart level, and for this reason it is the main hourly wave count.
Overlapping suggests another leading diagonal may be unfolding for minuette wave (i). Within the diagonal, subminuette wave iv may not move beyond the end of subminuette wave ii below 2,907.50.
The diagonal is expanding: subminuette wave iii is longer than subminuette wave i, and subminuette wave iv so far is longer than subminuette wave ii. The last upwards wave of subminuette wave v must be longer than subminuette wave iii, which was 29.56 points in length. Subminuette wave v must end above 2,945.79 to meet the minimum required length.
If this first hourly chart is invalidated with a new low by any amount at any time frame, then the second hourly chart below may be used.
HOURLY CHART II
Click chart to enlarge.
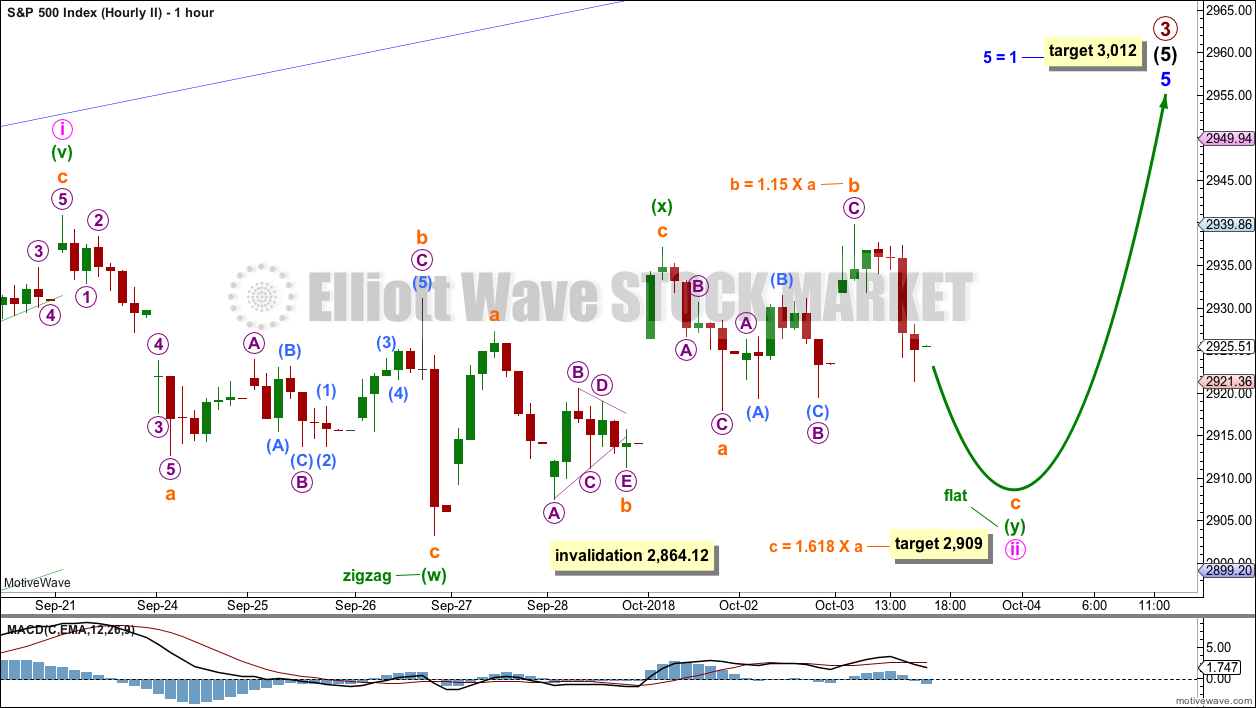
It is also possible that minute wave ii may not be over and may continue sideways as a double combination.
The first structure in a double may be a complete zigzag labelled minuette wave (w). The double may be joined by a three in the opposite direction, a zigzag labelled minuette wave (x). X waves within combinations are usually very deep, where X waves within double zigzags are usually more shallow. Here, minuette wave (x) is a 89.7 depth of minuette wave (w), which is very deep, so a double combination would be more likely.
A flat correction for the entirety of minute wave ii at this time does not fit; minuette wave (b) does not fit as a corrective structure ending at today’s high.
The second structure in a double combination is most commonly a flat correction, although occasionally it may be a triangle. Minuette wave (y) would most likely unfold as a flat correction. It would most likely end about the same level as minuette wave (w) at 2,903.28, so that the whole structure takes up time and moves price sideways, which is the purpose of the second structure within a combination.
Subminuette wave b may now be complete at 1.15 the length of subminuette wave a, indicating an expanded flat correction. The most common Fibonacci ratio for subminuette wave c within an expanded flat is used to calculate a target for it to end.
Subminuette wave c would be most likely to end below the end of subminuette wave a at 2,917.91 to avoid a truncation.
Minute wave ii may not move beyond the start of minute wave i below 2,864.12.
ALTERNATE ELLIOTT WAVE COUNT
DAILY CHART
Click chart to enlarge.
It is possible to see now that primary wave 3 could be over at the last high by simply moving the degree of labelling within minor wave 5 up one degree.
It is reasonably common for the S&P to exhibit a Fibonacci ratio between two actionary waves within an impulse, and uncommon for it to exhibit Fibonacci ratios between all three actionary waves within an impulse. The lack of a Fibonacci ratio for minor wave 5 within this wave count is not of any concern; this looks typical.
Primary wave 4 would most likely end somewhere within the price territory of the fourth wave of one lesser degree. Intermediate wave (4) has its price territory from 2,872.87 to 2,532.69. Within this range sit two Fibonacci ratios giving two targets. The lower 0.382 Fibonacci ratio may be more likely.
Primary wave 2 unfolded as a shallow regular flat correction lasting 10 weeks. Primary wave 4 may exhibit alternation in structure and may most likely unfold as a zigzag, triangle or combination. A zigzag would be the most likely structure as these are the most common corrective structures and would provide the best alternation with primary wave 2.
Primary wave 4 may not move into primary wave 1 price territory below 2,111.05. However, the lows in primary wave 4 should not get close to this point. The lower edge of the teal channel on the weekly chart should provide very strong support.
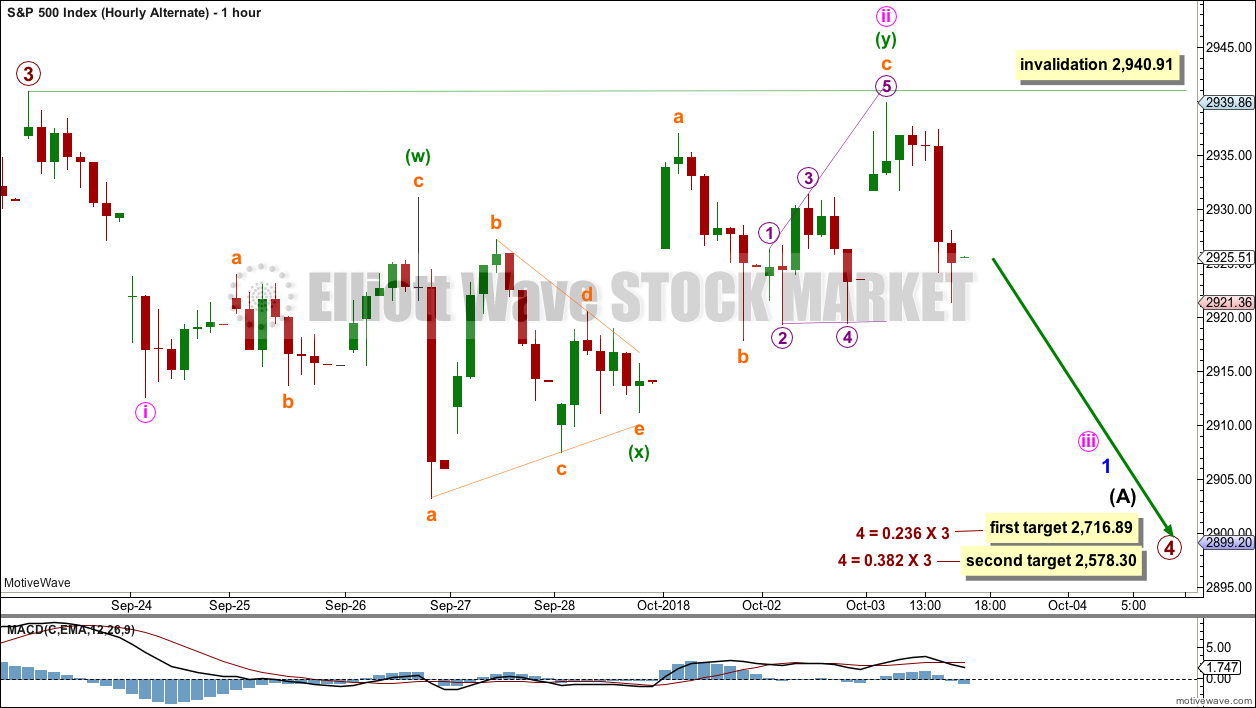
HOURLY CHART
Click chart to enlarge.
A movement at primary wave degree should begin with a five wave structure downwards. So far that would be incomplete.
The first five down may be labelled minor wave 1. So far only minute waves i and ii may be complete. If it continues further, then minute wave ii may not move beyond the start of minute wave i above 2,940.91.
Minute wave ii may have moved higher today, and will now fit as a double combination: flat – x – zigzag.
Minute wave iii should exhibit an increase in downwards momentum.
TECHNICAL ANALYSIS
WEEKLY CHART
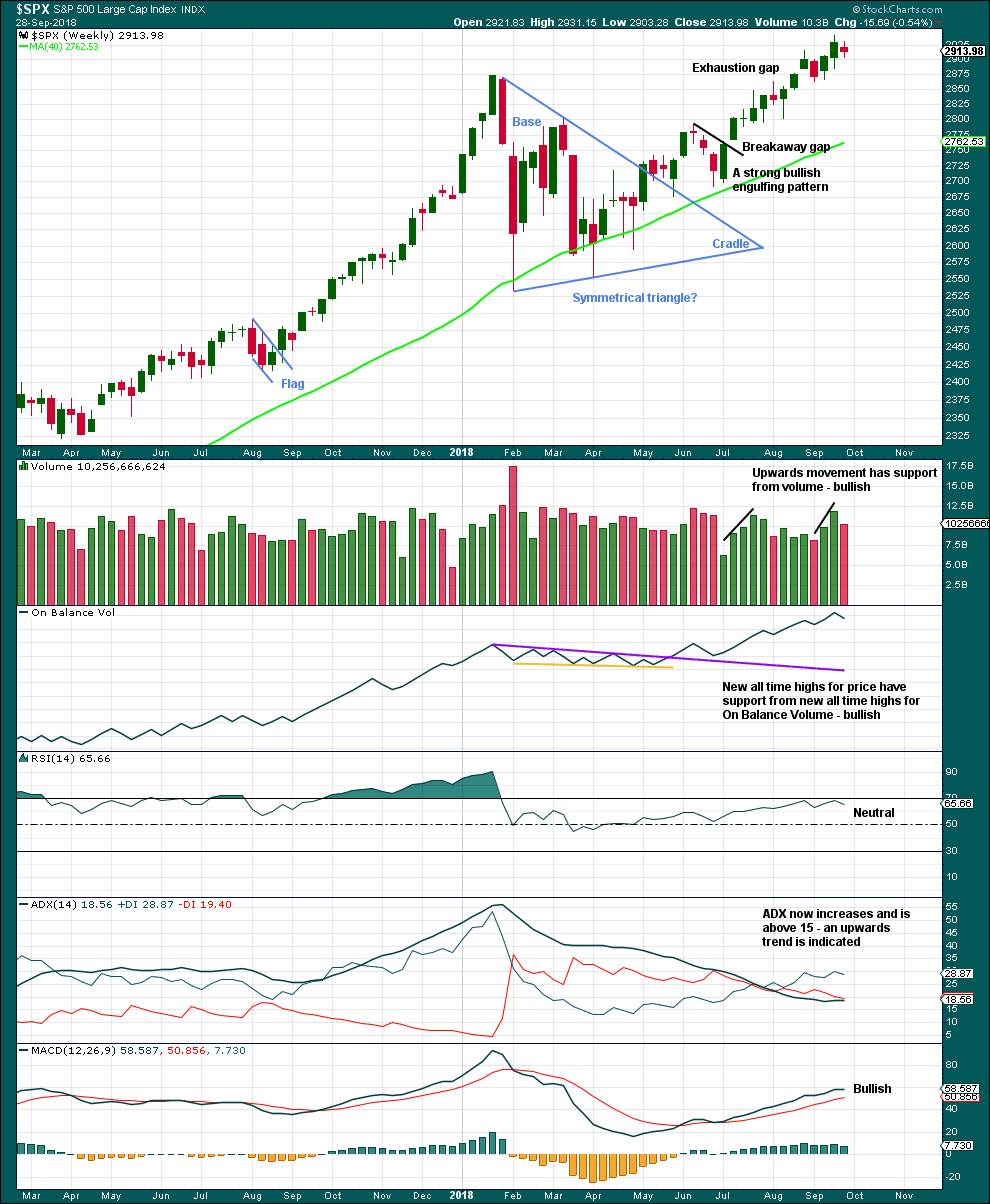
Click chart to enlarge. Chart courtesy of StockCharts.com.
The symmetrical triangle base distance is 340.18. Added to the breakout point of 2,704.54 this gives a target at 3,044.72. This target has not yet been met.
Last week completed an inside week with the balance of volume downwards and the candlestick closing red. Downwards movement within last week does not have support from volume. At this time frame, this week looks like a small pause within an ongoing upwards trend.
DAILY CHART
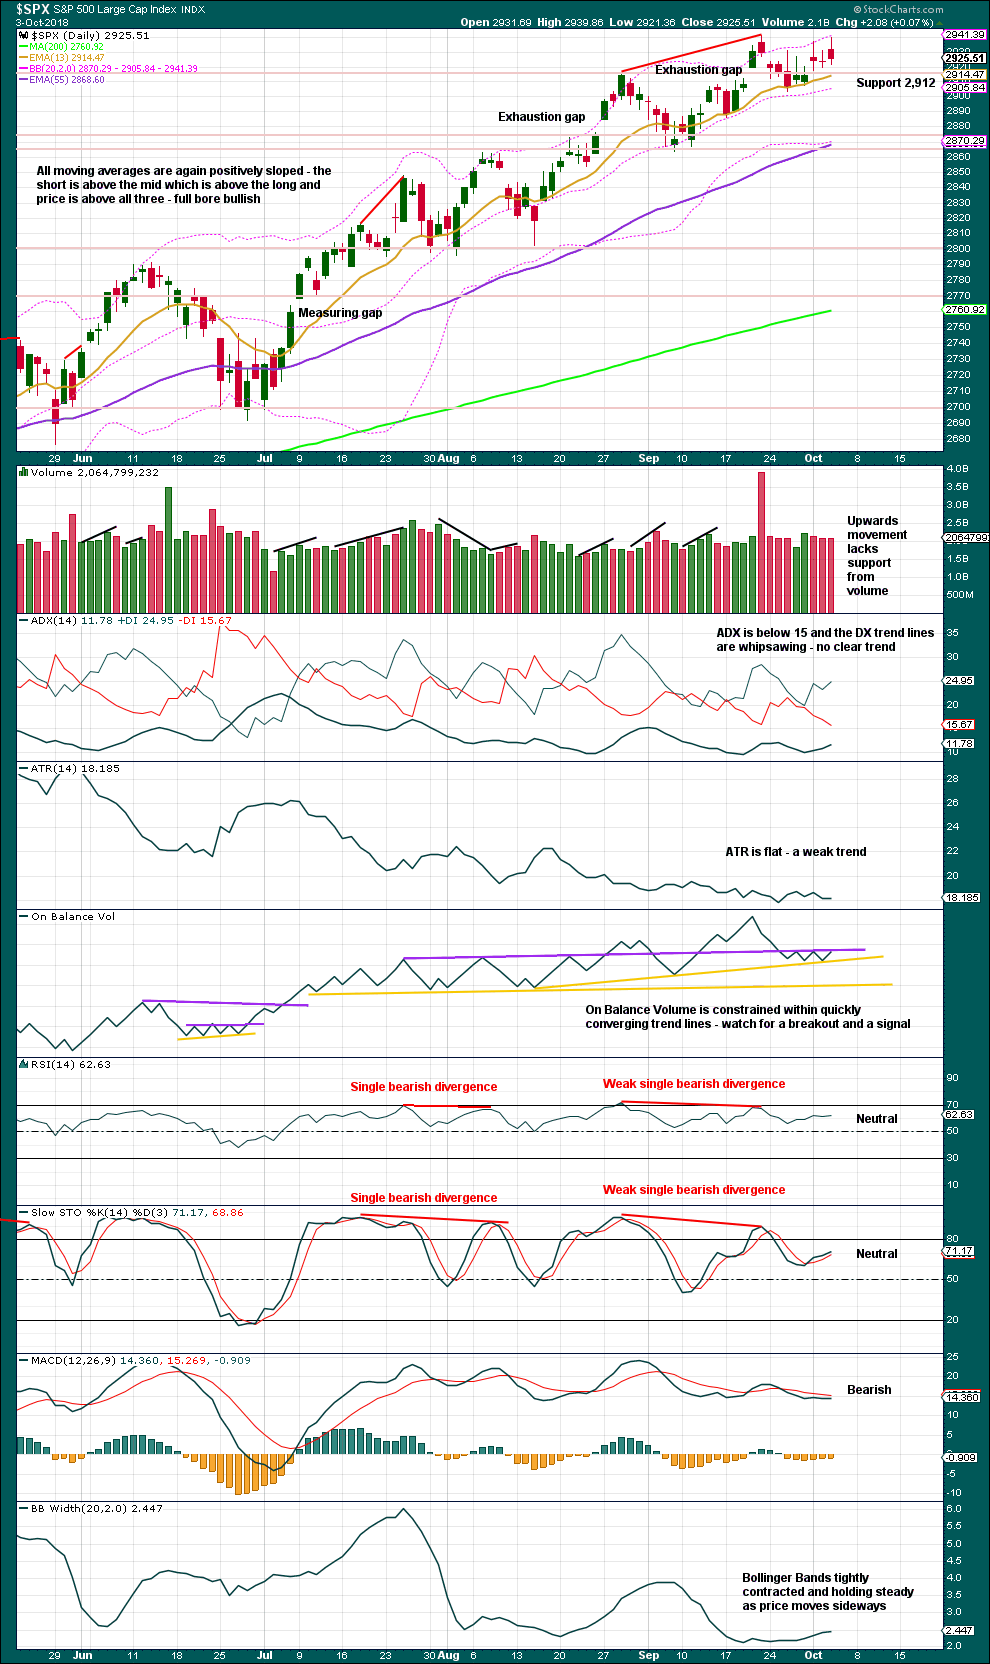
Click chart to enlarge. Chart courtesy of StockCharts.com.
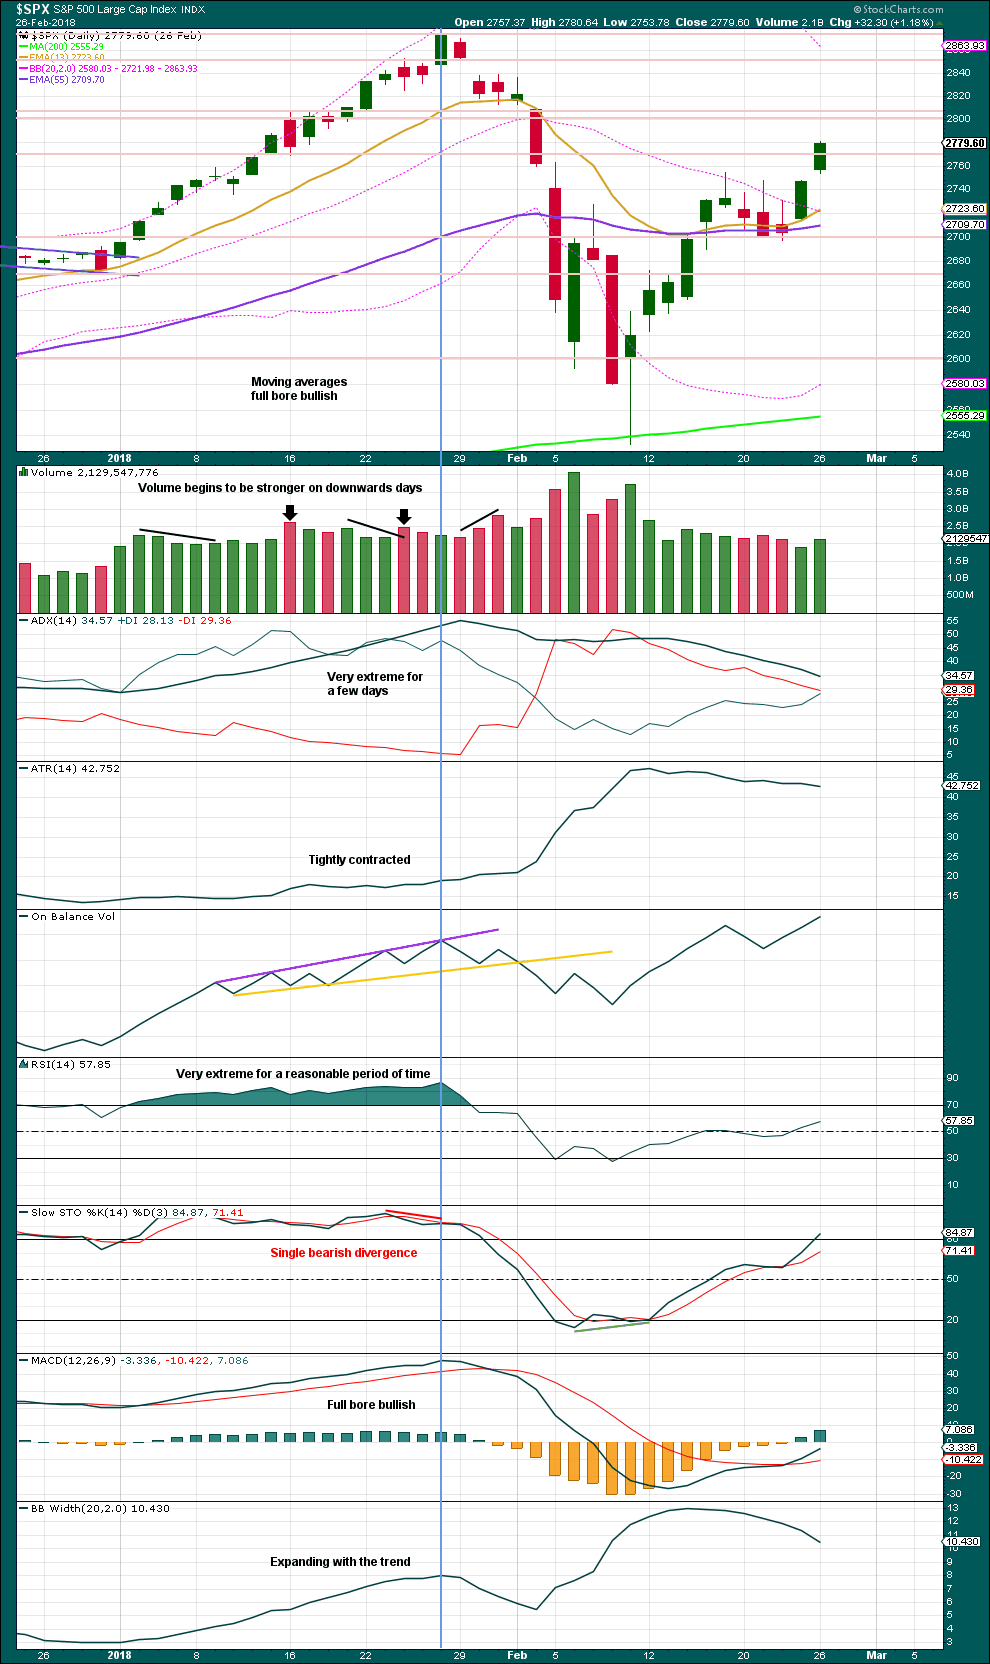
Closure of the last gap is bearish. The gap is now labelled an exhaustion gap.
An upwards day closes red with the balance of volume upwards. A slight decline in volume does not support upwards movement within this session. The short term volume profile remains bearish.
On Balance Volume may give a signal tomorrow or the day afterwards.
The bottom line remains that an upwards trend remains intact until price makes a new swing low. Look now for strong support about 2,875 – 2,865. If price makes a new swing low below 2,864.12, that would indicate a change from an upwards trend to either a larger sideways consolidation or a new downwards trend.
VOLATILITY – INVERTED VIX CHART
WEEKLY CHART
Click chart to enlarge. Chart courtesy of StockCharts.com. So that colour blind members are included, bearish signals
will be noted with blue and bullish signals with yellow.
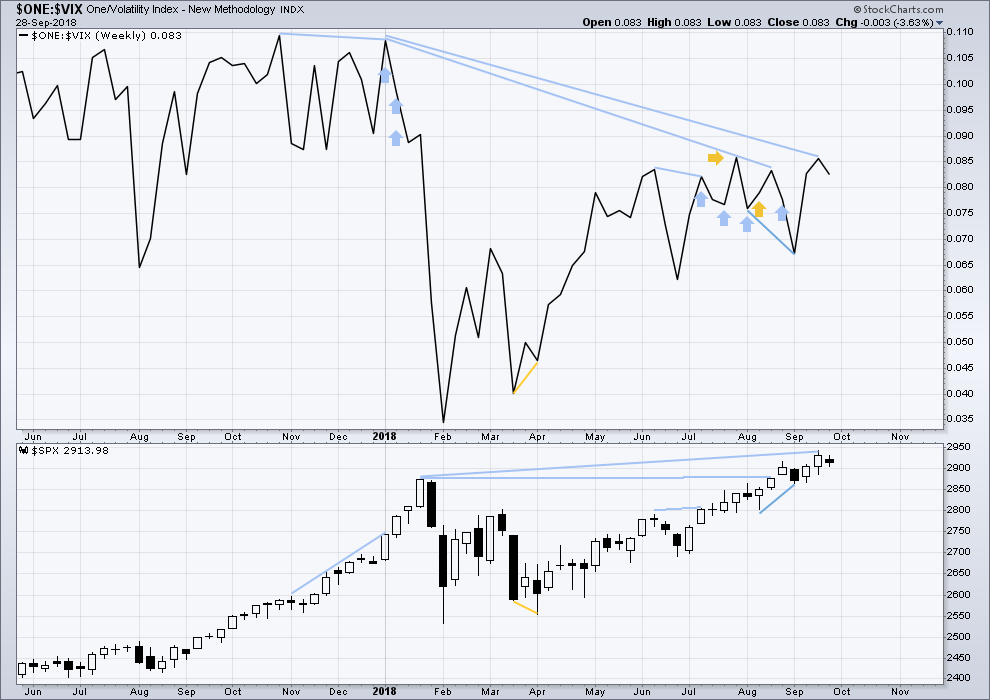
To keep an eye on the all time high for inverted VIX a weekly chart is required at this time.
Notice how inverted VIX has very strong bearish signals four weeks in a row just before the start of the last large fall in price. At the weekly chart level, this indicator may be useful again in warning of the end of primary wave 3.
At this time, there is mid term bearish divergence between price and inverted VIX: price has made another new all time high, but inverted VIX has not. This divergence may persist for some time. It may remain at the end of primary wave 3, and may develop further to the end of primary wave 5.
Downwards movement within last week has support from a normal increase in market volatility. There is no new short term divergence.
DAILY CHART
Click chart to enlarge. Chart courtesy of StockCharts.com. So that colour blind members are included, bearish signals
will be noted with blue and bullish signals with yellow.
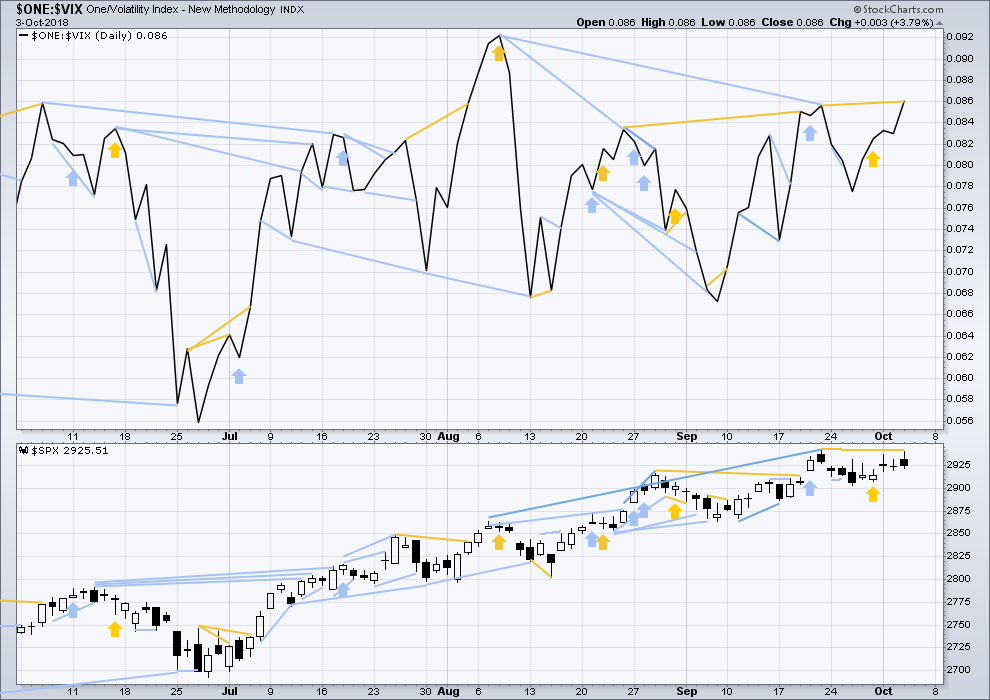
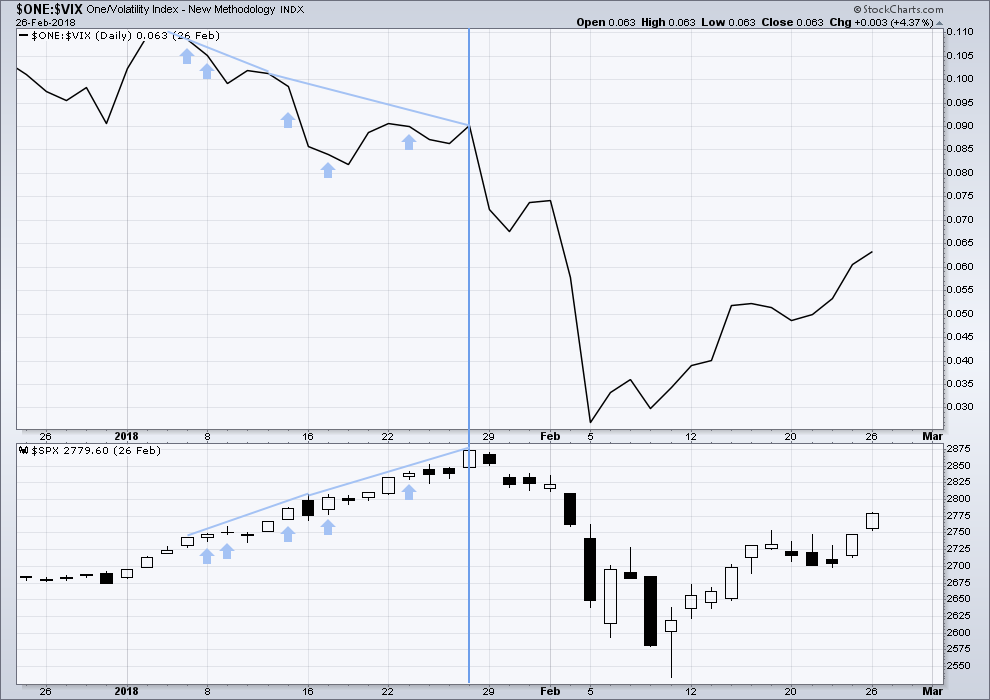
Normally, volatility should decline as price moves higher and increase as price moves lower. This means that normally inverted VIX should move in the same direction as price.
There is mid term divergence with a new all time high from price not supported by a corresponding new all time high from inverted VIX. This divergence is bearish.
Inverted VIX has made a new high today above the prior swing high of the 21st of September, but price has not. This divergence is bullish for the short term, but it is weak.
Mid term bearish divergence between price and inverted VIX can be seen on both daily and weekly charts now. However, this may not be a good timing tool in identifying the end of primary wave 3; divergence may develop further before primary wave 3 ends.
BREADTH – AD LINE
WEEKLY CHART
Click chart to enlarge. Chart courtesy of StockCharts.com.
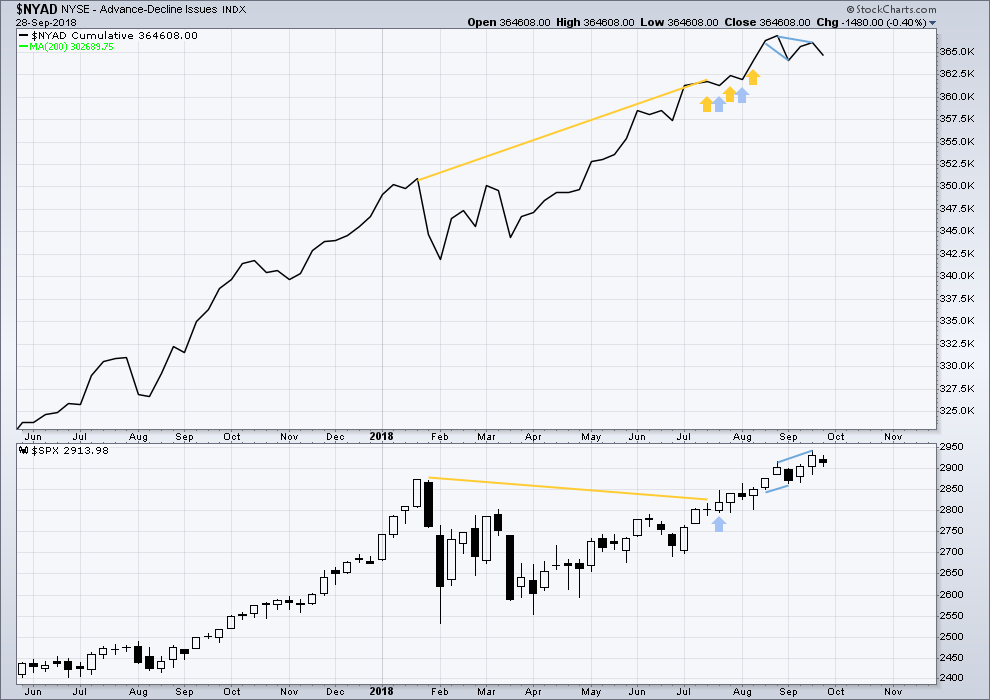
When primary wave 3 comes to an end, it may be valuable to watch the AD line at the weekly time frame as well as the daily.
There is still short term bearish divergence at the weekly chart level between price and the AD line. It is possible now that the end of primary wave 3 is quite close.
For the last completed week, price moved sideways. Downwards movement within the week has support from an increase in breadth.
DAILY CHART
Click chart to enlarge. Chart courtesy of StockCharts.com.
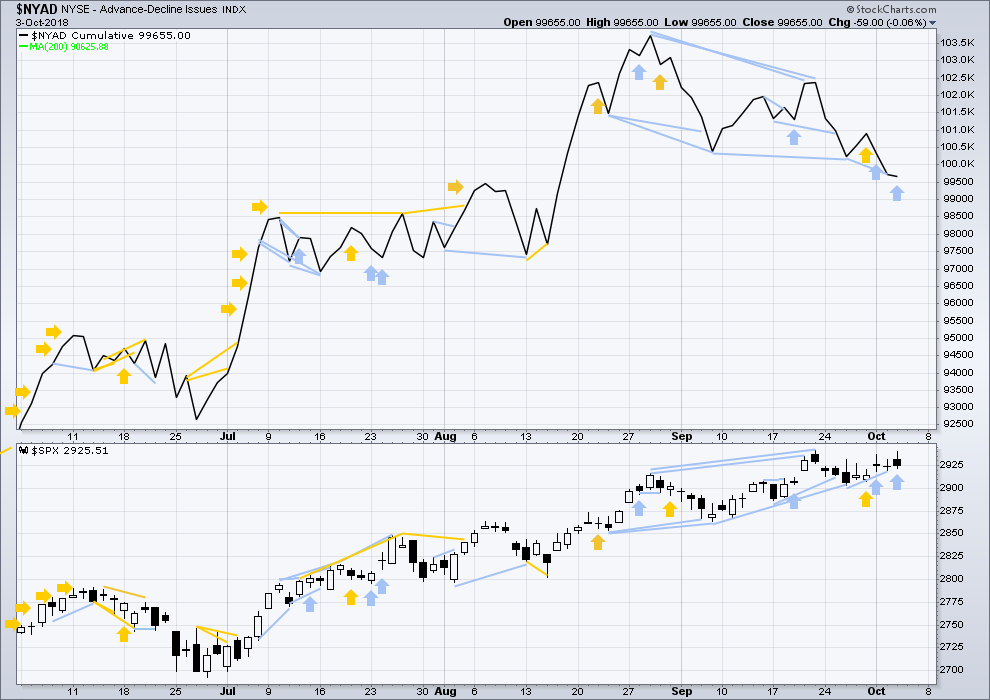
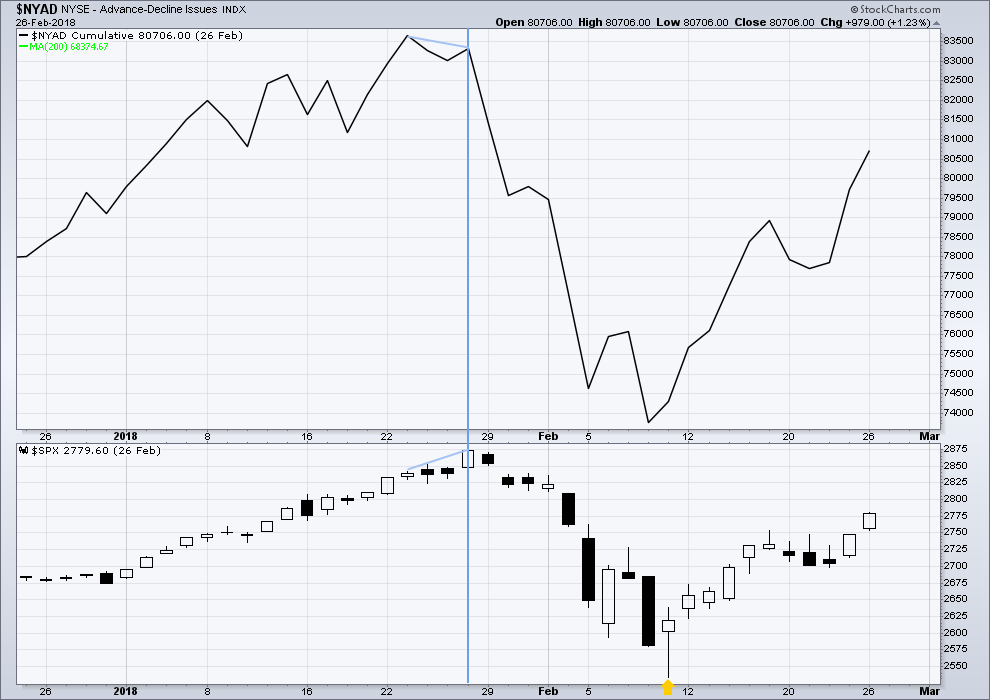
There is normally 4-6 months divergence between price and market breadth prior to a full fledged bear market. This has been so for all major bear markets within the last 90 odd years. With no longer term divergence yet at this point, any decline in price should be expected to be a pullback within an ongoing bull market and not necessarily the start of a bear market. New all time highs from the AD line on the 29th of August means that the beginning of any bear market may be at the end of December 2018, but it may of course be a lot longer than that. My next expectation for the end of this bull market may now be October 2019.
Breadth should be read as a leading indicator.
Price moved higher today, but the AD line has moved slightly lower. This divergence is bearish and supports either the second or the alternate hourly wave counts.
There is now a cluster of bearish signals at the daily chart from the AD line; this offers now some reasonable support to the new alternate Elliott wave count.
Small and mid caps made new all time highs on the 27th of August. Large caps made another new all time high on the 21st of September, but small and mid caps did not. Small caps have now made a new swing low, so they may be leading the market at this time.
DOW THEORY
The following lows need to be exceeded for Dow Theory to confirm the end of the bull market and a change to a bear market:
DJIA: 23,360.29.
DJT: 9,806.79.
S&P500: 2,532.69.
Nasdaq: 6,630.67.
All of DJIA, DJT, S&P500 and Nasdaq have made recent new all time highs. This provides Dow Theory confirmation that the bull market continues.
Charts showing each prior major swing low used for Dow Theory may be seen at the end of this analysis here.
ANALYSIS OF THE END OF INTERMEDIATE WAVE (3)
TECHNICAL ANALYSIS
Click chart to enlarge. Chart courtesy of StockCharts.com.
This chart looked overly bullish at the end of intermediate wave (3). The only warning in hindsight may have been from volume spiking slightly on downwards days. There was no bearish divergence between price and either of RSI or On Balance Volume.
Single bearish divergence between price and Stochastics was weak, which is often an unreliable signal.
VIX
Click chart to enlarge. Chart courtesy of StockCharts.com.
This is a daily chart.
The strongest warning of an approaching intermediate degree correction at the daily chart level came from inverted VIX.
There was strong double bearish divergence at the high of intermediate wave (3), which is noted by the vertical line. There was also a sequence of five days of bearish divergence, days in which price moved higher but inverted VIX moved lower.
AD LINE
Click chart to enlarge. Chart courtesy of StockCharts.com.
This is a daily chart.
There was only single bearish divergence between price and the AD line at the end of intermediate wave (3). Approaching the high, there were no instances of price moving higher and the AD line moving lower.
Conclusion: When studying the behaviour of price and these indicators just before the start of intermediate wave (4), we may see some clues for warning us of primary wave 4. A cluster of bearish signals from VIX along with a bearish divergence from price and the AD line or On Balance Volume may warn of primary wave 4. The next instance will probably not behave the same as the last, but there may be similarities.
At this time, it does not look like primary wave 4 may begin right now, but we need to be aware of its approach.
Published @ 07:41 p.m. EST.
—
Careful risk management protects your trading account(s).
Follow my two Golden Rules:
1. Always trade with stops.
2. Risk only 1-5% of equity on any one trade.
Where is Verne?
🙁
NDX daily since the completion of the early year 4.
The only way I can model this thing is using a big ending diagonal 5 to address the highly overlapped action.
That leads to the question of whether that diagonal is over. The final v did get to an ATH…but not up to (or any throw over) the upper channel line. So I don’t know…but if you forced me, I’d say it looks more like it will prove out complete.
For US Oil, I’ve just posted updated charts on Lara’s Weekly and the US Oil analysis over at Elliott wave gold.
Thanks Lara
This downwards movement has for far found support at the lower edge of the blue Elliott channel which is on the main daily and hourly charts. Price is currently bouncing strongly up from there.
I’m going to see if I can label minute ii as a flat correction, for now I’ll leave it labelled as a combination.
GLD daily: continues to just go sideways. Perfect, because I put on a put butterfly spread centered at 113 a few weeks ago, looking for exactly this action. But I need it to hold on for another 7-11 days to really cash. Meanwhile…15 days of sqeeze. If there is ONE THING I’m learning from today, it is PAY MORE ATTENTION TO and TRADE THE BREAKOUT FROM THE RANGE ESTABLISHED DURING squeezes! And don’t wait for the squeeze to “go off”, take the break out of the range, anticipating perhaps the squeeze turning off. If either Darvas box line gets exceeded here…I’m out of the fly for perhaps a very small loss, and into a larger positional trade in that direction, pronto.
Right, hopefully it won’t go up 50 bucks overnight…..I’m with you on waiting though. been burnt too many times guessing direction.
A spread opened within a trading range, one of the safest methods to be ready to profit on the breakout. I like this technique, one of my favourites.
Very often price turns back to test prior resistance or support after a breakout, but entering then requires great patience. And sometimes the re-test does not happen.
Also, when the position is opened within the range of consolidation it can stay open during a re-test, as the price point is beyond where the test normally goes.
What can go wrong (among other things): false breakouts can see the losing side of the spread closed for a loss, but the winning side then also turn into breakeven when the breakout turns out to be false. Leaving overall a loss.
NDX daily. The biggest break down today in my book (cracking that big channel line).
Also note the shift today to “down” at this TF.
I’m not getting super excited about the short side at this point unless/until I see the early Sept swing low get violated. w/o that, I expect backing and filling to the upside here.
RUT daily. Might be done with a turn off the current 38%. Or it might just keep on rockin’ next few days. The two white lines are projections of recent down swings in RUT. This one is still in the “mild” category, but that may not last.
well today certainly made up for past few weeks of mental frustration. Hope everyone is enjoying and profiting. Close UVXY bull put spread, sold 80% of VIX futures and 50% of VIX calls (not trading advice)
Your “going all in” post from a few days back was pretty near the top, eh? Nicely played.
Close enough for government work
The other day I mentioned that my equal weighted FAANGM ticker is in a weekly, daily, and hourly squeeze.
The hourly squeeze is off now with this sell off. Though price is still in the middle of the June-Oct range. The daily and weekly stay in their volatility squeezes. Price on the daily may drop out of that range…but another fall in price similar today’s is needed for that to happen. A bit more selling, then back to ranging for more days, even weeks, is very possible here, if not the most likely scenario. In which case, the P4 is not on yet.
Don’t forget AMD, bounce on the 0.618 again
Not considering AMD on the long side unless/until the daily tf down trend line is broken. I consider it in free fall until that happens. I think the mid 24’s are very possible before a turn occurs; I have a massive cluster of fibo’s there.
NDX hourly. The 78% fibo is at least temporarily turning price back up, and right around the lower major channel line, so I’m thinking that one just might hold.
NOTE: the 3 hours of squeeze immediately prior to price fallout below the lower Darvas box…that was a HUGE sell signal, which I will not miss again (I had a QQQ bear spread on, but if I’d properly seen that…could have/should loaded up on raw QQQ puts).
My updated hourly view of SPX.
Targets for this sell off shown, levels are:
2893.5
2880.5
2864.2
at this point this looks like the first move down. I would think a bounce up may happen at any time. Perhaps that would be a time to add to short positions. I’m staying away from being long. The volume and number of new lows makes me think those targets will probably be a bounce up before we turn lower again.
If this low holds Kevin, you’ll be my hero
The current weekly view, to help with perspective.
The weekly trend is still STRONGLY UP. (As is the monthly.)
And price is still in the “middle-ish” of the wide intermediate 5 channel.
Maybe that all doesn’t last. Or maybe it does. I don’t know.
My take: we are going to get MORE churn here “at the top” for at least several more days, and possibly even then a final head fake push up to complete P3. The churn is all about the professional money exiting the house. “Distribution” and all that. My view, could be wrong.
Another set of data points. I’ve put in white lines showing projections of the downswings throughout the intermediate 5 up. What we call “bullish symmetry”. The argument is that as long as this correction is less the largest such correction seen so far in the bull run…the bull run isn’t over yet. Price has to BREAK the bullish symmetry.
This move down is still smaller than the TYPICAL down swing length throughout the intermediate 5 up. And way, way smaller than the largest such.
I have as many bearish concerns as ya’ll. That said, I’m trying to not be overwhelmed by possible (only possible) wave count considerations. Looking at ALL the evidence…there’s no strong indication yet that the P3 is over.
wow, 25 new highs, 278 new lows on the NYSE. this is not good
SPX 2911 is a 78% retrace level and has potential to hold here. Then 2903, a 100%/swing low. Below that…2885 (a swing low), then 2865 (the intermediate 5 lower channel line and yet another swing low.
Meanwhile NDX falls away towards the target I identified a few days ago when it showed a double top (7516, a 62% retrace level overlapping the lower channel line).
TLT nicely tanked again over night. The result is banking is moving up (XLF +1.3%!) while everything else is toast.
NDX daily.
Thanks for postn these targets, I haven’t had coffee yet…
I closed out the short side of my SPX and NDX spreads a few minutes after seeing double bottom on the one minute on SPX and NDX right on fibo’s (62% NDX, 100% SPX)…a serious bounce up now would be APPRECIATED!! (Careful with that axe, Kevin…).
Well, I exited the other legs at a bit higher prices, break even overall, I’ll take it. Holding my SPX bear spreads of course…
One other quick thought: if the entire banking system fails and the S&P goes to 0, what do you guys plan to do with your gains from shorting the market? Is there a point at which we should be cashing out and building bunkers stockpiled with food, weapons, and medical supplies? If Lowes and Home Depot fail, how will I get hardware supplies? I realize this may seem a little facetious, but seriously, if there really are tanks in the streets this time, what exactly is the plan?
Back in 2015 we got really bearish in this forum. We got Lara to be bearish with us. Of course it turned out to be a wave four. The euphoria is just not out there yet. Read what you wrote. It makes me believe we probably going through a similar thing…just saying.
Is good that Lara is somewhat bullish. It kind of counteracts the over bearishness of some other Elliott analysts…
Easy: dig a well, stock up on ammo, and mine crypto with solar.
I think the bear dancing has started …
Bo I found the book “The Secret Life of Real Estate and Banking” to be extremely informative about how money, banking, credit, and real estate value are interlinked, and all about the cyclical nature of the system. Extremely educational and informative. It goes through those cycles through all of US’s history, with historical detail. Worth every penny IMO.
After a certain point (probably the middle of a third wave down) shorting may be illegal and we won’t be able to profit from that.
A home in the country in a safe country may be best. New Zealand is one of the best places, which is why the uber wealthy from the USA are currently buying up large tracts of our land and building bolt holes. The attitude from NZers towards this is getting quite intolerant of it, and one of the coalition members in our government has reducing foreign ownership of our land as a core policy. But it is being watered down so…
As bearish as I am, I do think the count looks good with one more high. I agree the action from the August 26 low looks like a 5-up. At the same time, we are getting perilously close to the end of this huge ascending wedge and I can’t see how there’s any possibility other than a break down after it ends.
On second thought, Futs now reminding me of 2/2 action. I wouldn’t be surprised to see a deeper swoon into Friday and then a Black Monday.
I believe it will happen in the coming week… but I do have my SL for my short position…