It was expected for Friday that price may move lower, which is what happened.
Summary: At this stage, it would be best to let price tell us if primary wave 3 is over or not.
Long upper candlestick wicks and a bearish short term volume profile support the idea that price may continue a little lower to begin the new week. The short term target is now at 2,892.
While price remains above 2,864.12, then this may still be another pullback within an ongoing upwards trend. The target is now at 3,012.
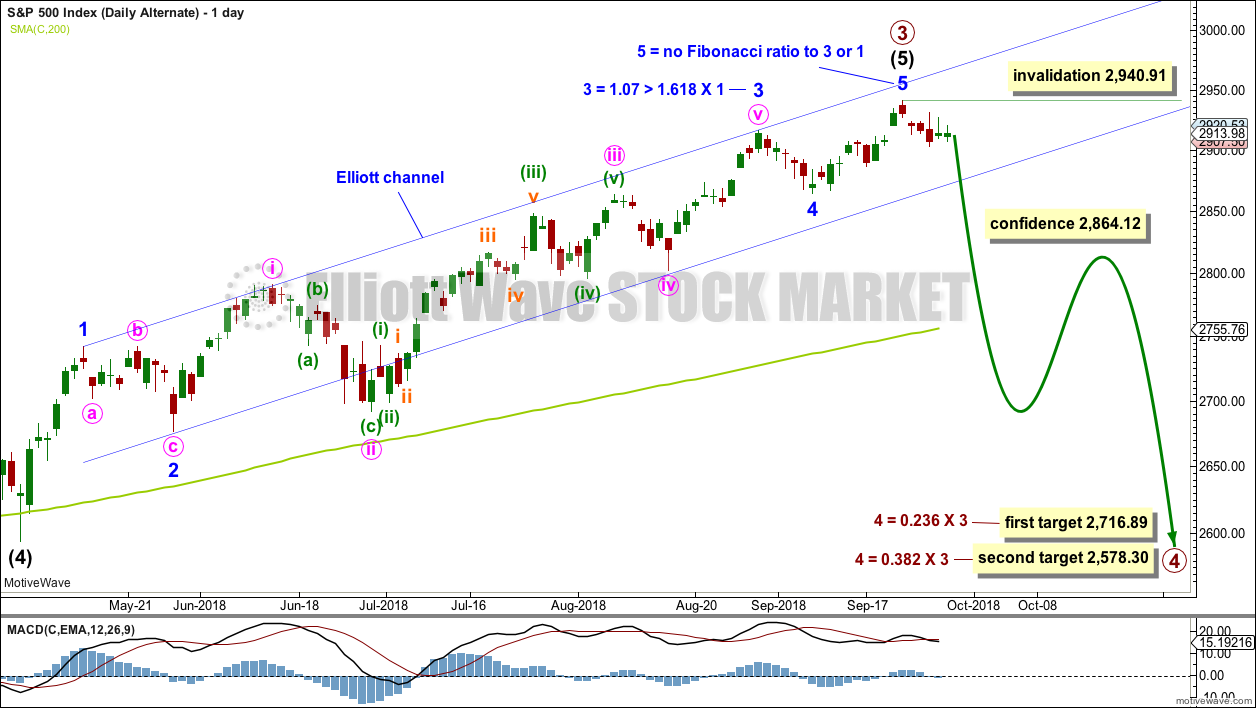
If price makes a new low by any amount at any time frame below 2,864.12, then some confidence that primary wave 4 has begun may be had. Targets are either 2,716.89 or 2,578.30. There is now enough bearishness from the AD line to take this possibility fairly seriously. Primary wave 4 is expected to be a large choppy consolidation, which may last about a Fibonacci 13 weeks.
The final target for this bull market to end remains at 3,616, which may be met in October 2019.
New updates to this analysis are in bold.
The biggest picture, Grand Super Cycle analysis, is here.
Last historic analysis with monthly charts is here, video is here.
MAIN ELLIOTT WAVE COUNT
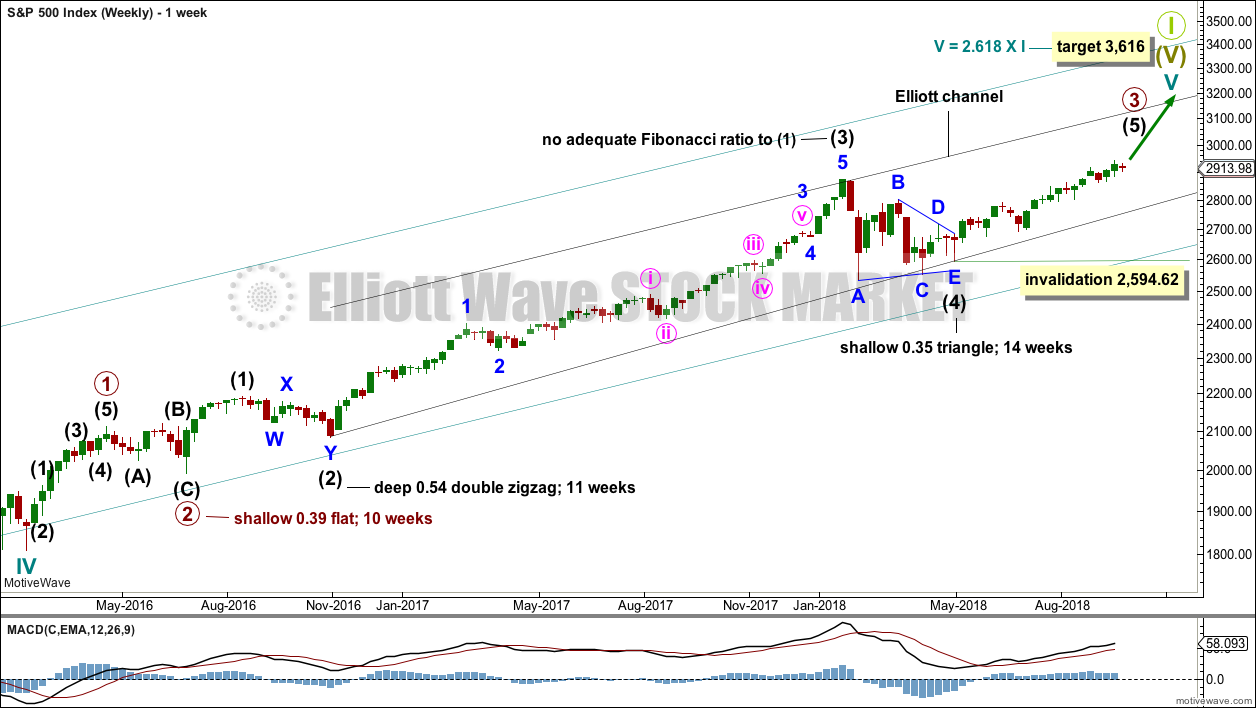
WEEKLY CHART
Cycle wave V must complete as a five structure, which should look clear at the weekly chart level and also now at the monthly chart level. It may only be an impulse or ending diagonal. At this stage, it is clear it is an impulse.
Within cycle wave V, the third waves at all degrees may only subdivide as impulses.
Intermediate wave (4) has breached an Elliott channel drawn using Elliott’s first technique. The channel is redrawn using Elliott’s second technique: the first trend line from the ends of intermediate waves (2) to (4), then a parallel copy on the end of intermediate wave (3). Intermediate wave (5) may end either midway within the channel, or about the upper edge.
There is perfect alternation and excellent proportion between intermediate waves (2) and (4).
At this stage, the expectation is for the final target to me met in October 2019. If price gets up to this target and either the structure is incomplete or price keeps rising through it, then a new higher target would be calculated.
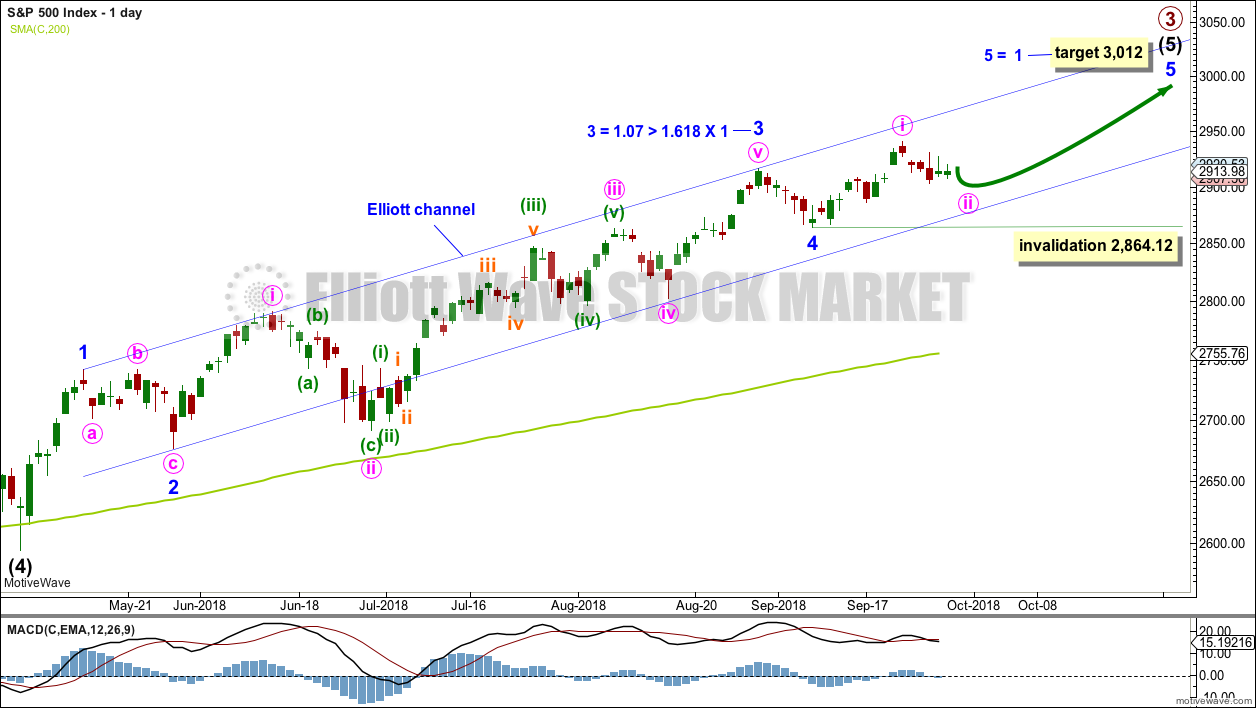
DAILY CHART
Intermediate wave (5) avoided a truncation now that it has a new high above the end of intermediate wave (3) at 2,872.87.
Intermediate wave (3) exhibits no Fibonacci ratio to intermediate wave (1). It is more likely then that intermediate wave (5) may exhibit a Fibonacci ratio to either of intermediate waves (1) or (3). Intermediate wave (5) has passed equality in length and 1.618 the length of intermediate wave (1). The next Fibonacci ratio in the sequence is 2.618 giving a target at 3,124. If the target at 3,012 is met and passed, then this would be the next calculated target.
A target for intermediate wave (5) to end is calculated at minor degree.
Intermediate wave (5) is unfolding as an impulse, and within it minor waves 1 through to 4 may now all be complete.
Within intermediate wave (5), minor wave 3 was extended. Minor wave 5 may also extend.
Minute wave ii may move a little lower to begin next week. The target for it to end is about 2,892, which is very close to 0.618 of minute wave i.
Minute wave ii may not move beyond the start of minute wave i below 2,864.12.
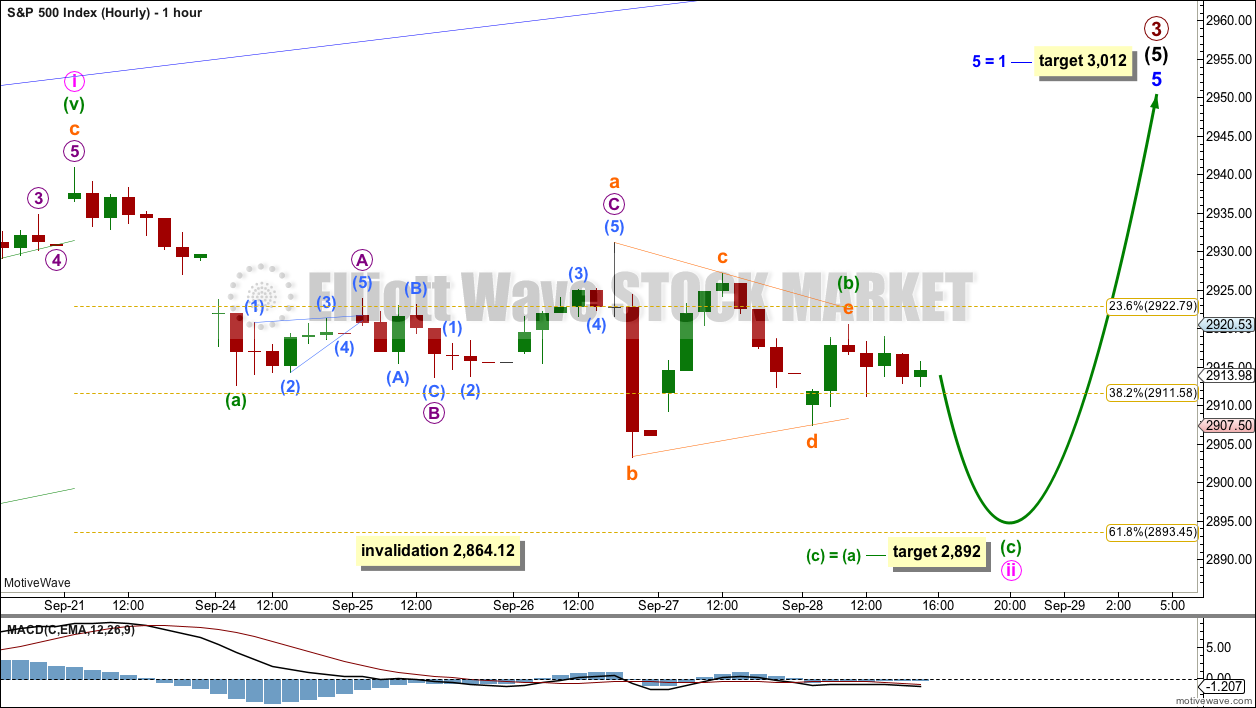
HOURLY CHART
If minor wave 5 extends, then it may have begun with a leading expanding diagonal for minute wave i.
Minute wave ii may be an incomplete zigzag. Within the zigzag, minuette wave (b) may now be a complete running contracting triangle, which has a good fit for sideways movement of the last two sessions.
The target for minute wave ii to end on Monday or Tuesday next week would see minuette waves (a) and (c) be about even in length, and minute wave ii ending close to the 0.618 Fibonacci ratio of minute wave i.
Minute wave ii may not move beyond the start of minute wave i below 2,864.12.
ALTERNATE ELLIOTT WAVE COUNT
DAILY CHART
It is possible to see now that primary wave 3 could be over at the last high by simply moving the degree of labelling within minor wave 5 up one degree.
It is reasonably common for the S&P to exhibit a Fibonacci ratio between two actionary waves within an impulse, and uncommon for it to exhibit Fibonacci ratios between all three actionary waves within an impulse. The lack of a Fibonacci ratio for minor wave 5 within this wave count is not of any concern; this looks typical.
Primary wave 4 would most likely end somewhere within the price territory of the fourth wave of one lesser degree. Intermediate wave (4) has its price territory from 2,872.87 to 2,532.69. Within this range sit two Fibonacci ratios giving two targets. The lower 0.382 Fibonacci ratio may be more likely.
Primary wave 2 unfolded as a shallow regular flat correction lasting 10 weeks. Primary wave 4 may exhibit alternation in structure and may most likely unfold as a zigzag, triangle or combination. A zigzag would be the most likely structure as these are the most common corrective structures and would provide the best alternation with primary wave 2.
Primary wave 4 may not move into primary wave 1 price territory below 2,111.05. However, the lows in primary wave 4 should not get close to this point. The lower edge of the teal channel on the weekly chart should provide very strong support.
HOURLY CHART
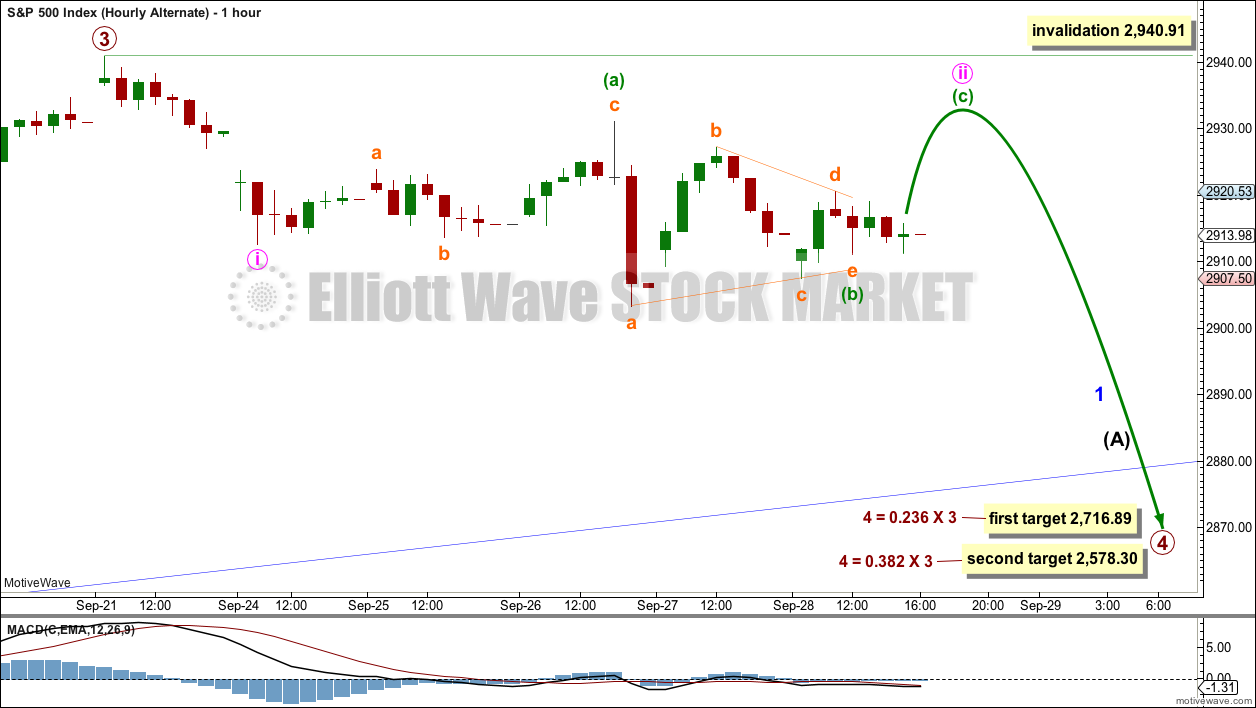
A movement at primary wave degree should begin with a five wave structure downwards. So far that would be incomplete.
The first five down may be labelled minor wave 1. So far only minute wave i may be complete. Minute wave ii may not move beyond the start of minute wave i above 2,940.91.
Minute wave ii is relabelled as an incomplete expanded flat correction. Minuette wave (b) may be a complete running contracting triangle and a 1.08 length of minuette wave (a). Minuette wave (c) would be most likely to make at least a slight new high above the end of minuette wave (a) at 2,931.15 to avoid a truncation and a very rare running flat.
When minute wave ii is complete, then minute wave iii should exhibit an increase in downwards momentum.
TECHNICAL ANALYSIS
WEEKLY CHART
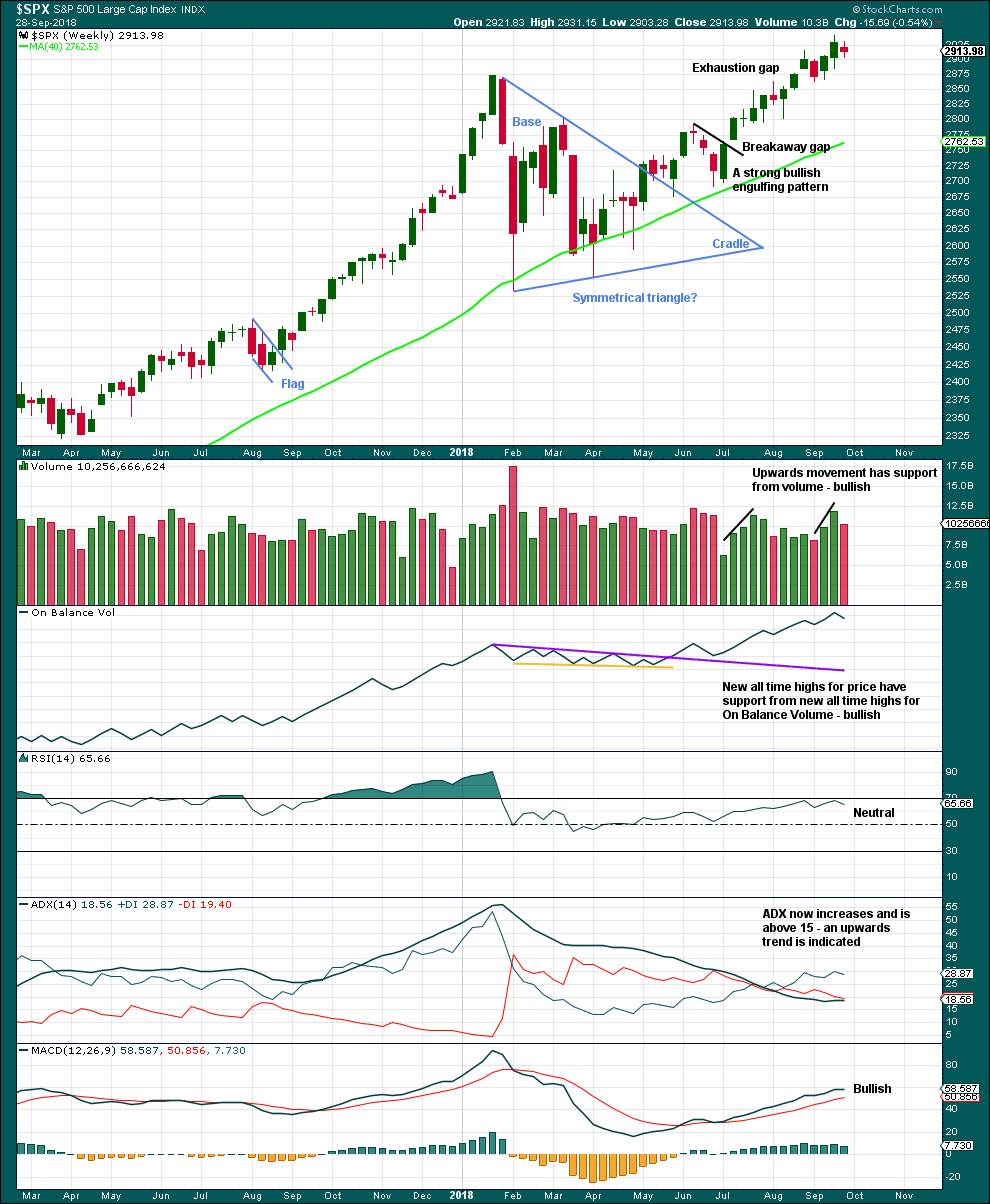
Click chart to enlarge. Chart courtesy of StockCharts.com.
The symmetrical triangle base distance is 340.18. Added to the breakout point of 2,704.54 this gives a target at 3,044.72. This target has not yet been met.
This week completed an inside week with the balance of volume downwards and the candlestick closing red. Downwards movement within this week does not have support from volume. At this time frame, this week looks like a small pause within an ongoing upwards trend.
DAILY CHART
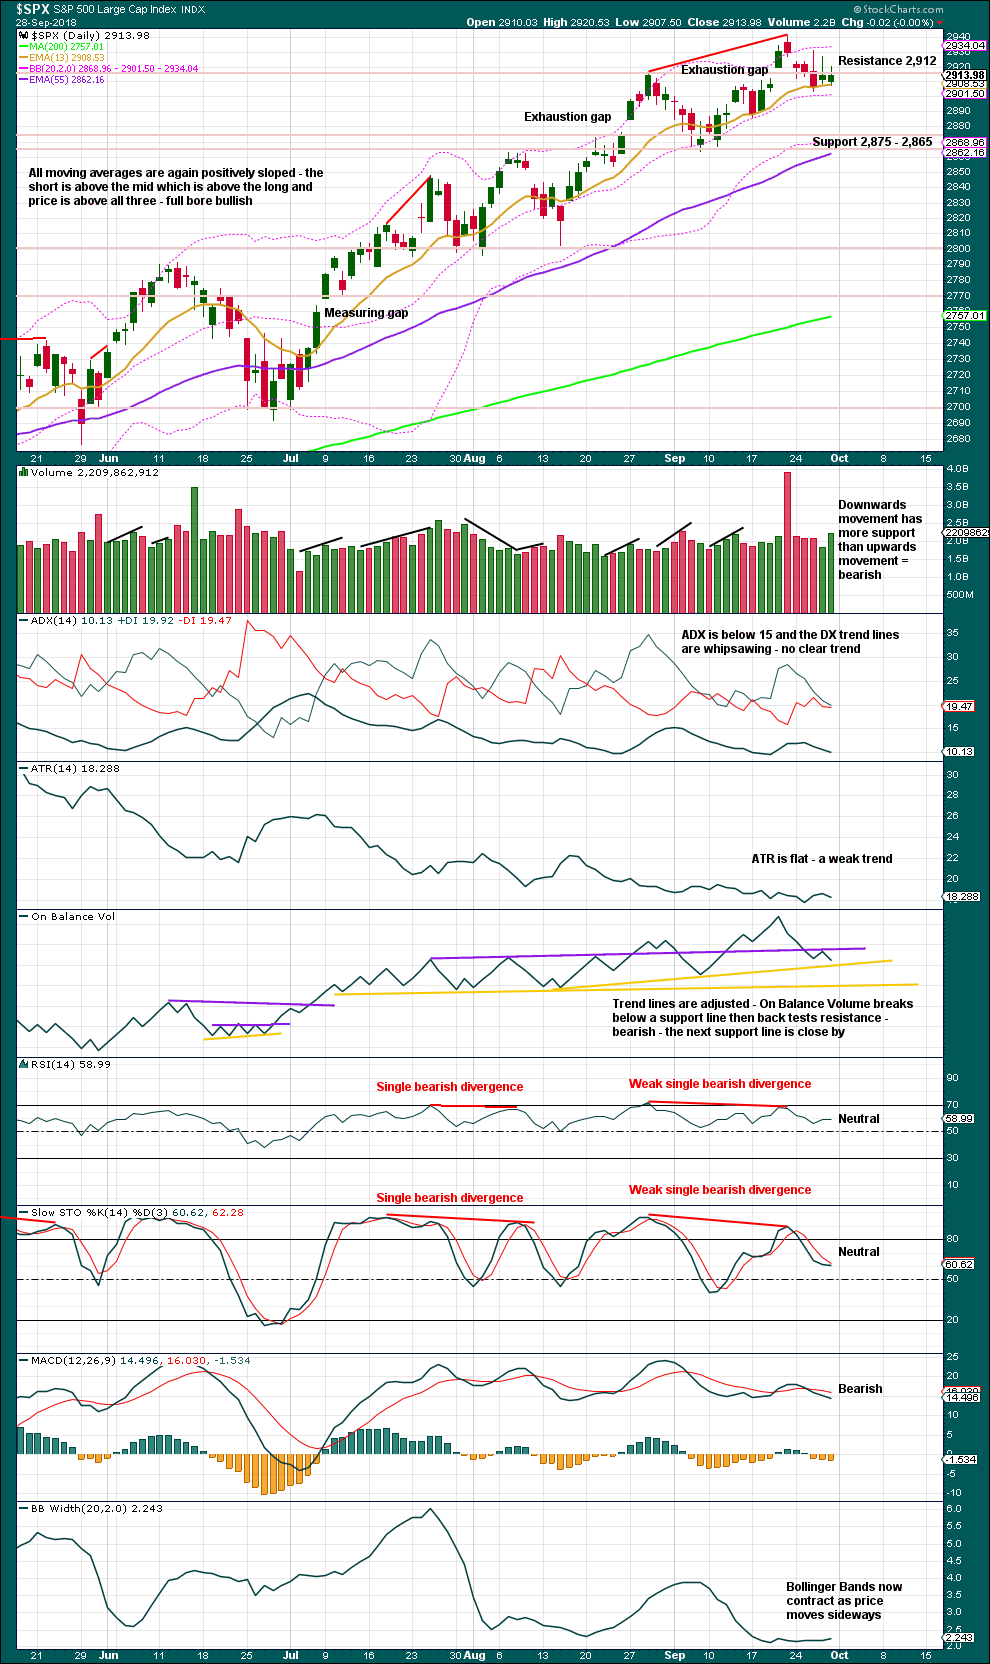
Click chart to enlarge. Chart courtesy of StockCharts.com.
Closure of the last gap is bearish. The gap is now labelled an exhaustion gap.
The long upper wicks on the last three daily candlesticks are bearish.
Although the candlestick for Friday closed green, Friday saw downwards movement with a lower low and a lower high. Downwards movement has support from volume; the short term volume profile is bearish.
The bottom line remains that an upwards trend remains intact until price makes a new swing low. Look now for strong support about 2,875 – 2,865. If price makes a new swing low below 2,864.12, that would indicate a change from an upwards trend to either a larger sideways consolidation or a new downwards trend.
VOLATILITY – INVERTED VIX CHART
WEEKLY CHART
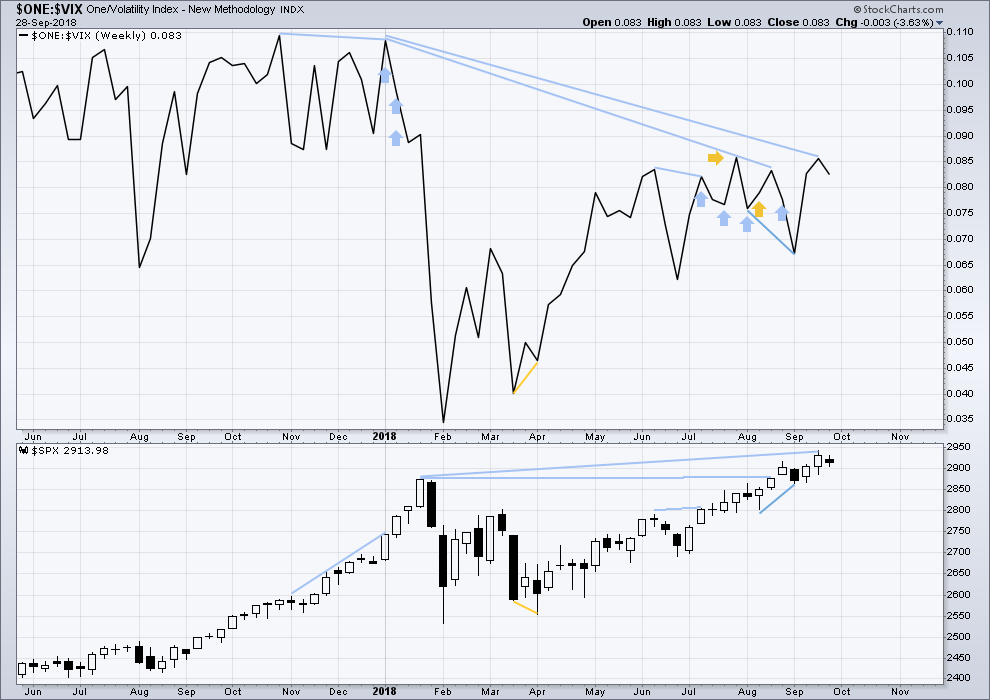
Click chart to enlarge. Chart courtesy of StockCharts.com. So that colour blind members are included, bearish signals
will be noted with blue and bullish signals with yellow.
To keep an eye on the all time high for inverted VIX a weekly chart is required at this time.
Notice how inverted VIX has very strong bearish signals four weeks in a row just before the start of the last large fall in price. At the weekly chart level, this indicator may be useful again in warning of the end of primary wave 3.
At this time, there is mid term bearish divergence between price and inverted VIX: price has made another new all time high, but inverted VIX has not. This divergence may persist for some time. It may remain at the end of primary wave 3, and may develop further to the end of primary wave 5.
Downwards movement within this week has support from a normal increase in market volatility. There is no new short term divergence.
DAILY CHART
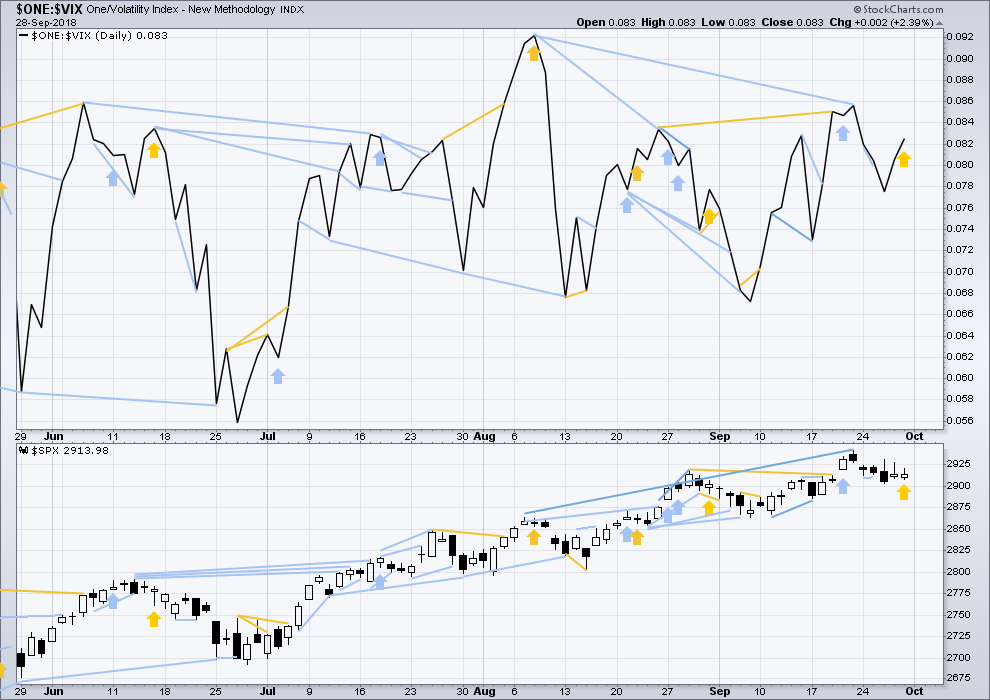
Click chart to enlarge. Chart courtesy of StockCharts.com. So that colour blind members are included, bearish signals
will be noted with blue and bullish signals with yellow.
Normally, volatility should decline as price moves higher and increase as price moves lower. This means that normally inverted VIX should move in the same direction as price.
There is mid term divergence with a new all time high from price not supported by a corresponding new all time high from inverted VIX. This divergence is bearish.
Downwards movement for Friday comes with a decline in market volatility as inverted VIX moves higher. This is short term bullish divergence.
Mid term bearish divergence between price and inverted VIX can be seen on both daily and weekly charts now. However, this may not be a good timing tool in identifying the end of primary wave 3; divergence may develop further before primary wave 3 ends.
BREADTH – AD LINE
WEEKLY CHART
Click chart to enlarge. Chart courtesy of StockCharts.com.
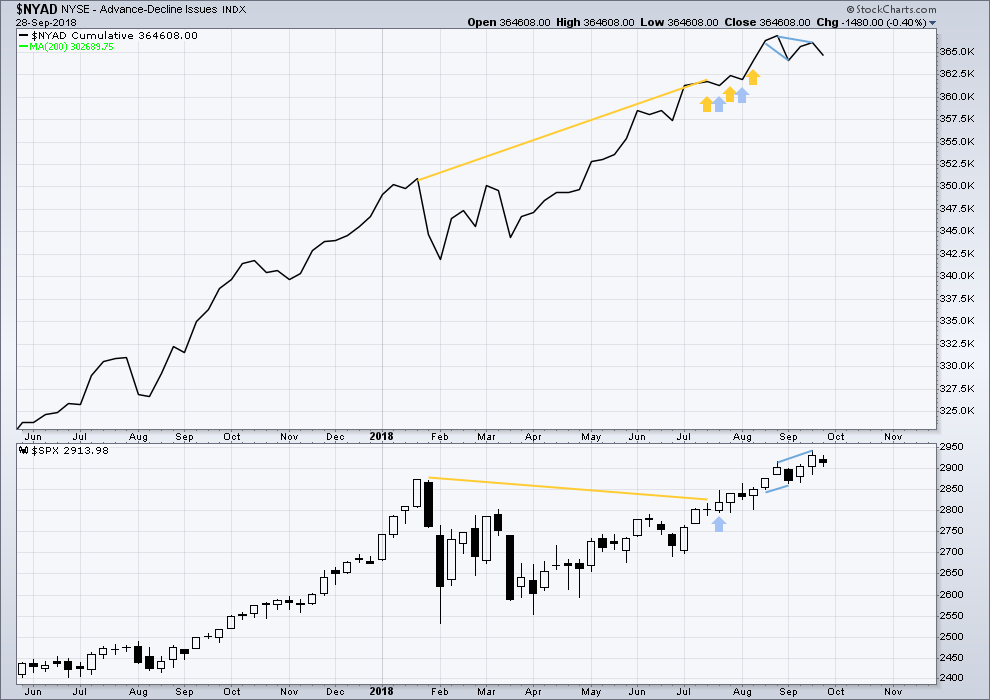
When primary wave 3 comes to an end, it may be valuable to watch the AD line at the weekly time frame as well as the daily.
There is still short term bearish divergence at the weekly chart level between price and the AD line. It is possible now that the end of primary wave 3 is quite close.
For the last completed week, price moved sideways. Downwards movement within the week has support from a decline in breadth.
DAILY CHART
Click chart to enlarge. Chart courtesy of StockCharts.com.
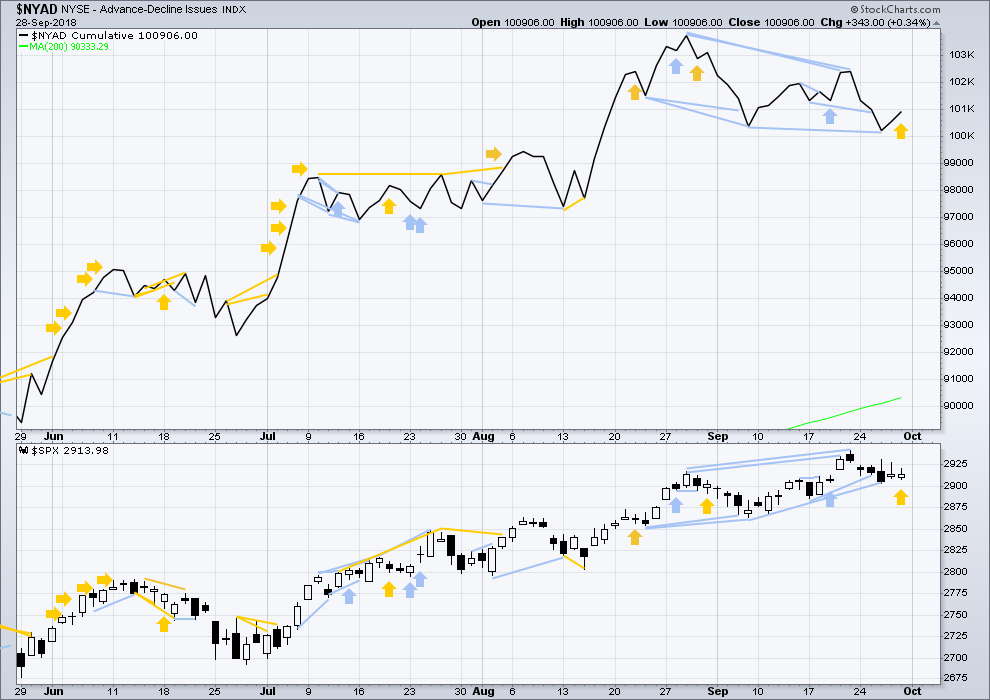
There is normally 4-6 months divergence between price and market breadth prior to a full fledged bear market. This has been so for all major bear markets within the last 90 odd years. With no longer term divergence yet at this point, any decline in price should be expected to be a pullback within an ongoing bull market and not necessarily the start of a bear market. New all time highs from the AD line on the 29th of August means that the beginning of any bear market may be at the end of December 2018, but it may of course be a lot longer than that. My next expectation for the end of this bull market may now be October 2019.
Breadth should be read as a leading indicator.
For Friday price moved lower, but market breadth has improved. This divergence is bullish for the short term.
There is now a cluster of bearish signals at the daily chart from the AD line; this offers now some reasonable support to the new alternate Elliott wave count.
All of small, mid and large caps made new all time highs on the 27th of August. There is a little divergence here in breadth with large caps continuing to make new all time today and small and mid caps lagging.
DOW THEORY
The following lows need to be exceeded for Dow Theory to confirm the end of the bull market and a change to a bear market:
DJIA: 23,360.29.
DJT: 9,806.79.
S&P500: 2,532.69.
Nasdaq: 6,630.67.
All of DJIA, DJT, S&P500 and Nasdaq have made recent new all time highs. This provides Dow Theory confirmation that the bull market continues.
Charts showing each prior major swing low used for Dow Theory may be seen at the end of this analysis here.
ANALYSIS OF THE END OF INTERMEDIATE WAVE (3)
TECHNICAL ANALYSIS
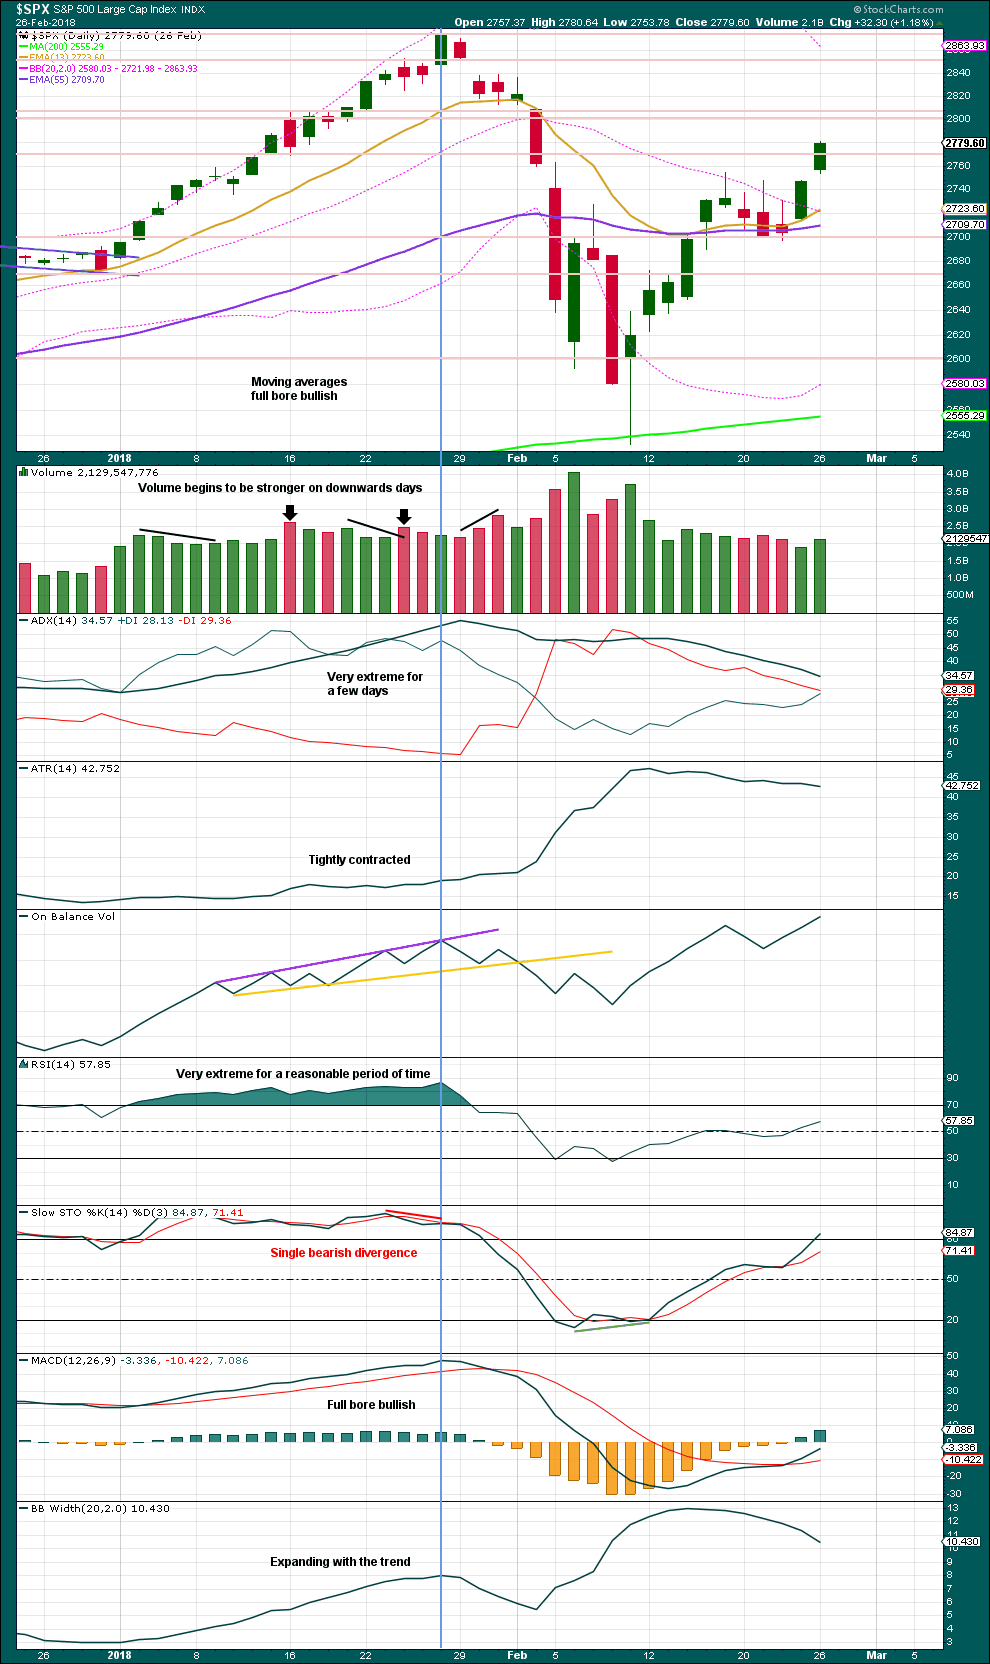
Click chart to enlarge. Chart courtesy of StockCharts.com.
This chart looked overly bullish at the end of intermediate wave (3). The only warning in hindsight may have been from volume spiking slightly on downwards days. There was no bearish divergence between price and either of RSI or On Balance Volume.
Single bearish divergence between price and Stochastics was weak, which is often an unreliable signal.
VIX
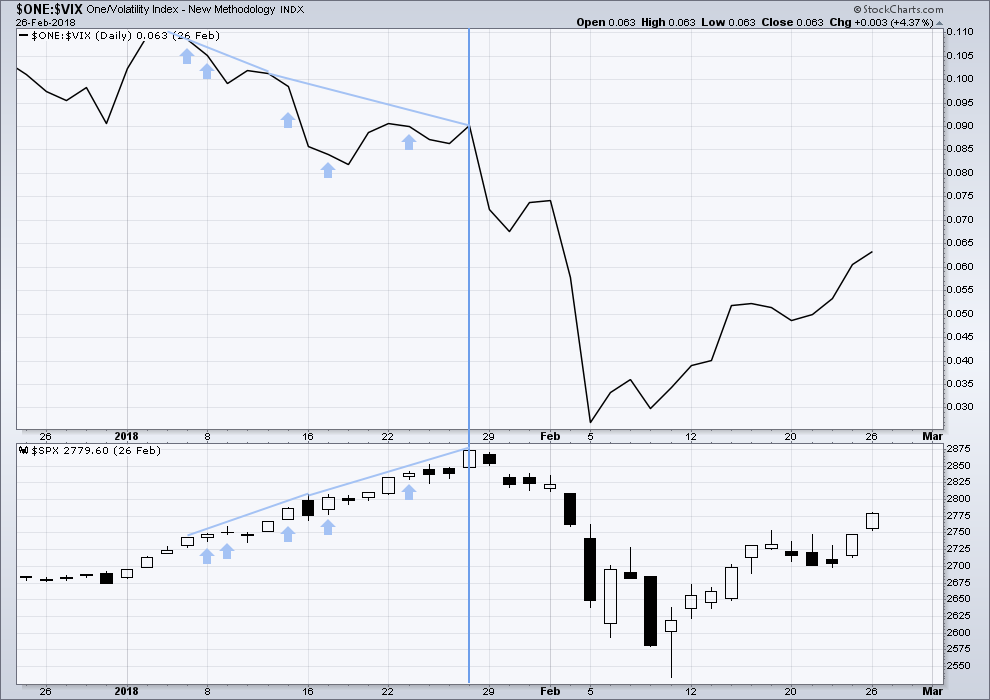
Click chart to enlarge. Chart courtesy of StockCharts.com.
This is a daily chart.
The strongest warning of an approaching intermediate degree correction at the daily chart level came from inverted VIX.
There was strong double bearish divergence at the high of intermediate wave (3), which is noted by the vertical line. There was also a sequence of five days of bearish divergence, days in which price moved higher but inverted VIX moved lower.
AD LINE
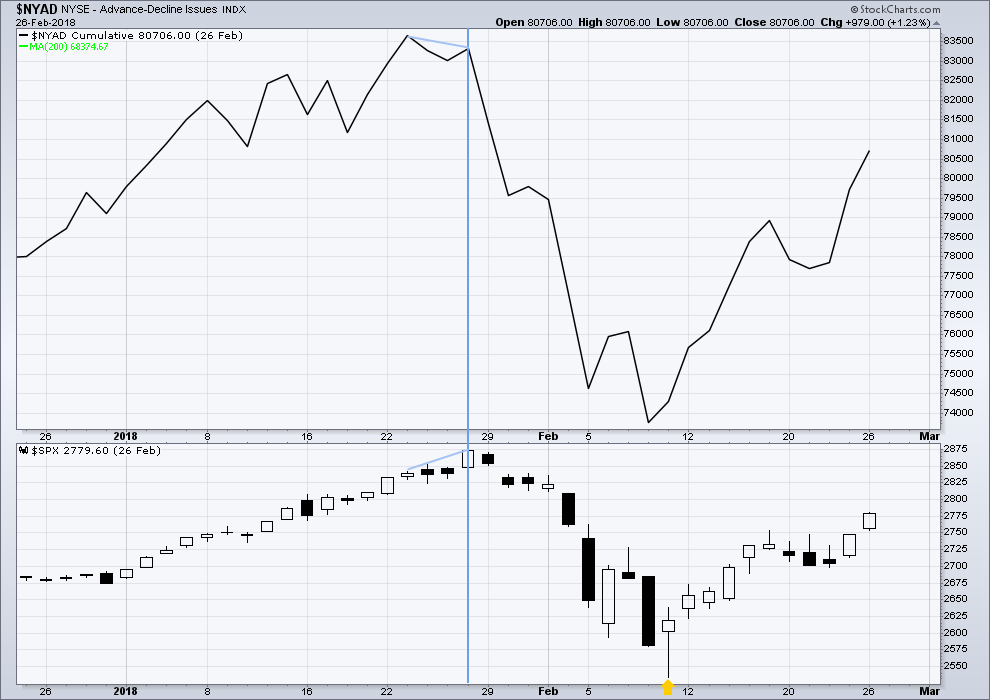
Click chart to enlarge. Chart courtesy of StockCharts.com.
This is a daily chart.
There was only single bearish divergence between price and the AD line at the end of intermediate wave (3). Approaching the high, there were no instances of price moving higher and the AD line moving lower.
Conclusion: When studying the behaviour of price and these indicators just before the start of intermediate wave (4), we may see some clues for warning us of primary wave 4. A cluster of bearish signals from VIX along with a bearish divergence from price and the AD line or On Balance Volume may warn of primary wave 4. The next instance will probably not behave the same as the last, but there may be similarities.
At this time, it does not look like primary wave 4 may begin right now, but we need to be aware of its approach.
Published @ 11:42 p.m. EST.
—
Careful risk management protects your trading account(s).
Follow my two Golden Rules:
1. Always trade with stops.
2. Risk only 1-5% of equity on any one trade.

Sorry, but Truth and Results matter.
The Truth is the American people have been given from god a results driven policy maker! 1st time in Decades… and those results do have an effect long-term on what everyone here is doing.
To ignore the achieved results is just dishonest or blind to the facts! It all does effect everyone’s trading, except for the day traders of course.
I didn’t get to read the divisive comments to my initial post and that is unfortunate!
It wasn’t really that divisive Joseph. Only a little.
The subject of Mr Trump has been divisive here before, and so I have decided to ban him as a topic. Because I have to be consistent.
The US economy and trade deals are most certainly appropriate topics for this forum. And relevant to markets and trading, even from an EW perspective.
Okay guys, another reminder.
I will delete any and all comments, including links, to any and all discussion on the topic of sexual assault.
That topic is completely and utterly banned from my websites.
Thank you all for your co-operation.
The last hour of trading really did seem like the alternate hourly in play, however we did bounce back pretty good from the bottom and it’s continuing futures markets. It might be another 1,2 for the main hourly also…
Can’t wait to read tonight’s analysis… it really is getting confusing with seemingly rapid impulses both up and down…
Anyone notice today how NDX made a new intra-day all time high, and then sharply reversed… That may have been a final push to complete a 5th wave impulse from the last swing low on 9/7/18… basically intermediate 5 of primary 3 for NDX?
I do realize the different markets have different counts… very evident with what happened to RUT today…
Wow, every rally is being faded hard. Bears have clearly wrestled away control here. RUT is getting obliterated. Breadth is down and VIX is up. The gap up is about to be closed. Expecting to see VIX at 80 within a few weeks and for multiple large banks to fail.
Per usual, there will be no exogenous event to trigger the selloff. Just good old fashioned panic selling.
I do note that while RUT is bloody, it’s well within the recent norms for corrections; I’ve put in the 3 largest most recent correction projections to show that. I do have RUT at the weekly tf now in a down trend, but the monthly is still “up”. If pressed I’d say a buy opportunity is setting up…but of course knowing there’s an SPX P4 lurking is a major concern and mitigating factor.
This is some of the most bearish price action of seen across ALL the indices in months. Since February to be exact. Wouldn’t be surprised if Goldman Sachs aka “50 cent” pulls another fast one on us and sends VIX to 50 overnight. Remember the intraday dips in February that saw the Dow fall 1500 points? Those will look mild compared to what Goldman has in store for us in the near future. Per usual they are trying to pump the commodities like they did in 2008. Not sure if it will work this time but there could be some fantastic entries here if that’s their thinking.
The NYSE Advance-Decline Line for September looks ugly. Lara has addressed this divergence in that it can continue for some time but that it may be an advance signal of the arrival of Primary 4.
I’m deleting the comment about DJT and all comments that follow it.
Normally I would allow comments on matters not directly related to markets and trading.
But the sole exception at this time is DJT. Because he is so very divisive. I do not want division and disharmony within the membership. So please, no more comments on DJT.
That’s pretty offsensive to refer to the US president, who one a substantial majority of delegates, as divisive an eliminate all calm and centered dialogue regarding a positive development created by him today. Just sayin…..
The fact is that every time he is commented upon here in this forum, it is divisive.
That is what I meant.
And I don’t want division in this forum.
What you’re really saying is that truthful and factual statements will be culled if deemed offensive by the moderator. All leaders and all politics are divisive. A positive move for small business and one that opens trade and allows consumers the chance at lower prices for diversified food options is not divisive nor should be considered offensive
You are free to discuss trade deals, that’s fine. Particularly as it affects markets.
Silly me. No wonder I did not understand what was going on. I thought DJT was Dow Jones Transportation Index. Silly me.
Was going to say the same thing but you beat me to it.
I’ve just realised how confusing that may have looked.
Thank you kindly Lara.
Dear Lara:
I will respect your wishes as the forum belongs to you.
Having said that, there was absolutely nothing divisive about what Joe and Jerry said this morning except that one member CHOSE to take offense. I have been on the forum for quite a long time and members expressing differing points of view on various and sundry matters has always made the forum an interesting and lively place. While conversations can somtimes become heated, that is less a function of the topic than it is of lack of self-control on the part of some participants. Just my humble opinion.
Have a great trading week everyone!
I did not “take offense”.
I made a polite request in response, and cited my reasons.
You are absolutely incorrect, most of the comments were 100% political regarding who supports the US POTUS, and what’s going to happen in the November election. If you don’t think those subjects are divisive…I don’t know what to say.
Thank you again Lara for the absolutely correct decision here.
I just don’t want any comments about the POTUS here. Because every time it happens, there is some division.
You can all be free to disagree with me, but my decision will stand.
And you’re right actually Verne, it wasn’t a particularly divisive comment thread this time.
But it has been a divisive topic here before, and if I allow it then it probably will be so again. So really, I have to be consistent.
Good morning everybody.
For the main count it’s now back to this, seeing minute wave ii as over.
I’m labelling minuette (i) incomplete.
A new all time high would see the bearish alternate again invalidated, at that stage I’d start to move the invalidation point for this main count higher. But not before that happens.
Alternate hourly chart updated:
May need one small final new high to complete the impulse for minuette wave (c)
Here they come with the VIX smash…gap down is a leveraged play…chances are it gets unwound, and soon… 🙂
I just loaded up on November VIX 15 calls. Going all in on volatility. Literally can’t lose on this one.
I`m a newb; can someone in plain words explain what`s going on in the market today? Looks like it’s going very bearish… with P3 ending here???
I think we’re all trying to figure that out. There’s no confirmation. Just some candles with long upper wicks and divergence with the advance/decline line… market goes up and down very fast, which in of itself I think is a sign we’re nearing end of P3 also…
also my GOGO is on the go go
Nice pop on VIX calls. Anyone else took the freebie? Come on now, don’t be shy and share…. ! 🙂 🙂 🙂
If Nasdaq prints a red candle, DJIA and SPX offering you free money…! 🙂
VIX bull flag. Ideally, we want to see a gap higher out of a series of ’em….
Peter S, did you short ES after you exited long trade on this morning’s ramp?
Just curious…. 😀
just sold…. my first year trading ES, still so much to learn
but re entered at the 0.618 with tight stop, slightly smaller position
and I love triangles, but I see them everywhere
O.K. People. Here is a great big hint.
If you step back and take a bird’s eye view of the indices, in some of them you can see some fascinating fractal moves out of a series of triangles. Ordinarily, the measured rule would apply to the most recent triangle exit. It would be interesting if a move down strings ALL the measured moves from the triangles together….! 🙂
Despite the predictability of triangles, it really is amazing how timid most traders are when it comes to aggressively trading them….talk about ignoring “bread and butter” trades! 🙂
A VIX move above 13.22 and that’s all she wrote for this move up….
This has nothing to do with market and trading.
This is a markets and trading forum. I beg that we stay on subject, because I have less than zero interest in hearing anything political here.
yeah, I first thought it was a Dow Jones Transportation comment…..
Kevin with all due respect, you do not own the forum.
Unless Lara objects, members are free to make polite comments about non-market economic market matters.
Be a big boy and simply ignore comments not directed to you specifically. I appreciated Joe’s comment on the trade deal as well as Jerry’s comment, although I had a different view, on likely market action around the elections.
Nor do you, and it is perfectly reasonable to make a request.
This has been a pleasant place w/o the politics. Let’s not degrade back to that again, please.
RUT printing red.
Will we see a MOABEC today?!
Didn’t expect TLT to come down this low as the 10 year note is only down a fraction. Looks like the money is flowing into stocks. The low from May is not that far away at 116.09. If it breaks that it might be in trouble…
Smoke and mirrors! 🙂
Continuing the secular up trend in interest rates.
The 116 level has been the bottom of key resistance for some time. I could use a solid break below, myself. But more bouncing in this range wouldn’t be the least surprising.
Interesting goings on in PM futures market.
It would appear the CBs want to continue accumulating the metals at current prices.
Recent naked short dump ( @ 100 ounces per contract) was 2 BILLION! I would like to meet the retail investor or hedge fund manager who throws around that kind of moolah.
A few years ago that kind of dump would have seen at least several days of decline for at least a 5% dive. It just ain’t happening!
Hi Verne….interesting. Can you explain where you got that data? Is it in the COTs?
Yep.
HAHA, that made me smile. It’s not any sillier than TSLA. Shocked is no where near the correct word.
The commercials for gold took off 15 K long positions and 17k (approx) short positions, basically going net long 3 k if you look at the futures and options combined. The specs went about 3 k short and now have about 210 k contracts net short. That net short position according to my calclulation is about 210K x 100 ounces per contract x 1200 ounce = 25 billion short. Now that is not net since they have about 177K long. Usually at a top the Specs are net long about 250K contracts. So right now we are about 33 K net short on the speculators (177 – 210K = -33K). This is the highest net short position for the specs in 15 plus years I believe. The commercials are net long (bankers jewelers, etc) about 20K contracts. They have been accumulating gold as you have said. Market is waiting for a trigger. What might it be? China trade agreement? This could also push the market up one last time before the elections to a new high. I’m guessing the president is holding that in his back pocket if needed and will try to stoke the market one last time….before the elections
My numbers ….please feel free to correct/ admonish as this is how I understand it.
http://news.goldseek.com/COT/1538162818.php
If we go to about 250K net long in the next move up that would mean the specs would have to have a combined buy and short covering of about 283 K contracts. I get that from (250k avg net long specs + 33 K contracts currently net short). I’m using a ballpark figure to get the point across, could be more or less. The net buying to push the market up to 283 k contracts would then be 283,000 contracts x 100 ounces per contract x 1200 per ounce = 34 billion dollars. That is the amount in my estimation we would need for the next move up to stall. I believe that would push us up to the 1350 range or more.
Access for American dairy farmers a very big deal.
I did not think he could pull it off.
My Manchego is going up for certain! 😀
Very big big deal indeed. Kinda shocked to be honest. Great for everyone on all sides!!!!
Buying October 24 12.50 strike calls for 1.65.
Money lying in a corner, as the legendary Jim Rogers observed! 🙂
Thrust from triangle absolutely classic!
Price spiked higher than anticipated, probably juiced by trade agreement. Adding to DIA puts on move up. More conservative entry on move back to gap area below 2920.
No doubt the banksters will fight gap closure tooth and nail. Battle should be interesting! 🙂
thanks for the weekend commentary, kept my ES contracts open and rang the register today!
Awesome! 🙂
with the election less than a month off all strings will be pulled to keep the market up. China deal or partial deal may be next if the market flounders.
I have a different view. The banksters hate Trump. For those of you paying attention, they have already sent him a message that they control the markets, particularly the FANG cohort. ‘Nuff said!
Folks, for what it’s worth from an industry insider, Verne is not wrong. He’s there fall guy, it’s all about timing.
Banksters just pissed that he can’t be bought! That’s why the more than 55% of the American people either support him 100% now or 75% will next time up.
What I see.
Right up where Lara called II (c) to end on one of her alternates…..we will see if we get new highs.
Her price targets are uncanny! 🙂
This the count that I have used for a while which I think is playing out well. All over lapping waves for an ending diagonal 5th. I adopted this right after the wave 2 pull back which looked like a 3 wave move to me and which has since been overlapped. Looking for a 5 wave move up from todays lows to slight new highs to complete wave 5 and kick off primary wave 4 down. Just my two cents which is about all its worth . LOL
Futures up 16, what a roller coaster
Thank you Lara!
I am an absolutely awful chartist, but I often have a pretty good instinct about what Mr. Market is up to. I never cease to be amazed at how often Lara will precisely chart exactly what I was thinking and that triangle in the main chart is a great example. The E wave down would correspond nicely with the idea of a sharp move down on Monday. Of course the main count expects a sharp reversal with resumption of the upward trend, but obviously there is the possibility that the break could be upwards for the more bearish scenario. The big takeaway is that we are going to have a pretty good idea of what Mr. Market is up to depending on which way the triangle breaks!
Awesome analysis Ms. Lara…simply awesome!! Enjoy your weekend! 🙂 🙂 🙂
Oops! I meant the “C” wave down (but you knew that! ) 🙂
thanks Verne!
I have had a quite nice weekend. Surfed Saturday, only about 2ft but it was glassy and I got lots of nice long lefts. So I’m refreshed.
Firsht! 🙂
Have a great weekend everyone…