
Downwards movement remains above the last swing high. At this time, a series of higher highs and higher lows (the definition of an upwards trend) remains in place.
Another signal today from the AD line indicates a new alternate Elliott wave count may be correct.
Summary: The last gap is now closed, which may have prompted members to close long positions (if advice on stops was taken).
The next step is to let price tell us if primary wave 3 is over or not.
While price remains above 2,864.12, then this may still be another pullback within an ongoing upwards trend. The target is now at 3,012.
If price makes a new low by any amount at any time frame below 2,864.12, then some confidence that primary wave 4 has begun may be had. Targets are either 2,716.89 or 2,578.30. There is now enough bearishness from the AD line to take this possibility fairly seriously. Primary wave 4 is expected to be a large choppy consolidation, which may last about a Fibonacci 13 weeks.
The final target for this bull market to end remains at 3,616, which may be met in October 2019.
New updates to this analysis are in bold.
The biggest picture, Grand Super Cycle analysis, is here.
Last historic analysis with monthly charts is here, video is here.
MAIN ELLIOTT WAVE COUNT
WEEKLY CHART
Click chart to enlarge.
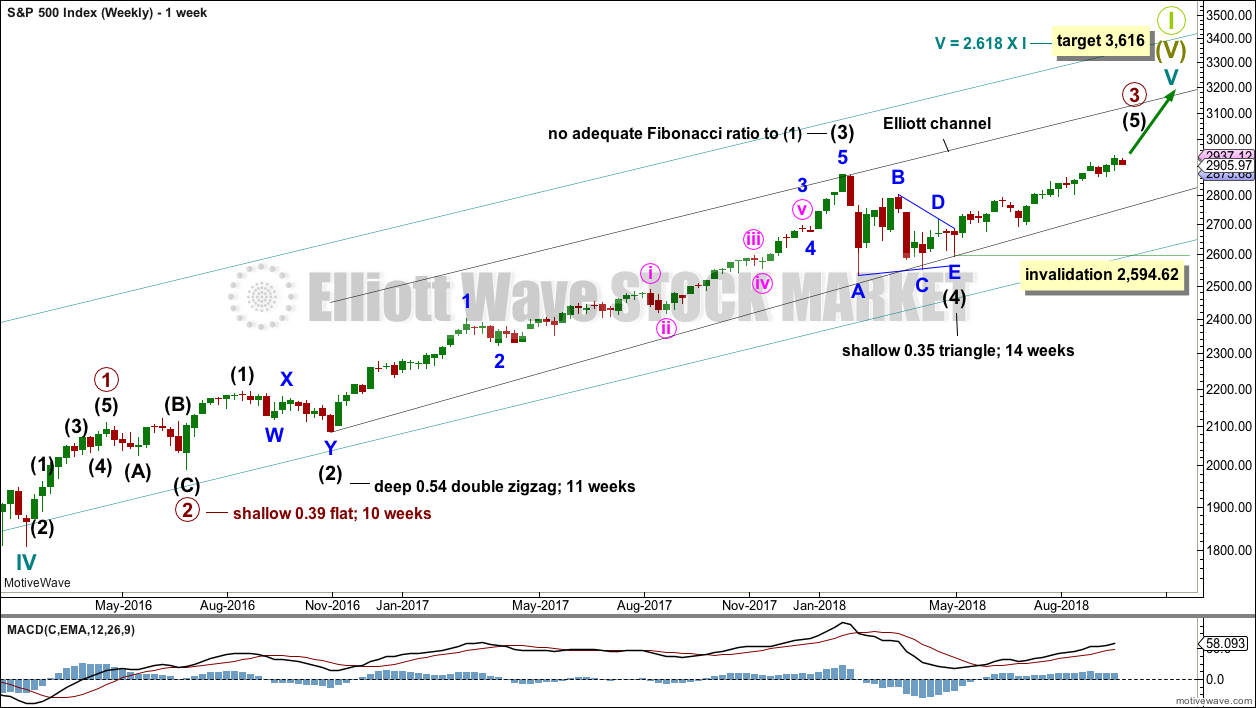
Cycle wave V must complete as a five structure, which should look clear at the weekly chart level and also now at the monthly chart level. It may only be an impulse or ending diagonal. At this stage, it is clear it is an impulse.
Within cycle wave V, the third waves at all degrees may only subdivide as impulses.
Intermediate wave (4) has breached an Elliott channel drawn using Elliott’s first technique. The channel is redrawn using Elliott’s second technique: the first trend line from the ends of intermediate waves (2) to (4), then a parallel copy on the end of intermediate wave (3). Intermediate wave (5) may end either midway within the channel, or about the upper edge.
There is perfect alternation and excellent proportion between intermediate waves (2) and (4).
At this stage, the expectation is for the final target to me met in October 2019. If price gets up to this target and either the structure is incomplete or price keeps rising through it, then a new higher target would be calculated.
DAILY CHART
Click chart to enlarge.
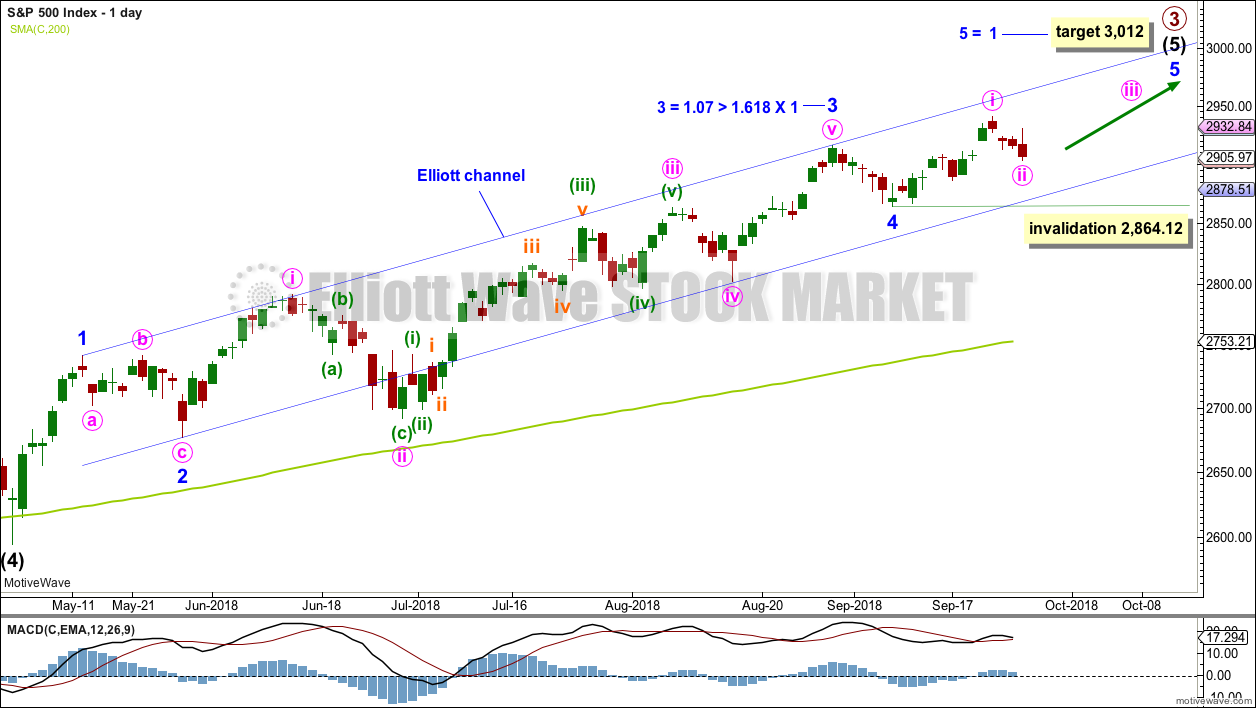
Intermediate wave (5) avoided a truncation now that it has a new high above the end of intermediate wave (3) at 2,872.87.
Intermediate wave (3) exhibits no Fibonacci ratio to intermediate wave (1). It is more likely then that intermediate wave (5) may exhibit a Fibonacci ratio to either of intermediate waves (1) or (3). Intermediate wave (5) has passed equality in length and 1.618 the length of intermediate wave (1). The next Fibonacci ratio in the sequence is 2.618 giving a target at 3,124. If the target at 3,012 is met and passed, then this would be the next calculated target.
A target for intermediate wave (5) to end is re-calculated at minor degree.
Intermediate wave (5) is unfolding as an impulse, and within it minor waves 1 through to 4 may now all be complete.
Within intermediate wave (5), minor wave 3 was extended. Minor wave 5 may also extend.
Minute wave ii may not move beyond the start of minute wave i below 2,864.12.
HOURLY CHART
Click chart to enlarge.
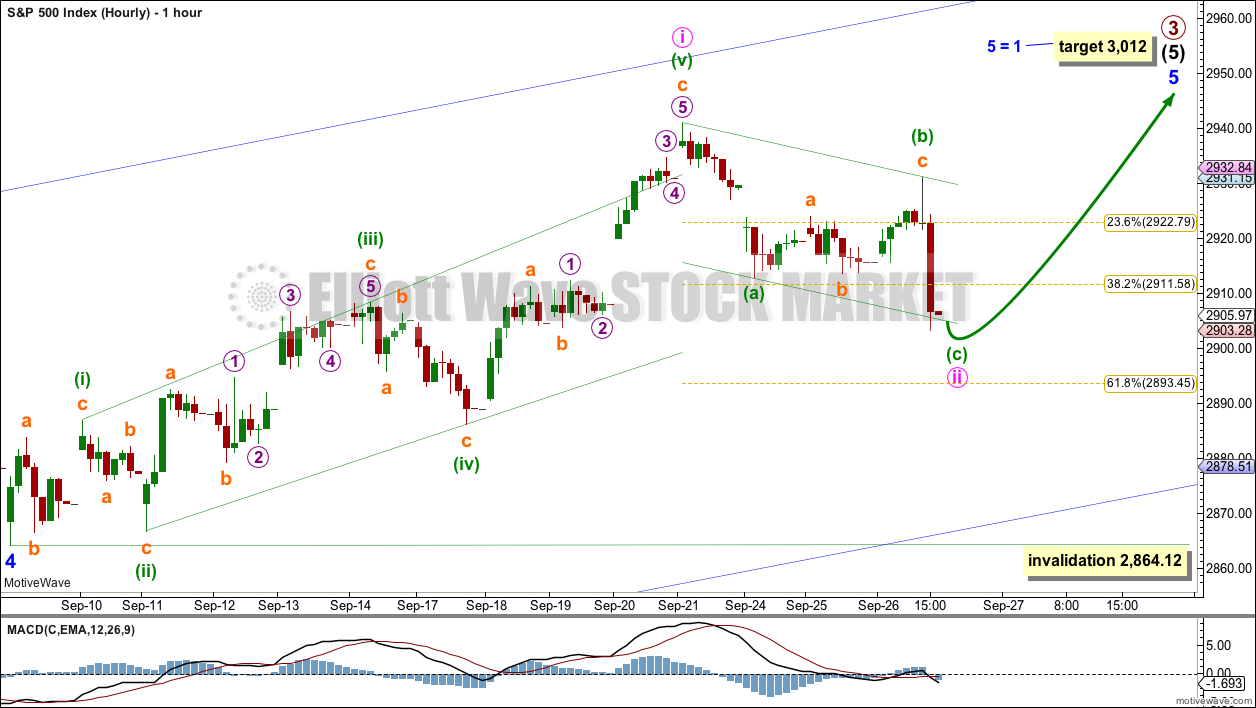
If minor wave 5 extends, then it may have begun with a leading expanding diagonal for minute wave i.
Minute wave ii fits as an almost complete zigzag on the five minute chart. Minuette wave (c) looks like it needs at least one slight new low to complete a five wave impulse. Minuette wave (c) at today’s low is very close to equality in length with minuette wave (a) and ends about the lower edge of a channel.
If minute wave ii continues lower than expected, then it may end closer to the 0.618 Fibonacci ratio of minute wave i at 2,893.45.
Minute wave ii may not move beyond the start of minute wave i below 2,864.12.
ALTERNATE ELLIOTT WAVE COUNT
DAILY CHART
Click chart to enlarge.
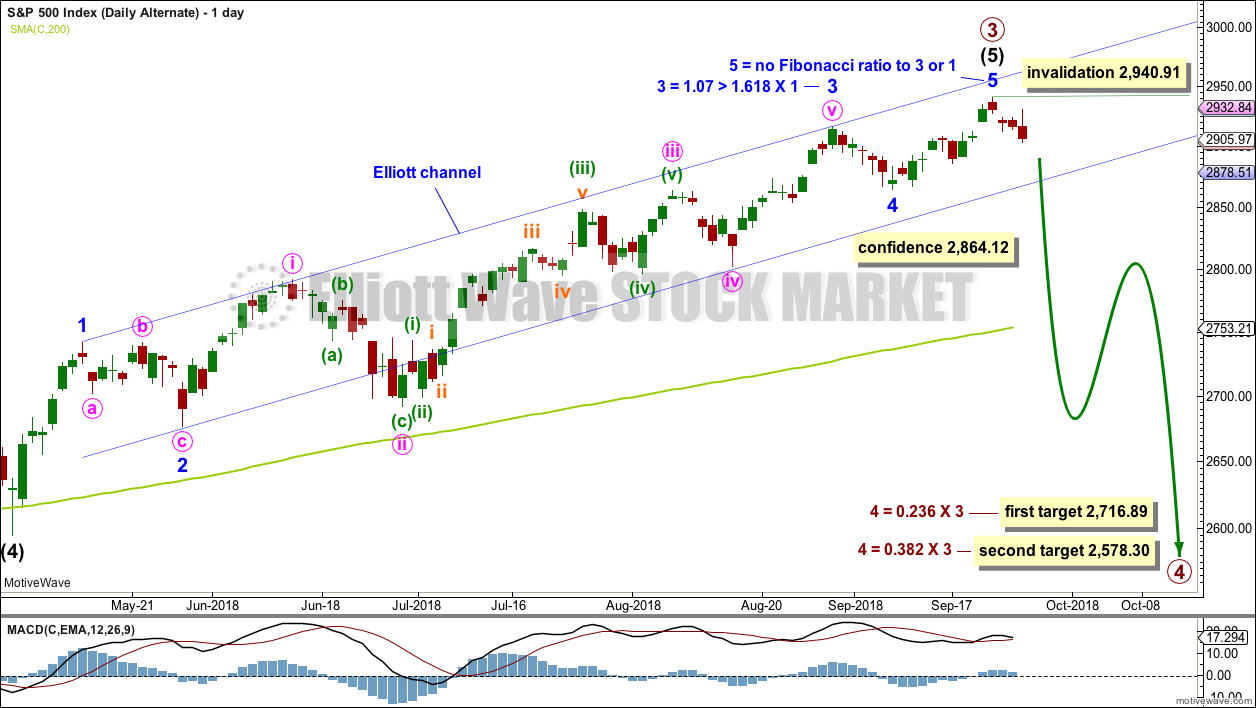
It is possible to see now that primary wave 3 could be over at the last high four sessions ago by simply moving the degree of labelling within minor wave 5 up one degree.
It is reasonably common for the S&P to exhibit a Fibonacci ratio between two actionary waves within an impulse, and uncommon for it to exhibit Fibonacci ratios between all three actionary waves within an impulse. The lack of a Fibonacci ratio for minor wave 5 within this wave count is not of any concern; this looks typical.
Primary wave 4 would most likely end somewhere within the price territory of the fourth wave of one lesser degree. Intermediate wave (4) has its price territory from 2,872.87 to 2,532.69. Within this range sit two Fibonacci ratios giving two targets. The lower 0.382 Fibonacci ratio may be more likely.
Primary wave 2 unfolded as a shallow regular flat correction lasting 10 weeks. Primary wave 4 may exhibit alternation in structure and may most likely unfold as a zigzag, triangle or combination. A zigzag would be the most likely structure as these are the most common corrective structures and would provide the best alternation with primary wave 2.
Primary wave 4 may not move into primary wave 1 price territory below 2,111.05. However, the lows in primary wave 4 should not get close to this point. The lower edge of the teal channel on the weekly chart should provide very strong support.
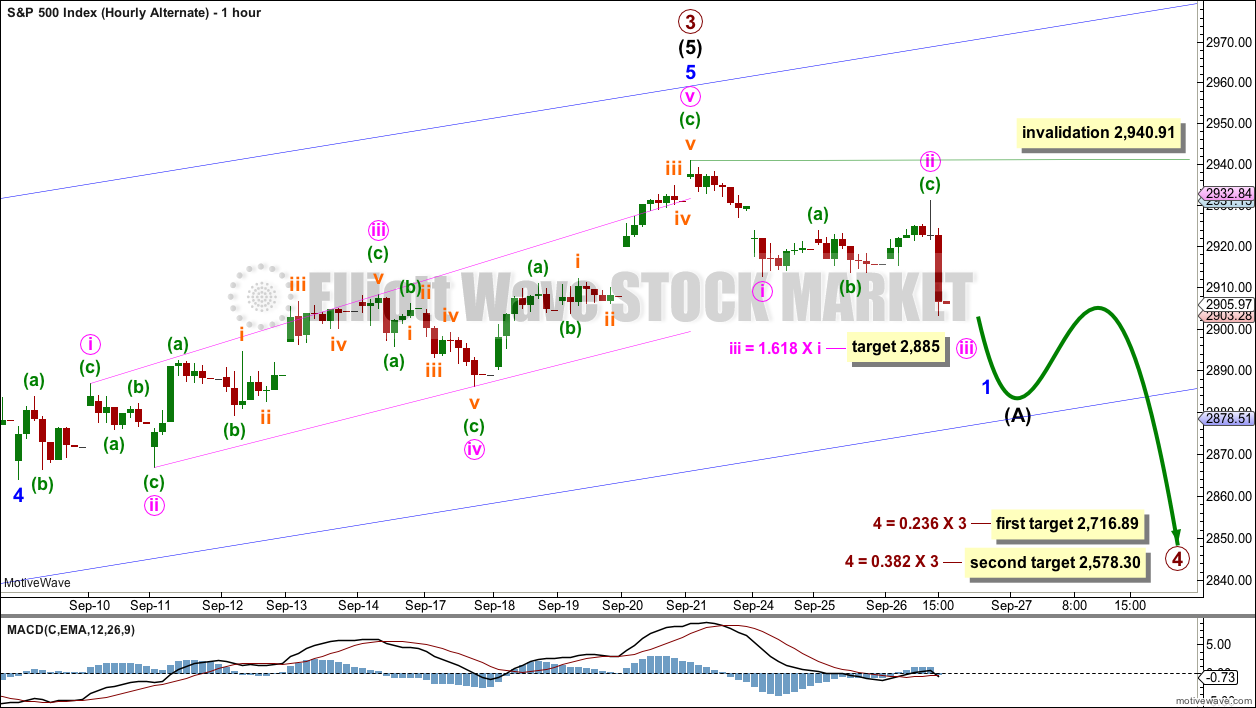
HOURLY CHART
Click chart to enlarge.
A movement at primary wave degree should begin with a five wave structure downwards. So far that would be incomplete.
The first five down may be labelled minor wave 1. So far minute waves i and ii may be complete. If minute wave ii moves any higher, it may not move beyond the start of minute wave i above 2,940.91.
A target that expects the most common Fibonacci ratio to minute wave i is calculated for minute wave iii.
When minute wave iii is complete, then minute wave iv may not move into minute wave i price territory.
TECHNICAL ANALYSIS
WEEKLY CHART
Click chart to enlarge. Chart courtesy of StockCharts.com.
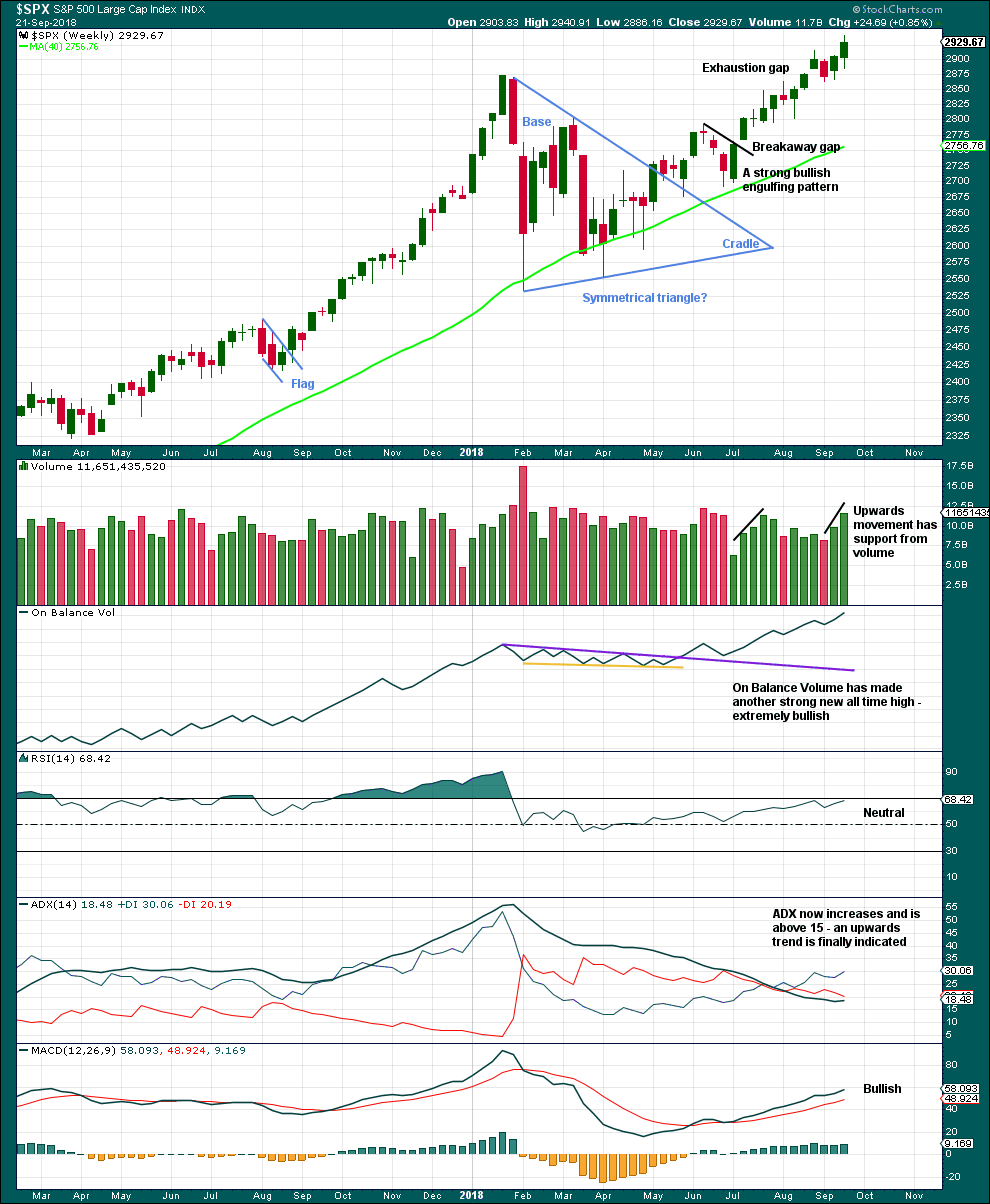
The symmetrical triangle base distance is 340.18. Added to the breakout point of 2,704.54 this gives a target at 3,044.72. This target has not yet been met.
This chart is completely bullish. RSI is not yet overbought, so there is room for price to rise.
DAILY CHART
Click chart to enlarge. Chart courtesy of StockCharts.com.
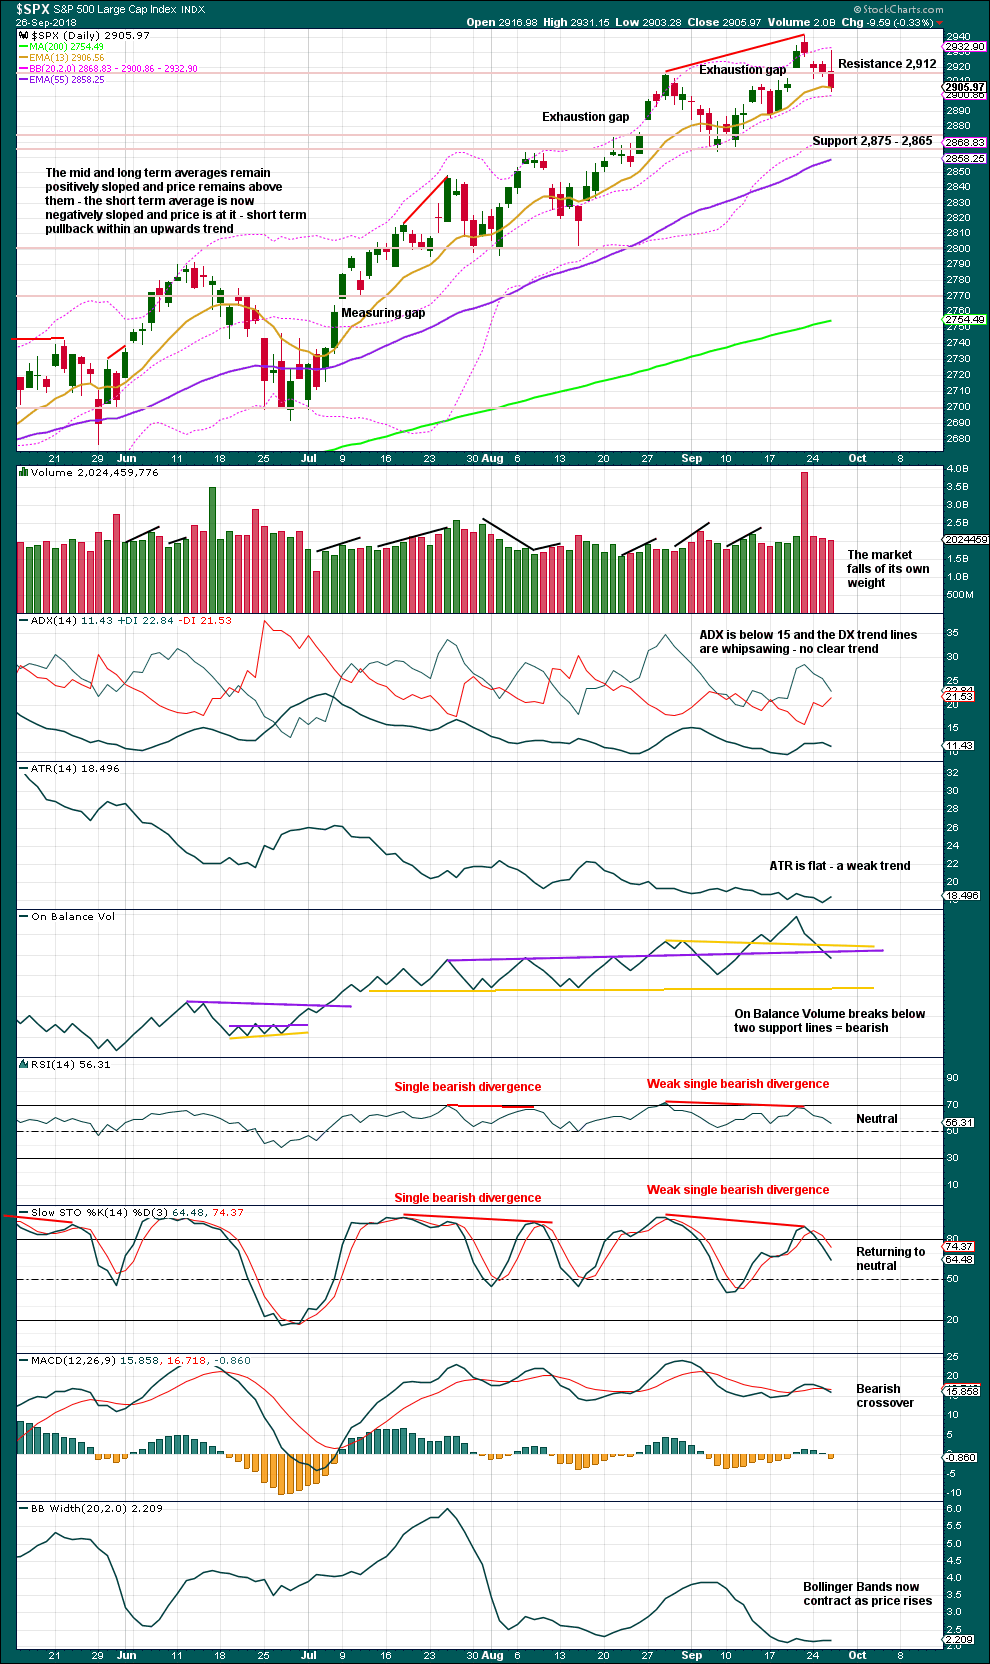
Closure of the last gap is bearish. The gap is now labelled an exhaustion gap.
The long upper wick on today’s candlestick is bearish.
The market is falling of its own weight. Price can continue to fall for a reasonable distance due to an absence of buyers.
On Balance Volume has now given two bearish signals, neither of which are very strong, but the signal today is reasonable.
The bottom line remains though that an upwards trend remains intact until price makes a new swing low. Look now for strong support about 2,875 – 2,865. If price makes a new swing low below 2,864.12, that would indicate a change from an upwards trend to either a larger sideways consolidation or a new downwards trend.
VOLATILITY – INVERTED VIX CHART
WEEKLY CHART
Click chart to enlarge. Chart courtesy of StockCharts.com. So that colour blind members are included, bearish signals
will be noted with blue and bullish signals with yellow.
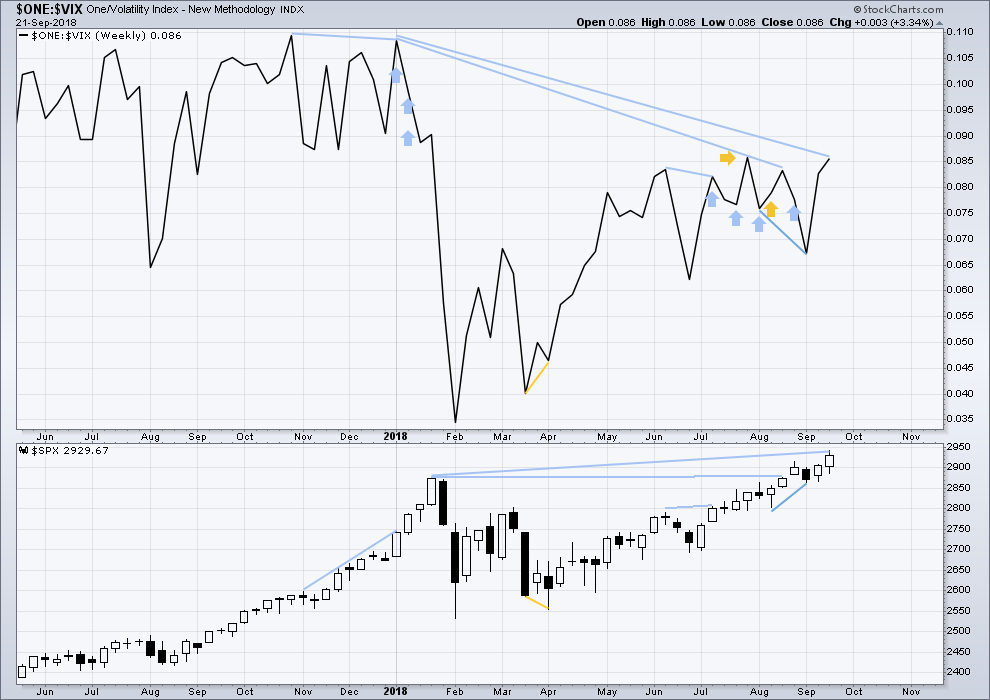
To keep an eye on the all time high for inverted VIX a weekly chart is required at this time.
Notice how inverted VIX has very strong bearish signals four weeks in a row just before the start of the last large fall in price. At the weekly chart level, this indicator may be useful again in warning of the end of primary wave 3.
At this time, there is mid term bearish divergence between price and inverted VIX: price has made another new all time high, but inverted VIX has not. This divergence may persist for some time. It may remain at the end of primary wave 3, and may develop further to the end of primary wave 5.
Upwards movement in price has support last week from a normal corresponding decline in market volatility. There is no new short term divergence.
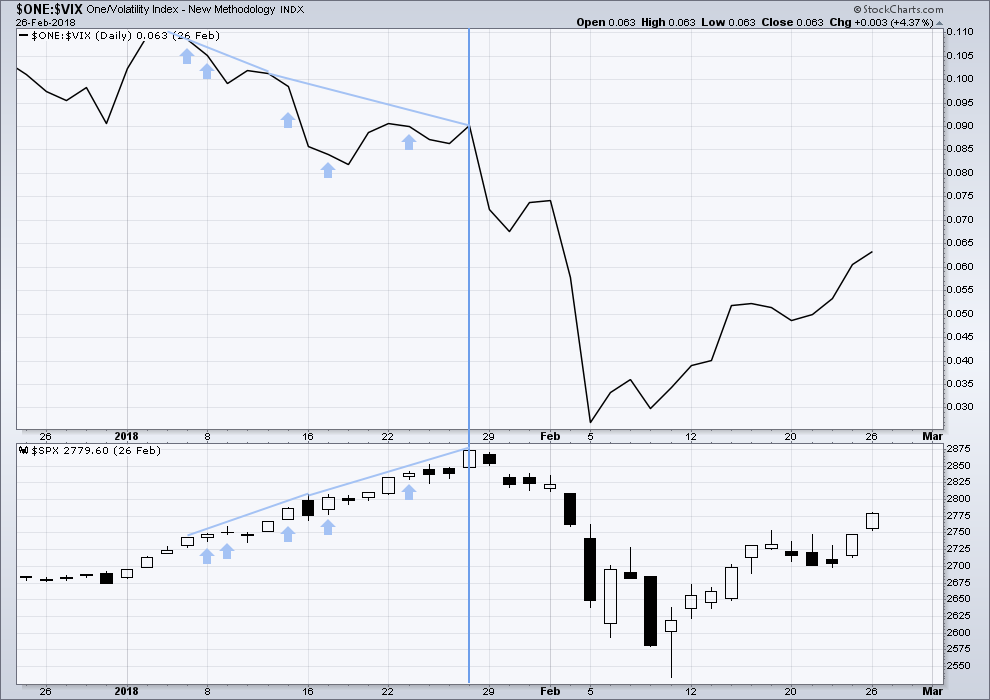
DAILY CHART
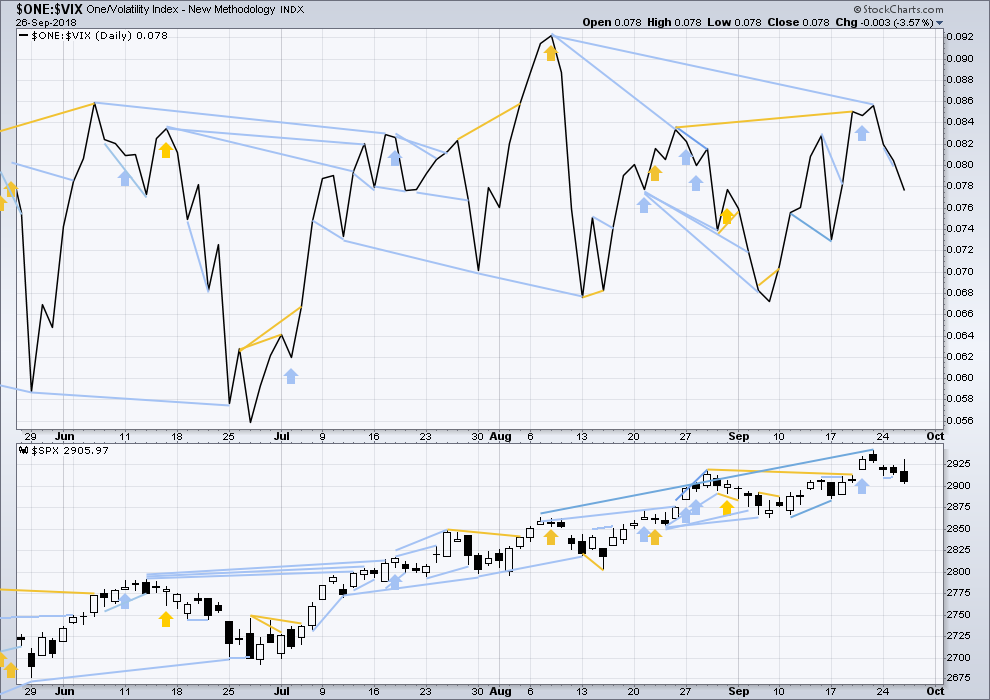
Click chart to enlarge. Chart courtesy of StockCharts.com. So that colour blind members are included, bearish signals
will be noted with blue and bullish signals with yellow.
Normally, volatility should decline as price moves higher and increase as price moves lower. This means that normally inverted VIX should move in the same direction as price.
There is mid term divergence with a new all time high from price not supported by a corresponding new all time high from inverted VIX. This divergence is bearish.
The fall in price today has a normal corresponding increase in market volatility. Volatility is not increasing faster than price is falling. There is no divergence for the short term.
Mid term bearish divergence between price and inverted VIX can be seen on both daily and weekly charts now. However, this may not be a good timing tool in identifying the end of primary wave 3; divergence may develop further before primary wave 3 ends.
BREADTH – AD LINE
WEEKLY CHART
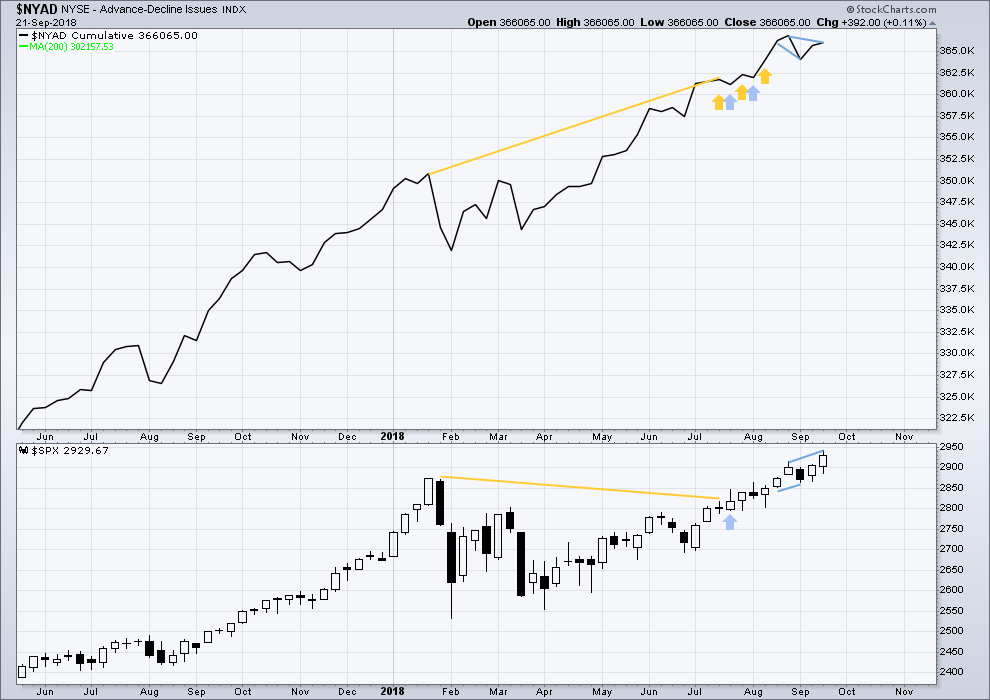
Click chart to enlarge. Chart courtesy of StockCharts.com.
When primary wave 3 comes to an end, it may be valuable to watch the AD line at the weekly time frame as well as the daily.
Price has made a new all time high last week, but it does not have support from rising market breadth. There is now short term bearish divergence at the weekly chart level between price and the AD line. It is possible now that the end of primary wave 3 is quite close.
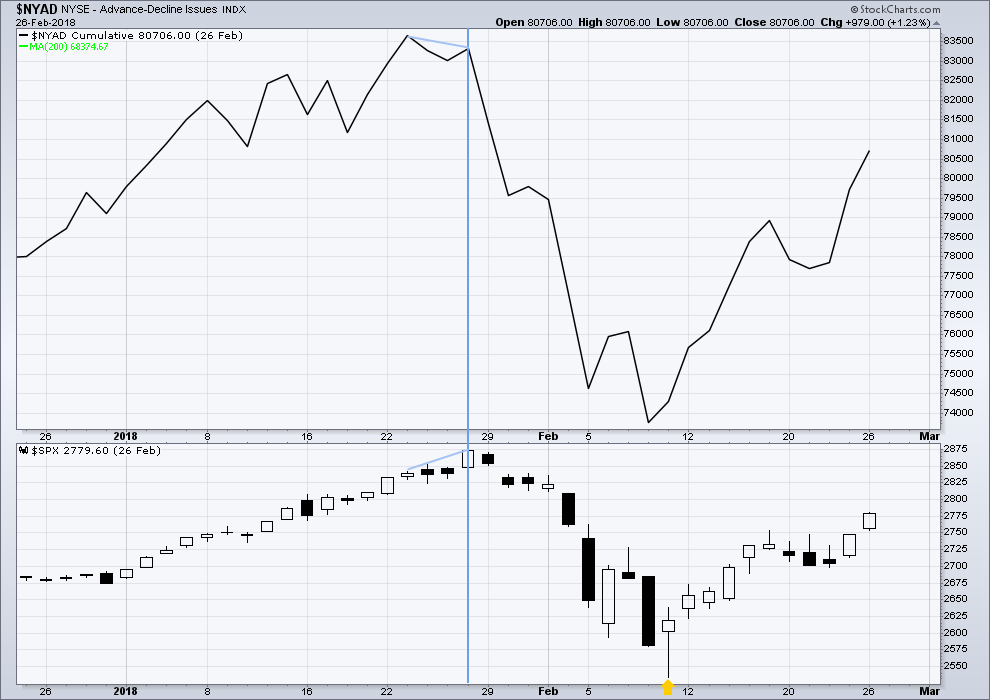
DAILY CHART
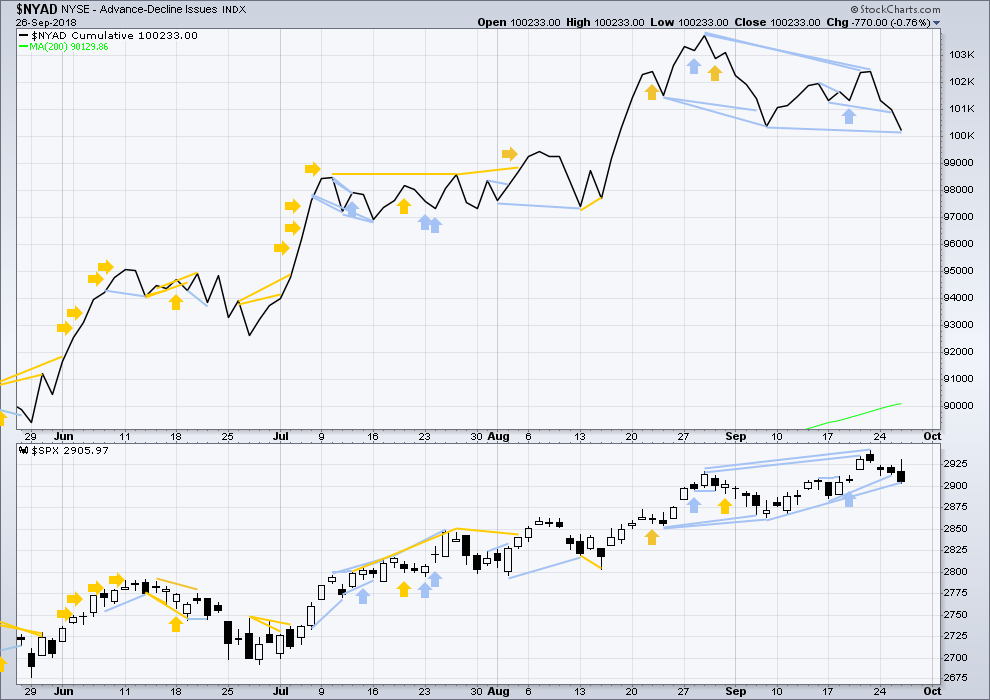
Click chart to enlarge. Chart courtesy of StockCharts.com.
There is normally 4-6 months divergence between price and market breadth prior to a full fledged bear market. This has been so for all major bear markets within the last 90 odd years. With no longer term divergence yet at this point, any decline in price should be expected to be a pullback within an ongoing bull market and not necessarily the start of a bear market. New all time highs from the AD line on the 29th of August means that the beginning of any bear market may be at the end of December 2018, but it may of course be a lot longer than that. My next expectation for the end of this bull market may now be October 2019.
Breadth should be read as a leading indicator.
Price has now made new all time highs last week, but the AD line has not. There is now short / mid term divergence at the daily chart level; this is bearish, and it may develop further before primary wave 3 comes to an end.
The AD line has made a new low today below the prior swing low 14 sessions ago, but price has not. This is short / mid term bearish divergence. There is now a cluster of bearish signals at the daily chart from the AD line; this offers now some reasonable support to the new alternate Elliott wave count.
All of small, mid and large caps made new all time highs on the 27th of August. There is a little divergence here in breadth with large caps continuing to make new all time today and small and mid caps lagging.
DOW THEORY
The following lows need to be exceeded for Dow Theory to confirm the end of the bull market and a change to a bear market:
DJIA: 23,360.29.
DJT: 9,806.79.
S&P500: 2,532.69.
Nasdaq: 6,630.67.
Nasdaq and DJT and now the S&P500 have all made recent new all time highs.
At the end of last week, DJIA has now also made a new all time high. This provides Dow Theory confirmation that the bull market continues.
Charts showing each prior major swing low used for Dow Theory may be seen at the end of this analysis here.
ANALYSIS OF THE END OF INTERMEDIATE WAVE (3)
TECHNICAL ANALYSIS
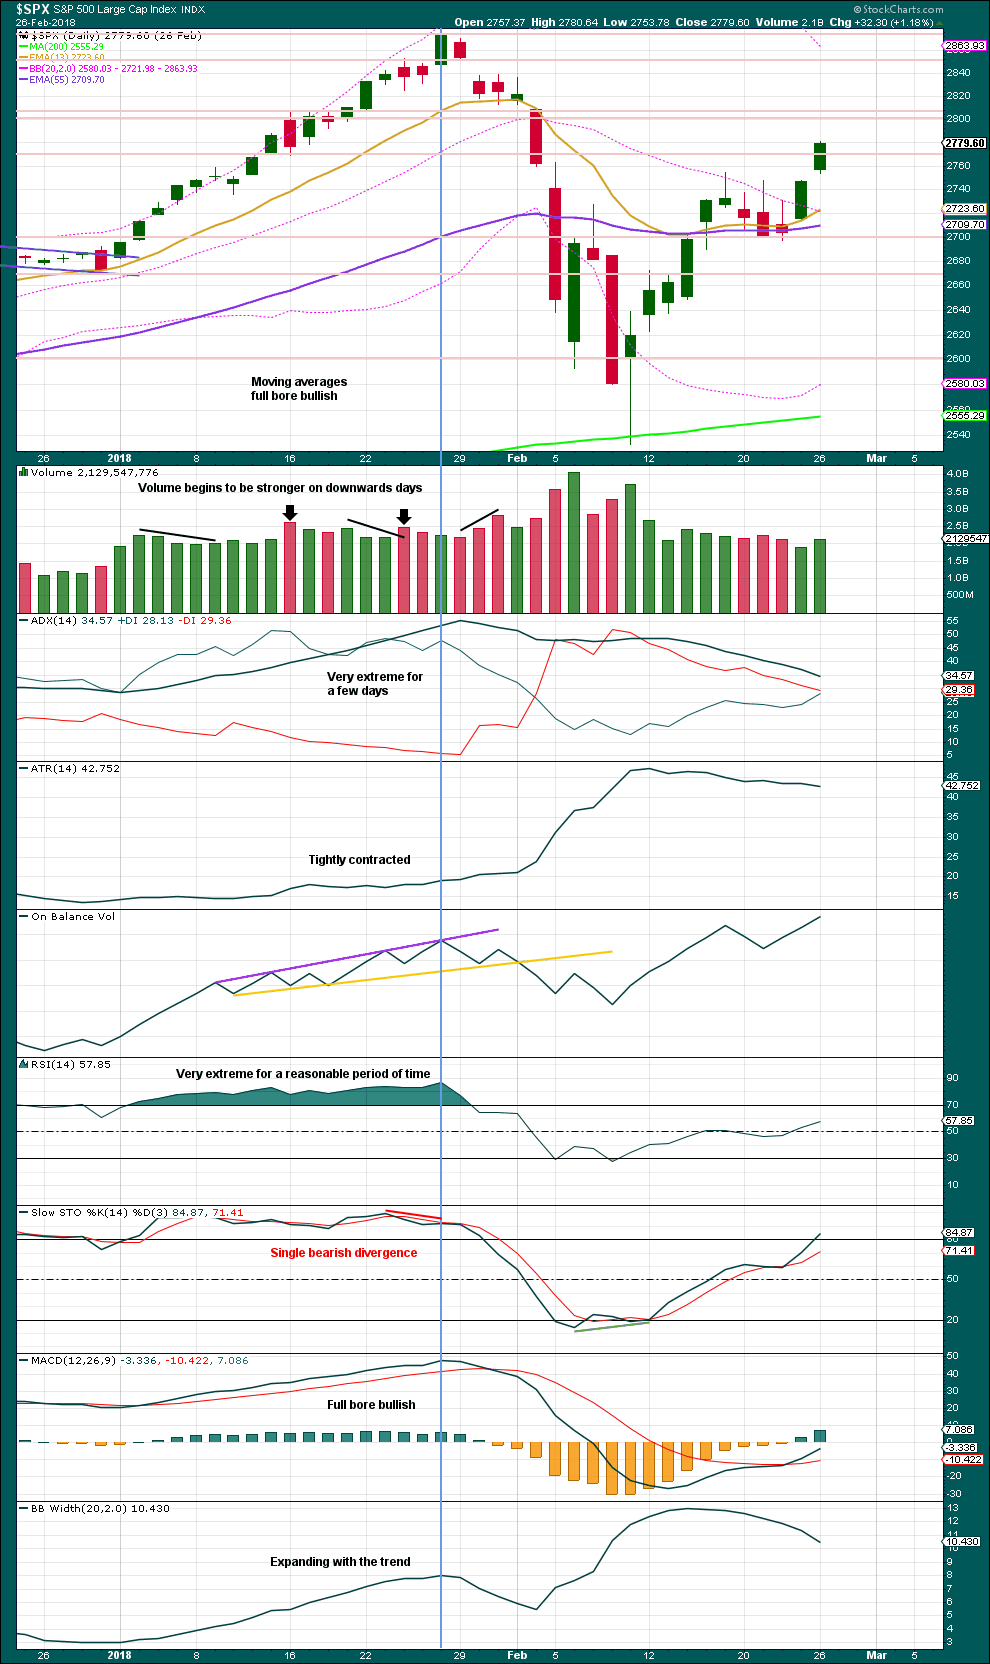
Click chart to enlarge. Chart courtesy of StockCharts.com.
This chart looked overly bullish at the end of intermediate wave (3). The only warning in hindsight may have been from volume spiking slightly on downwards days. There was no bearish divergence between price and either of RSI or On Balance Volume.
Single bearish divergence between price and Stochastics was weak, which is often an unreliable signal.
VIX
Click chart to enlarge. Chart courtesy of StockCharts.com.
This is a daily chart.
The strongest warning of an approaching intermediate degree correction at the daily chart level came from inverted VIX.
There was strong double bearish divergence at the high of intermediate wave (3), which is noted by the vertical line. There was also a sequence of five days of bearish divergence, days in which price moved higher but inverted VIX moved lower.
AD LINE
Click chart to enlarge. Chart courtesy of StockCharts.com.
This is a daily chart.
There was only single bearish divergence between price and the AD line at the end of intermediate wave (3). Approaching the high, there were no instances of price moving higher and the AD line moving lower.
Conclusion: When studying the behaviour of price and these indicators just before the start of intermediate wave (4), we may see some clues for warning us of primary wave 4. A cluster of bearish signals from VIX along with a bearish divergence from price and the AD line or On Balance Volume may warn of primary wave 4. The next instance will probably not behave the same as the last, but there may be similarities.
At this time, it does not look like primary wave 4 may begin right now, but we need to be aware of its approach.
Published @ 08:34 p.m. EST.
—
Careful risk management protects your trading account(s).
Follow my two Golden Rules:
1. Always trade with stops.
2. Risk only 1-5% of equity on any one trade.
HI everyone here
I found a pretty strong pattern going back for the past 7 mid-term elections
5 out of 7 the market went down, Plus the 6th one just was after a nasty recession and bottomed as follows:
10-16-14——– about 9% decline
2010 bad plus we just had a huge decline prior.
2006 flat during the beginning of month bad
10-10-02——– about 6% decline
10-8-98——— about 12+% decline
10-7-94——— about 4+% decline
10-12-90——- about 6% decline
All thoughts would be kindly appreciated.
I think Lara’s second wave count could be correct.
Plus stuff you might know:
Q Ratio is second highest in history from record passing the 1929 high!
Whillshire 5000 to GDP record high just slightly passing the march of 2000 high
S & P 500 to GDP equalling 1960’s Highs and 2000 high
Shiller P/e ratio 2nd highest in history higher now then in 1929
Corporate Debt to GDP is the second highest in history!
We had over 20 hindeburg omens this month the most in over 50 years!
I repeat post tomorrow incase of some of you didn’t catch my post.
Thank You
It is important to think of the price action in terms of relentless CB intervention to arrest it. Today’s price action is precisely what we expected. The key for alert traders is whether CB focused buying can advance this market on what is now paper-thin breadth. I suspect we will soon have an answer! 🙂
I agree with Lara it seems odd there was no follow through after yesterday’s selloff. At the same time, this fade doesn’t inspire much confidence at all.
Well… that’s not what I thought was going to happen today.
I’m going to sit on the fence now and wait until price tells us what it’s up to. I’m going to try and be like Switzerland.
The last hour of yesterday’s session closing that gap looked pretty bearish, but if price can’t keep falling after that it shows there is still bullishness about, and it may be enough to keep on to new all time highs.
Hourly alternate updated:
Two overlapping first and second waves now complete for this wave count, so an increase in downwards momentum expected.
I guess SPX over 2931 (yesterday’s high) would put a stake in models calling this a sequence of 1-2’s down.
I see the market sell off during Kavanaugh hearing breaks, and rally during live testimony. Hey, I’ve got a day-specific market timing tool! Which I will promptly ignore as being of rather low statistical significance.
Overall, my “reasonable confidence” that we are still in P3 up is now “very strong confidence”. But there’s new data coming in every moment so as usual, “we’ll see”.
38 new highs on the NYSE compared to 95 new lows as of now. This may change by the end of the day but the multiple hindeburg omens and this may be a precursor….hard to say when it will turn but it may be dramatic.
Level’s I’m watching for a possible 5 minute trend shift back to “up”….
and now a bounce off ol’ reliable, the 61.8% (2912.5). will it hold…
Also GOGO just hit fibo
I’m still bull. But Opened an small ES short here, very tight stop
If the alternate count is correct in its current form, SPX must remain below the low of Minute wave 1 down at 2912.63.
I just sold some strangling UPRO long positions I could not get to in time yesterday at 2910 SPX. Now 100% cash. I will be looking to go short on completion of the expected Minor 2 correction up to about 2912. That should be sometime next week, I expect.
Well that did not take long. The alternate count, in its current form/labeling, is invalidated. It will need to be relabeled.
Here is a possible count to be considered. The invalidation where iv moves into i is about 2918+.
It must? Oops!!!
All I see on the charts is a small pullback to a major trend line. So far.
Caution is proper. But jumping to conclusions contrary to actual price action can be risky to financial health.
I’m bullish until price action signals that the major daily/weekly trend might be over. No price action indication of that yet. Not even really close yet.
Best of luck today ya’ll.
I guess I should explain, I am just thinking out loud. I am not trying to formulate any conclusions. But rather I am trying to see how the alternate might stay viable in face of this rising SPX price today. I am sorry if I have misled anyone or been unclear about my thoughts. Besides, it is still early and I haven’t even finished my second cup of coffee! A dangerous time indeed.
I wise sage once told me that on the first move down off the highs, price should slice easily through multiple previous pivots. That didn’t happen on this move down from the highs. Just food for through, as devil’s advocate against the growing bearish consensus around here 🙂 I myself think the bearish AD-line signals are quite worrisome. The rumble of trade war jitters growing louder! FWIW, action today seemed very similar to that after the Fed meeting of March 20-21, which saw a pretty steep 150 point decline over the following two days.
If I had to pick a winner, it would be the alternate wave count today.
The last hour of this session changed my view substantially. The AD line now has enough bearishness to be a reasonable indicator of a primary degree wave down here.
But I would rather let price confirm it with a new low below 2,864.12 before calling for primary wave 4 with any confidence.
Just so you all know, that’s the conclusion I drew after going through the process of this analysis today.
I am right there with you, Lara, as my words on the blog and actions in the markets demonstrate today. I will await more evidence before committing myself. But it appears to me that “the worm has turned.” Have a great evening.
Lara re the main daily chart should the trend channel be drawn as Elliott’s type 2 being, at Minor degree, from the end of 2 and 4 with a parallel on the top of 3?
No. That contains quite a lot less than the first method.
A fair question though Peter.
If price doesn’t hold the low today (not impossible, the daily trend line was pierced but not yet fully broken) and starts breaking down more…lots and lots of possible turn levels, but the ones that stand out are the one’s at levels of projections of recent symmetric moves (the two white lines). One of them is to a cluster of fibo’s at 2886-88. The other is to a 78% derived fibo level at 2880. And of course the 62% of the i wave at 2893 stands out as well. So those are the 3 I’ll be watching intently as most likely levels for a turn followed by buy triggers.
The SPX monthly trend is UP. The weekly trend is UP. The daily trend just reverted from up to NEUTRAL, and everything about this looks like the C leg down of a vanilla ABC ii wave down. So far…
“No reason to get excited!…the thief he kindly spoke.”
Ready to go when’s the open?