
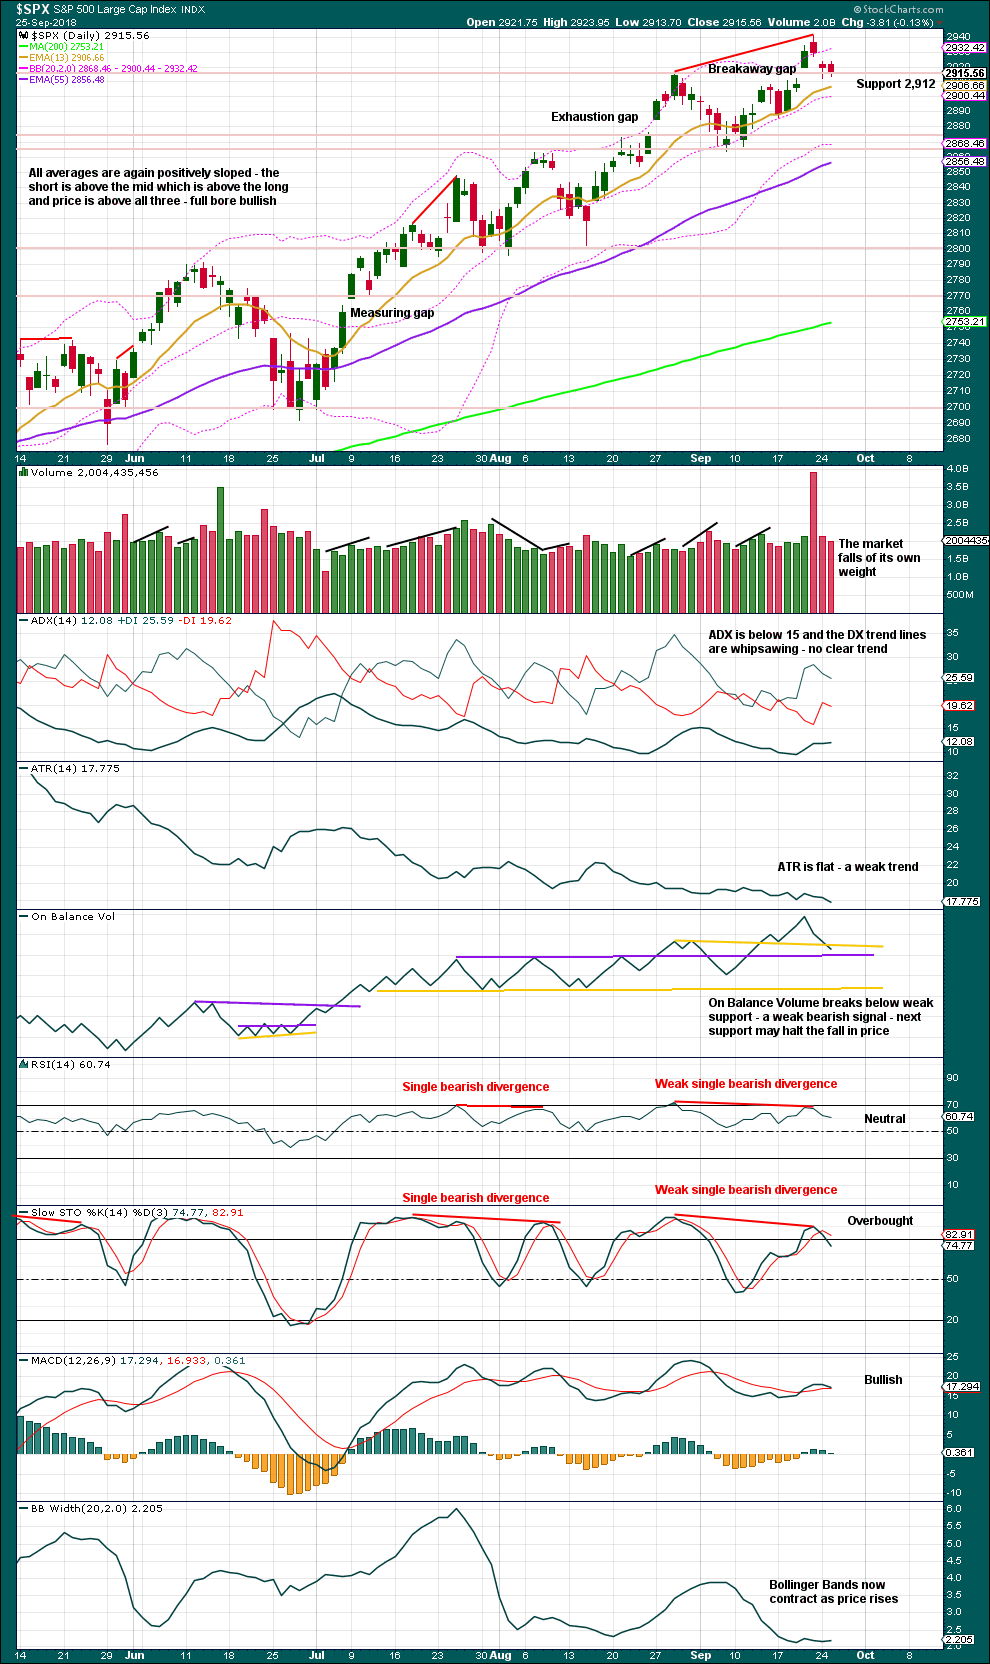
A small range inside day leaves the Elliott wave count unchanged.
The short term volume profile supports the Elliott wave count.
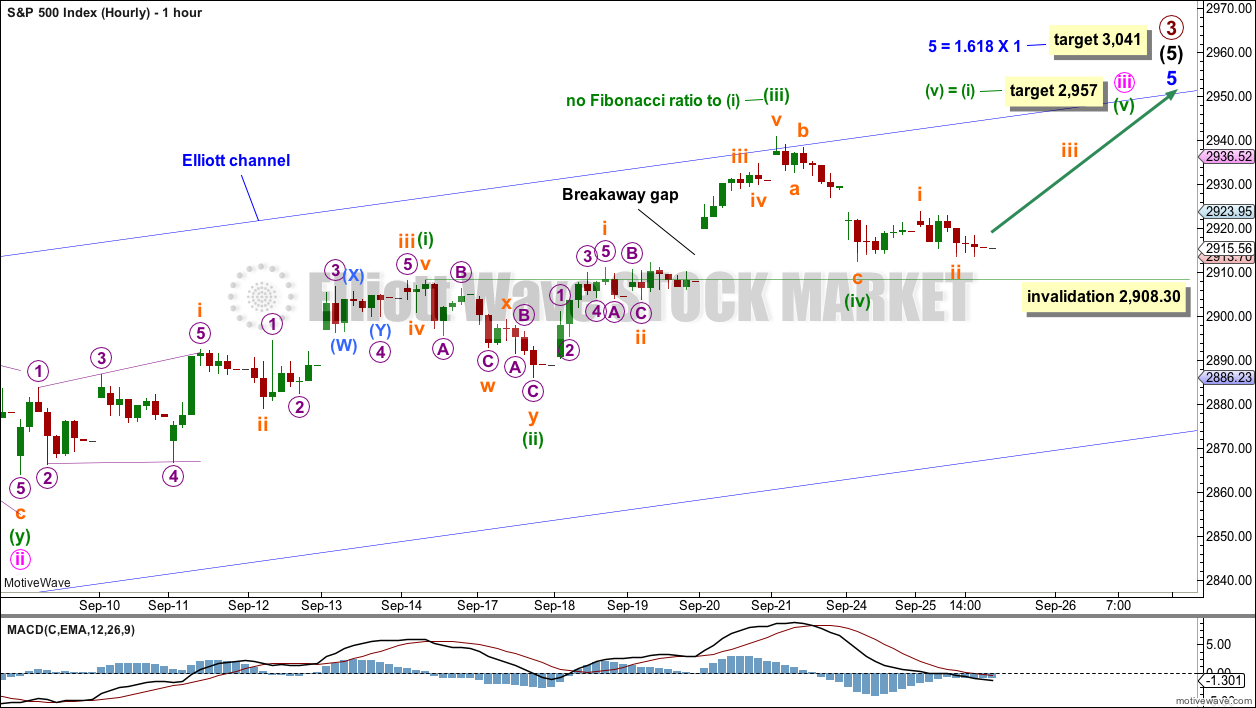
Summary: Upwards movement is expected to resume. The short term target for the next pullback to arrive is about 2,957. The invalidation point is at 2,908.30; but support at the last gap may remain at 2,912.36, so price is not expected to get as low as the invalidation point.
The structure of minor wave 5 is incomplete. The target remains a small zone from 3,041 (Elliott wave) to 3,045 (classic analysis).
The AD line today gives another short term bearish signal. This may develop further before primary wave 3 comes to an end. While the last gap remains open, it is still safest to assume the upwards trend remains in place.
Gaps may be used to pull up stops; stops may now be pulled up to just below 2,912.36.
The final target for this bull market to end remains at 3,616, which may be met in October 2019.
New updates to this analysis are in bold.
The biggest picture, Grand Super Cycle analysis, is here.
Last historic analysis with monthly charts is here, video is here.
ELLIOTT WAVE COUNT
WEEKLY CHART
Click chart to enlarge.
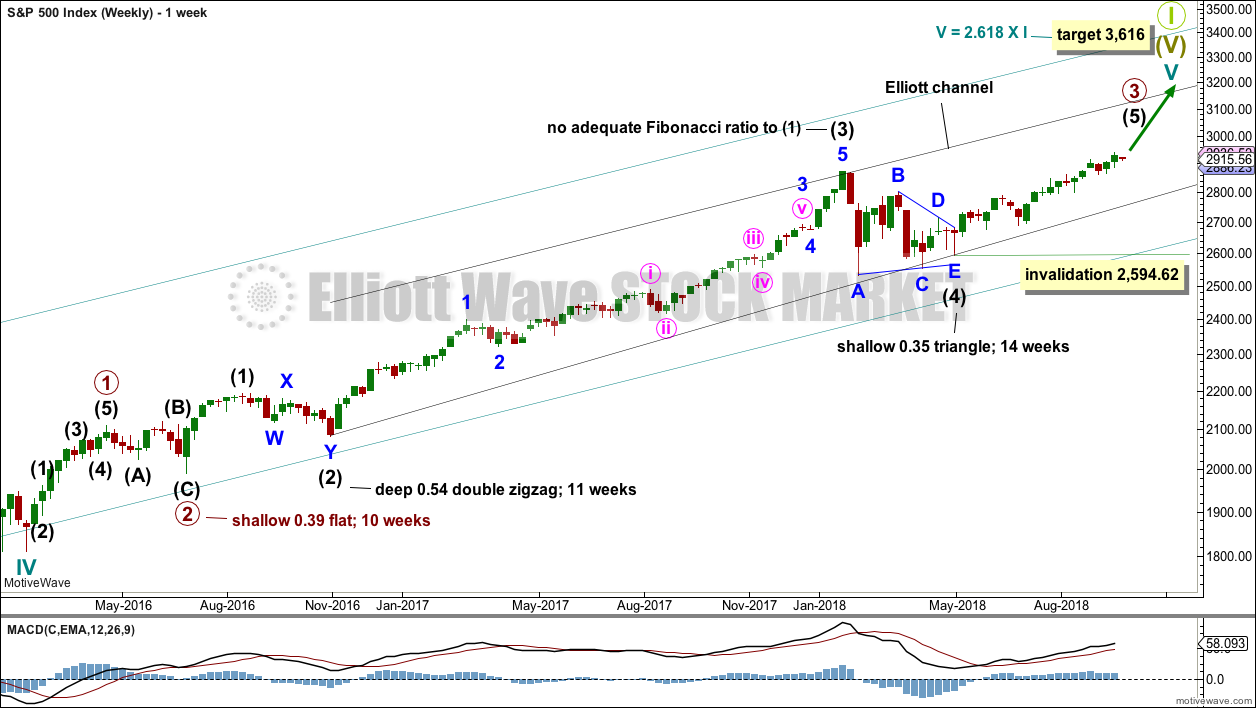
Cycle wave V must complete as a five structure, which should look clear at the weekly chart level and also now at the monthly chart level. It may only be an impulse or ending diagonal. At this stage, it is clear it is an impulse.
Within cycle wave V, the third waves at all degrees may only subdivide as impulses.
Intermediate wave (4) has breached an Elliott channel drawn using Elliott’s first technique. The channel is redrawn using Elliott’s second technique: the first trend line from the ends of intermediate waves (2) to (4), then a parallel copy on the end of intermediate wave (3). Intermediate wave (5) may end either midway within the channel, or about the upper edge.
There is perfect alternation and excellent proportion between intermediate waves (2) and (4).
At this stage, the expectation is for the final target to me met in October 2019. If price gets up to this target and either the structure is incomplete or price keeps rising through it, then a new higher target would be calculated.
DAILY CHART
Click chart to enlarge.
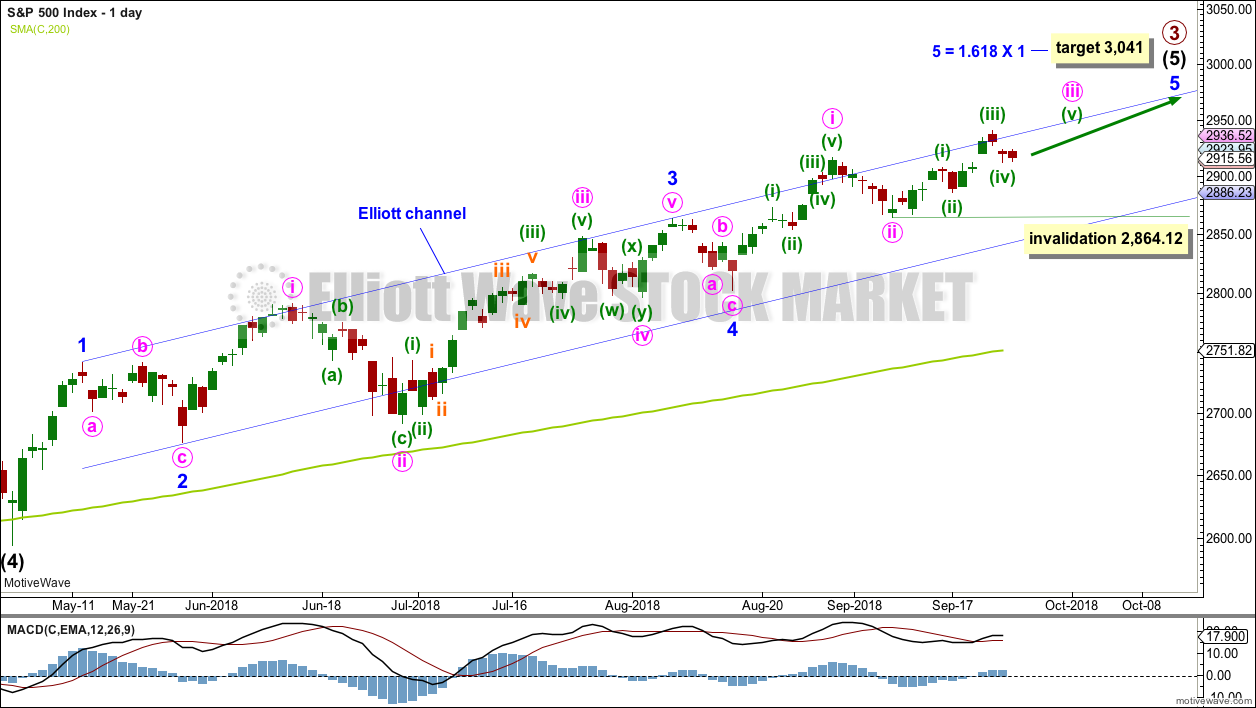
Intermediate wave (5) avoided a truncation now that it has a new high above the end of intermediate wave (3) at 2,872.87.
Intermediate wave (3) exhibits no Fibonacci ratio to intermediate wave (1). It is more likely then that intermediate wave (5) may exhibit a Fibonacci ratio to either of intermediate waves (1) or (3). Intermediate wave (5) has passed equality in length and 1.618 the length of intermediate wave (1). The next Fibonacci ratio in the sequence is 2.618 giving a target at 3,124. If the target at 3,045 is met and passed, then this would be the next calculated target.
A target for intermediate wave (5) to end is calculated at minor degree. Because this target is so close to the classic analysis target at 3,045, it does have a reasonable probability.
Intermediate wave (5) is unfolding as an impulse, and within it minor waves 1 through to 4 may now all be complete.
Within intermediate wave (5), minor wave 3 was extended and now minor wave 5 looks to be extending. When impulses extend, they show their subdivisions at higher time frames; within minor wave 5, now minute wave ii is clearly visible at the daily chart level. When minute wave iv arrives, it too may last a few days and show up on the daily chart.
Minute wave iii must subdivide as an impulse. It now looks like within it minuette waves (ii) and (iv) are showing up on the daily chart; this is a typical look for a third wave.
If the degree of labelling within minute wave iii is moved down one degree, then no second wave correction may move beyond its start below 2,864.12.
HOURLY CHART
Click chart to enlarge.
Within minor wave 5, minute waves i and ii may now be complete. Minute wave iii may only subdivide as an impulse.
Within minute wave iii, minuette waves (i) through to (iv) may now be complete. It is also possible that minuette wave (iv) may continue sideways for another couple of days as a triangle, flat or combination.
Minuette wave (iii) exhibits no Fibonacci ratio to minuette wave (i), but it is longer than minuette wave (i). A target is calculated for minuette wave (v) to exhibit the most common Fibonacci ratio to minuette wave (i).
Minuette wave (iv) may not move into minuette wave (i) price territory below 2,908.30.
On the five minute chart, subminuette wave i within minuette wave (v) will subdivide as a leading contracting diagonal.
TECHNICAL ANALYSIS
WEEKLY CHART
Click chart to enlarge. Chart courtesy of StockCharts.com.
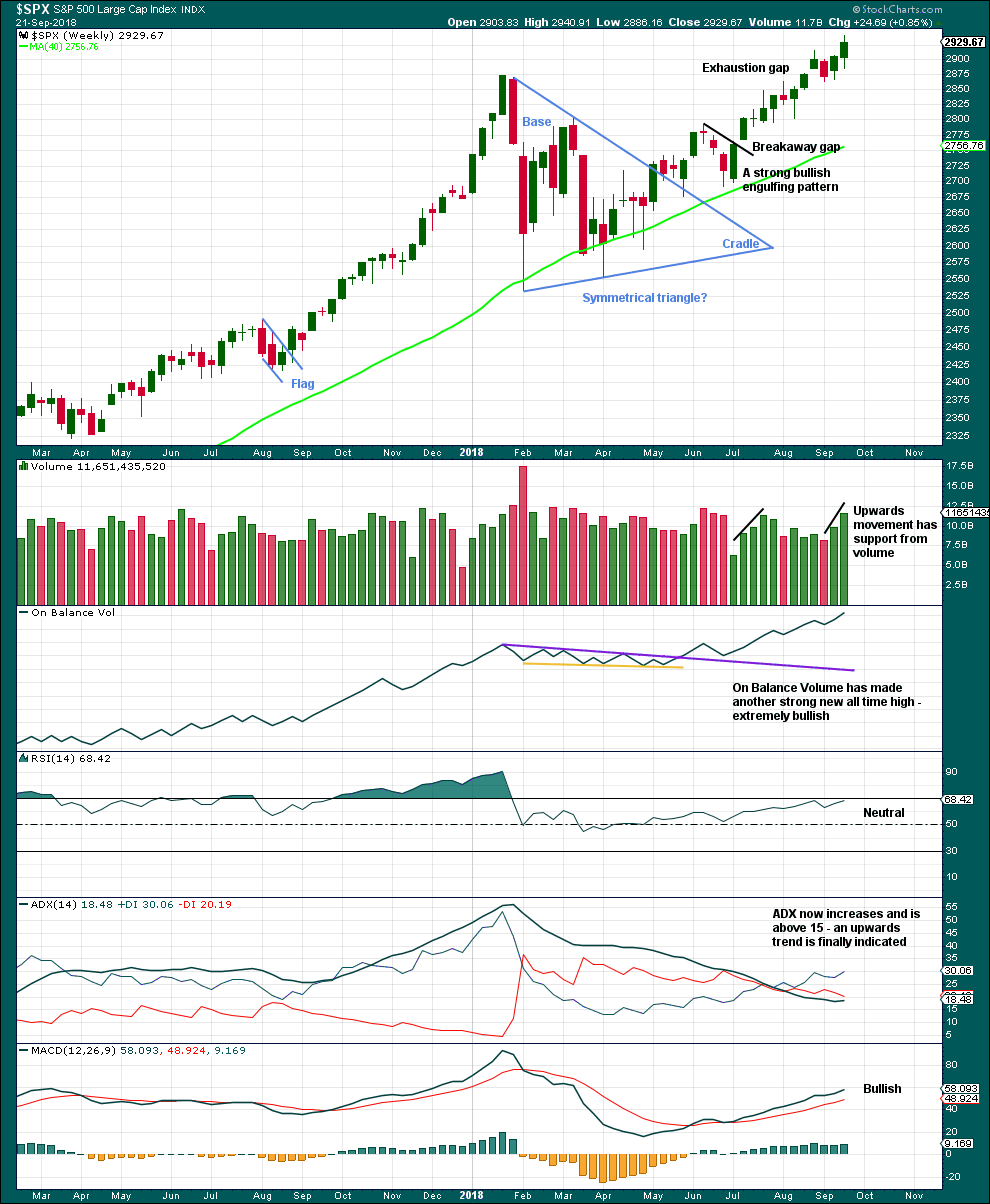
The symmetrical triangle base distance is 340.18. Added to the breakout point of 2,704.54 this gives a target at 3,044.72. This is very close to the new Elliott wave target at 3,041.
This chart is completely bullish. RSI is not yet overbought, so there is room for price to rise.
DAILY CHART
Click chart to enlarge. Chart courtesy of StockCharts.com.
Use the breakaway gap to pull up stops for long positions.
The short term volume profile is bullish. A little downwards movement today for a small range day, which lacks support from volume, does not look at all convincing as part of a stronger downwards movement.
The breakaway gap has its lower edge at 2,012.36. The low for yesterday’s session at 2,912.63 leaves this gap open. If this is a breakaway gap, then it should not be closed and should provide support. So far this looks like a typical test of support at prior resistance. It would now be typical for price to move up and away.
The trend remains the same until proven otherwise. The trend at this time is clearly upwards. The target has not yet been met.
At this stage, this chart is mostly bullish even with bearish divergence still present between price and RSI and Stochastics. However, RSI is not extreme and ADX is not extreme. While the breakaway gap remains open, it would be safest to assume the upwards trend remains intact.
VOLATILITY – INVERTED VIX CHART
WEEKLY CHART
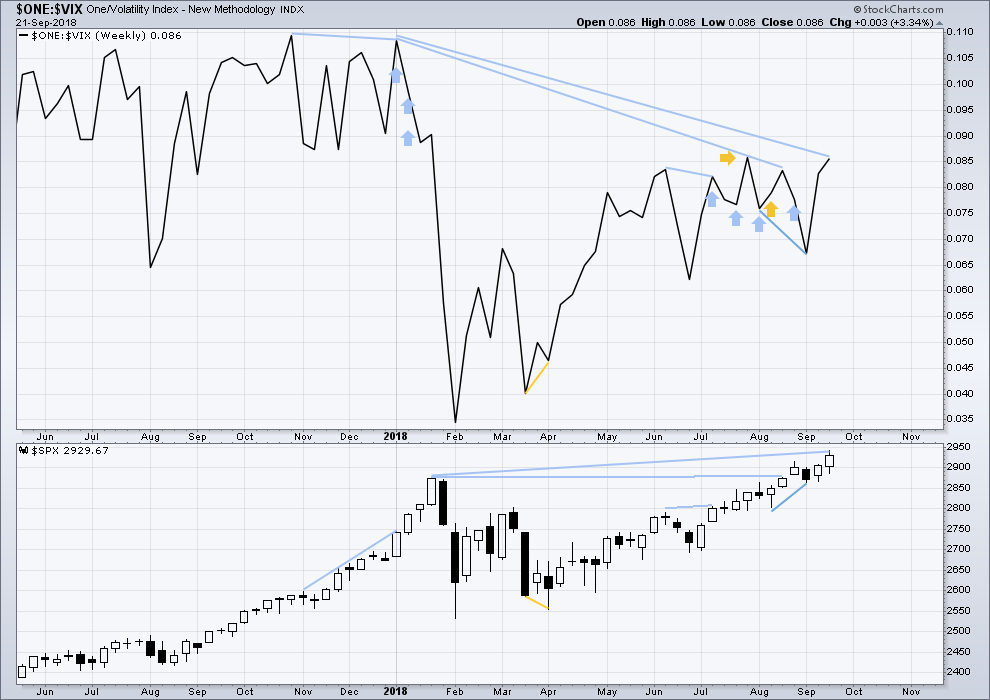
Click chart to enlarge. Chart courtesy of StockCharts.com. So that colour blind members are included, bearish signals
will be noted with blue and bullish signals with yellow.
To keep an eye on the all time high for inverted VIX a weekly chart is required at this time.
Notice how inverted VIX has very strong bearish signals four weeks in a row just before the start of the last large fall in price. At the weekly chart level, this indicator may be useful again in warning of the end of primary wave 3.
At this time, there is mid term bearish divergence between price and inverted VIX: price has made another new all time high, but inverted VIX has not. This divergence may persist for some time. It may remain at the end of primary wave 3, and may develop further to the end of primary wave 5.
Upwards movement in price has support last week from a normal corresponding decline in market volatility. There is no new short term divergence.
DAILY CHART
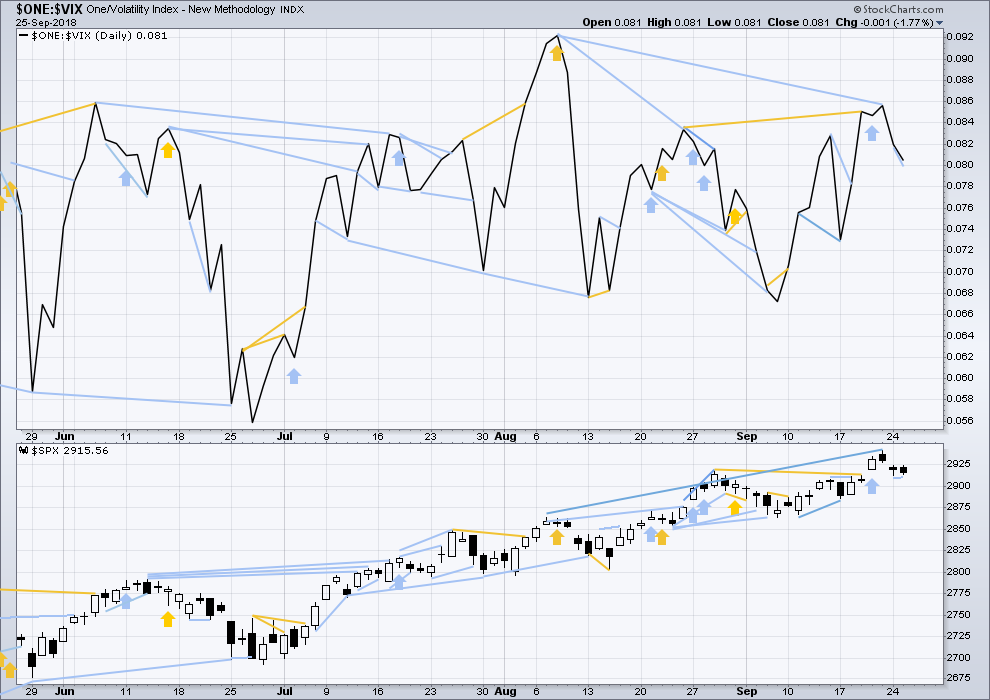
Click chart to enlarge. Chart courtesy of StockCharts.com. So that colour blind members are included, bearish signals
will be noted with blue and bullish signals with yellow.
Normally, volatility should decline as price moves higher and increase as price moves lower. This means that normally inverted VIX should move in the same direction as price.
There is mid term divergence with a new all time high from price not supported by a corresponding new all time high from inverted VIX. This divergence is bearish.
Inverted VIX has made a new low today below the prior session, but price has not. This divergence is bearish, but it is weak.
Mid term bearish divergence between price and inverted VIX can be seen on both daily and weekly charts now. However, this may not be a good timing tool in identifying the end of primary wave 3; divergence may develop further before primary wave 3 ends.
BREADTH – AD LINE
WEEKLY CHART
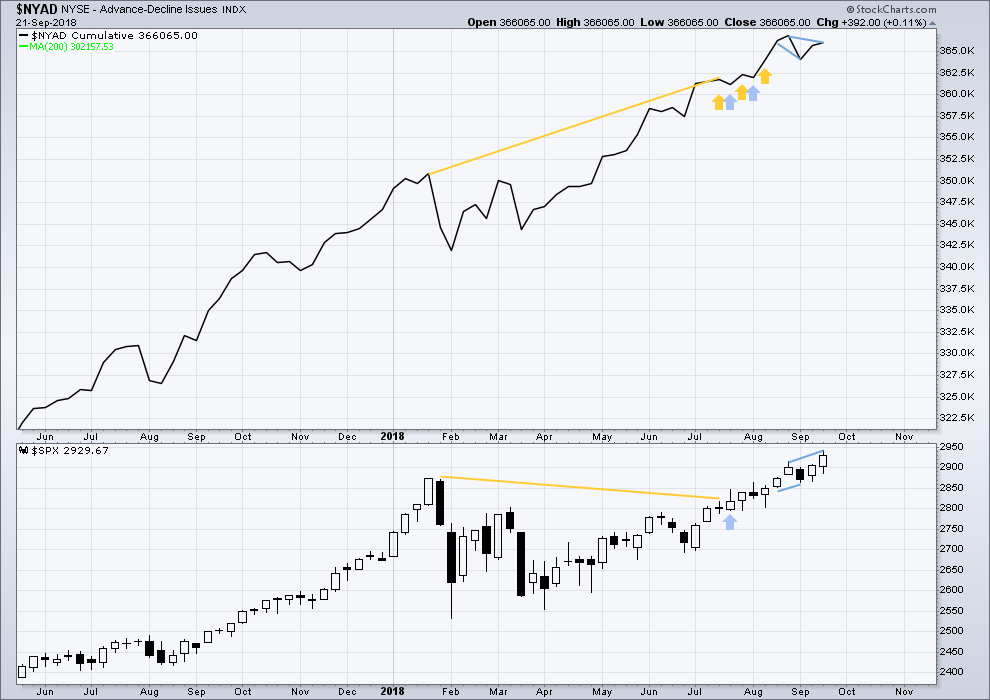
Click chart to enlarge. Chart courtesy of StockCharts.com.
When primary wave 3 comes to an end, it may be valuable to watch the AD line at the weekly time frame as well as the daily.
Price has made a new all time high last week, but it does not have support from rising market breadth. There is now short term bearish divergence at the weekly chart level between price and the AD line. It is possible now that the end of primary wave 3 is quite close.
DAILY CHART
Click chart to enlarge. Chart courtesy of StockCharts.com.
There is normally 4-6 months divergence between price and market breadth prior to a full fledged bear market. This has been so for all major bear markets within the last 90 odd years. With no longer term divergence yet at this point, any decline in price should be expected to be a pullback within an ongoing bull market and not necessarily the start of a bear market. New all time highs from the AD line on the 29th of August means that the beginning of any bear market may be at the end of December 2018, but it may of course be a lot longer than that. My next expectation for the end of this bull market may now be October 2019.
Breadth should be read as a leading indicator.
Price has now made new all time highs last week, but the AD line has not. There is now short / mid term divergence at the daily chart level; this is bearish, and it may develop further before primary wave 3 comes to an end.
The AD line has made a new low today below the prior small swing low seven sessions ago, but price has not. This is short term bearish divergence.
All of small, mid and large caps made new all time highs on the 27th of August. There is a little divergence here in breadth with large caps continuing to make new all time today and small and mid caps lagging.
DOW THEORY
The following lows need to be exceeded for Dow Theory to confirm the end of the bull market and a change to a bear market:
DJIA: 23,360.29.
DJT: 9,806.79.
S&P500: 2,532.69.
Nasdaq: 6,630.67.
Nasdaq and DJT and now the S&P500 have all made recent new all time highs.
At the end of last week, DJIA has now also made a new all time high. This provides Dow Theory confirmation that the bull market continues.
Charts showing each prior major swing low used for Dow Theory may be seen at the end of this analysis here.
ANALYSIS OF THE END OF INTERMEDIATE WAVE (3)
TECHNICAL ANALYSIS
Click chart to enlarge. Chart courtesy of StockCharts.com.
This chart looked overly bullish at the end of intermediate wave (3). The only warning in hindsight may have been from volume spiking slightly on downwards days. There was no bearish divergence between price and either of RSI or On Balance Volume.
Single bearish divergence between price and Stochastics was weak, which is often an unreliable signal.
VIX
Click chart to enlarge. Chart courtesy of StockCharts.com.
This is a daily chart.
The strongest warning of an approaching intermediate degree correction at the daily chart level came from inverted VIX.
There was strong double bearish divergence at the high of intermediate wave (3), which is noted by the vertical line. There was also a sequence of five days of bearish divergence, days in which price moved higher but inverted VIX moved lower.
AD LINE
Click chart to enlarge. Chart courtesy of StockCharts.com.
This is a daily chart.
There was only single bearish divergence between price and the AD line at the end of intermediate wave (3). Approaching the high, there were no instances of price moving higher and the AD line moving lower.
Conclusion: When studying the behaviour of price and these indicators just before the start of intermediate wave (4), we may see some clues for warning us of primary wave 4. A cluster of bearish signals from VIX along with a bearish divergence from price and the AD line or On Balance Volume may warn of primary wave 4. The next instance will probably not behave the same as the last, but there may be similarities.
At this time, it does not look like primary wave 4 may begin right now, but we need to be aware of its approach.
Published @ 07:53 p.m. EST.
—
Careful risk management protects your trading account(s).
Follow my two Golden Rules:
1. Always trade with stops.
2. Risk only 1-5% of equity on any one trade.
HiYah Verne,
At the time you were posting opening your Oct DIA put purchases, I kept trying to find any indications for a big reversal, and couldn’t find one. VIX/UVXY were going down at the time also. I was busy navigating my GDX short position when the market did turn.
Can I ask you what specifically was it that alerted you to the DIA turning sharply?
Hi Ari. I’ve got a few triggers that we use in the posse for high probability set-ups. The guys don’t mind me posting our entries to share with Lara’s members (Lara also gave the O.K) but I never asked about specific signals as some traders get a bit picky about that although I certainly don’t mind. Of course we have had lots of other indications, including from Lara, of potential bearish developments. Another thing I like to look at is how market makers are bidding options a few weeks out (delta) and the DIA 270 puts we unloaded yesterday kept a very firm bid…
Let me check with B and the gang about sharing triggers…
Thanks Verne 🙂
Updated daily chart:
With this strong unexpected downwards movement to the end of this session, the wave count for the short term is invalidated.
That’s an indication that it is possible primary 4 may possibly have arrived.
But the price point to determine that will have to be 2,864.12.
While price remains above 2,864.12 there is still a series of higher highs and higher lows; an upwards trend is still in place.
If price breaks below 2,864.12 then this may be the main wave count.
Daaaa-da-dum-dum.
Daaaa-da-dum-dum-DAAAAAH!!!!
The jury will now go into private session….
Indeed. We may now have a few days of indecision.
I want price to tell me when the high is in, not to try and pick it.
I do not like these times with a lack of clarity.
Once we have a confirmed P4 underway, Lara please do your best target magic so I can make my trades and go on vacation…
🙂 🙂 🙂
Lara, on my classical TA don’t you think the confluence zone between 2791-2800 maybe the more important break to confirm a primary wave down?
Agreed!!!
We had an important trend line break today. NDX back tested for quite some time so SPX could do the same thanks to all that bankster largesse. If this is the real deal, we are going to take out SPX 2800 so fast it will make your head spin! 🙂
Based on today’s action and what I wrote below, I have liquidated 50% of my long positions in my long term accounts. A break of 2907 and I will liquidate the remainder as well as long positions in my short term trading account.
Broke the 2907, have cleared all longs and on the side lines for now
Have a good evening everyone
WOWZA
Needless to say, all long term long positions have been liquidated. Now I can ring the cash register, “Ca-Ching”
Short term account longs liquidated. Ca-Ching.
Now I am fully in cash, sitting on hands until the dust clears. That is, if the dust clears.
Interesting. After I read Chris Cole’s most recent article I went to 90% cash as well! Will continue to scalp Mr. Market and run for dear life with my own scalp intact hopefully! 🙂
Indeed, discretion is the better part of valor right here and now! Though I do believe the WC calls for new ATH’s and I do believe they will be coming. But market action speaks, and the daily/weekly up trend line in SPX just got destroyed. Can always reload when conditions are “safer”!!! We’ll see if that’s in a day or two…or a couple of months!!!
YY daily.
I think this whole down ward movement shown is a big completed A-B-C, and I think I can justify that with a 5-3-5 count. The monthly trend is neutral (but weekly is of course hard down). The volatility is outtasite here; today’s “little” up bar was +5%! So careful with that axe Eugene. I’ve sold Oct puts at 75 strike. I don’t want to see the low on this chart exceeded! Up or out for me here.
We should move down to take out this morning’s low. If you know the bankster modop it would be a good time to ring the register. I’m outta here till next time.
Have a great evening all! 🙂
Nice call!!
As I said. They are predictable and you can tell when they are loosing the battle.
Ringing the register on the move down…. 🙂
Adding another 1/4 @ 2.25…
O.K. For those of you that did not read the article, a couple of young fish are swimming past an older fellow and he says to them:
“Howdy guys? How’s the water?”
After the older fish had swum past one of the younger fish turned to the other and said:
“What the hell is water?” 😀
Can you believe these clowns???!!!
Even when you expect it is still amazing to watch the cabal at work…Yikes!!!!
The clowns are fulfilling the required wave count.
Good clowns…
Haha! “Isn’t it rich…?” 🙂
I’d love to say I’m not surprised, but geez this reeks of desperation. Oh how miss the more real market of my early career. Markets in the Fate of Central Bankers instead of investors speaks to the sad state of human affairs. Kevin, riddle me exhausted and near capitulation mentally, in my TA (not trading advice) I reflexively added to VIX calls, opened a modest Oct UVXY bull put spread, and re-entered both SPY and QQQ shorts at size. 3% trail stop and I’m leaving it at that.
Chris,It is a completely different paradigm my friend. Once I figured out their constant aim is to ambush bearish traders, it became fairly easy to predict how and when they would react to market price. You are right though. We have not had free markets for quite some time and we won’t until the current one blows up. I still cannot believe how many folk remain under the impression that any of this is remotely normal. All we can do is trade what we see!
You’re not wrong Verne, the ambushes are predictable. I’m just tired of trading so damn much. It will happen when it’s supposed to…..Good job everyone on booking gains, riding the trend per Lara’s guidance, having the discipline to sit on hands and await clarity, down or up.
Not so happy today, Chris. I went long just after the Fed, and then took my bride for a leisurely afternoon drive up the Arrowhead Trail in extreme Northeast Minnesota. Back to our camp site in Grand Marais a couple hours later, only to see red everywhere. Thankfully I had a pretty tight stop, so I lost only a fingertip and not a whole arm. I should have listened to my gut. It told me there might just be a heavy downward “c” wave before the uptrend resumes. That’s what I expect is happening. We will see…
Is TLT now going to go right back up to the top of it’s big trading range (122.5)? Maybe, maybe. Maybe a butterfly in the middle of that range isn’t the worst idea in the world?
Kevin, I took my gains in TBT today via a 38.50 stop, and yesterday did a large NOV bull pull spread on TLT in anticipation of the usual pricing in ahead of the event, then reversal. Big rally coming there methinks. Great analysis bud.
Expect them to spike price up to shake out cubbies ahead of completion of the move down…but you knew that! 😉
Open interest in those contracts just shot up to almost 600 contracts!
Is that youse guys? 🙂 🙂
Adding another 1/4 @ 2.35…..
Reloading DIA Oct 12 266 strike puts for 2.40, 1/4 full load.
DJX on hourly tf has broken it’s down trend line, and bounced off a 38.2% retrace level (264.9).
My! Look at those ES candles!
I wonder just how long this sort of thing can continue?!
Another short set-up in progress. T, daily chart. I’ve been told T is one of the walking debt zombies, can’t operate w/o more and more infusions of $$$. Rising interest rates won’t help it much! Technically, it’s in a strong down trend at the MONTHLY tf…but now in week 2 of an up trend at the weekly tf. Looking here at the daily, what I note is that this move up is about the maximum move length in price and time in recent history; it looks ready to take another breather and resume the monthly tf down trend. I might be shorting on a break below that up trend line. Could be good one to be in pending the P4.
Not that I’m an expert fundamental/value analyst but roughly 32% of the entire equity market are debt zombies, and T being a very vulnerable large cap.
I am beginning to think Primary 4 is going to come sooner than later. For the past several months the daily analysis by Lara has ended with a review of the end of Intermediate 3 at the end of January 2018. It was a violent and unexpected move. Lara writes:
———————————————————————————————————-
Conclusion: When studying the behaviour of price and these indicators just before the start of intermediate wave (4), we may see some clues for warning us of primary wave 4. A cluster of bearish signals from VIX along with a bearish divergence from price and the AD line or On Balance Volume may warn of primary wave 4.
————————————————————————————————————
Well, if I am brutally honest, we have the bearish divergence from price and the AD line. If we make it to the next target at 2957, I expect we will see a bearish divergence from On Balance Volume. We already have bearish divergences from daily and 4 hour MACD. The mid and small cap stocks are no longer leading to the upside. In fact, they look like they might be rolling over. Perhaps they are going to lead to the downside.
All of this is causing a shift in my disposition from bullish to bearish. My strategy shall be to sell all long positions in short and mid cap indexes soon (no later than next week). I will also expect to be out of all long positions (all accounts) before the US mid-term elections. If the SPX breaks 2907 I will exit all long positions immediately.
Just thought I’d give my opinion and strategy as my concerns about the bullish case are growing.
I agree 100% Rodney. The signs and portents are growing!! I’ve been guesstimating a top around Oct 10 for a while now; I’m still holding to that based on current action, but this delay in getting the final v wave up started might be extending that a little bit. I’m still trust the count…but with caution, because we all know counts are not PREDICTIVE, they are indicative of probabilities only…
Interesting. Amazing how the presumption of liquidity is unconsiously built into our market perspective. Chris Cole has a point!
Anyone else read the joke about the fish and water?
Short set up in CVX, perfect tag of 61.8% of May-Sept sell off. The danger here of course is that oil (driving this price rise) is still very much in it’s currently daily tf uptrend. Eventually, there’s going to be a good short here I think, but it enters “monitoring mode” right now for me. I may short any further immediate weakness with price staying under $124.35 (the 61.8% price).
I am out of bull put spread not quite at zero cost basis but close enough. I had a sneaking suspicion that we could see a short-lived ramp. Will re-deploy if we take out this morning’s highs.
Guten Morgen!
The third installment of Chris Cole’s most recent article on liquidity and market risk is available at Zerohedge. I personally am making a few changes after reading what he had to say. Be careful out there…
First! 🙂
I opened a small long position on DWDP based on Kevin’s suggestion earlier today. An Investopedia article also suggested it’s at a support trend line, with the 50 day SMA just crossing over the 200 SMA:
https://finance.yahoo.com/m/2810839a-ec21-3b71-9344-300a7004f0df/3-charts-that-suggest-traders.html?.tsrc=applewf
Thanks Kevin for the heads up on this one. Let’s see where this one goes…
Best of luck. I’m waiting for some kind of indication the 61.8% at 67.5 is going to hold, and ideally at the same time a shift back to upwards movement in industrials, materials, and broader markets (XLI, XLB, DJX). Both may occur early Wed.
I like the PANW – I bought straddle on earnings – still holding long side – nice BB squeeze . I liked Kevin’s reconfirmation of my thought . Enjoy your ideas Kevin – Thank you
You’re welcome Fred. Always thrilled to help someone ring the register! I am waiting on PANW to break it’s hourly tf down trend line before possibly committing. I worry about that active daily tf squeeze, with price through it so far only going sideways/down. I want to see some indication of trend change.
Oops, my mistake, yes I entered yesterday…let me revise that to I SHOULD have waited for more confirmation of a turn, because it’s opening right on top of my stop.
Yep kinda of an ugly start . – May be looking to fill a bit of a gap
So I’m out with a small loss, waiting to reenter at perhaps 2x the size, WHEN it’s set up and triggering (this time I’m WAITING FOR THE TRIGGER!!!) again. It’s just reaching down to the it’s more recent weekly/daily trend line, close to yet more fibo clusters, so…eventually it’s going to find a bottom.
The weekly is in a VERY long term squeeze (16th week). My best guess is this squeeze is only resolved with sharp downward movement in coordination with the approaching P4 in few days/weeks. If you are bought into the approach P4…then this and every long trade right now has to be managed as a short timer!