
Upwards movement for the week to new all time highs was expected for the main Elliott wave count.
Also, upwards movement for the week has invalidated the alternate Elliott wave count. When alternate wave counts are invalidated, then more confidence may be had in the main wave count.
Summary: The structure of minor wave 5 is incomplete. The target remains a small zone from 3,041 (Elliott wave) to 3,045 (classic analysis).
Look out for a test of support on Monday / Tuesday about 2,912, then for price to move up and away towards the target.
Members are advised now that bearish signals do not necessarily mean price must turn here; some bearishness may be expected to begin to develop and strengthen before primary wave 3 finds its end.
Gaps may be used to pull up stops; stops may now be pulled up to just below 2,912.36.
The final target for this bull market to end remains at 3,616, which may be met in October 2019.
New updates to this analysis are in bold.
The biggest picture, Grand Super Cycle analysis, is here.
Last historic analysis with monthly charts is here, video is here.
ELLIOTT WAVE COUNT
WEEKLY CHART
Click chart to enlarge.
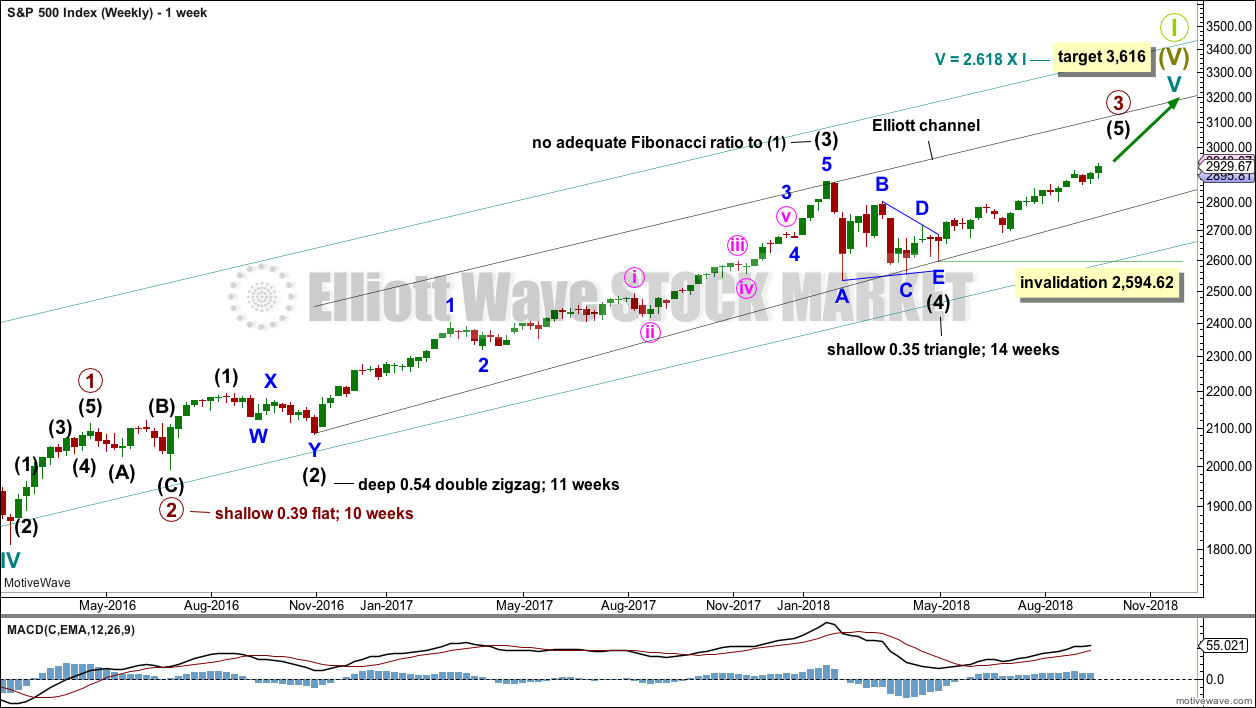
Cycle wave V must complete as a five structure, which should look clear at the weekly chart level and also now at the monthly chart level. It may only be an impulse or ending diagonal. At this stage, it is clear it is an impulse.
Within cycle wave V, the third waves at all degrees may only subdivide as impulses.
Intermediate wave (4) has breached an Elliott channel drawn using Elliott’s first technique. The channel is redrawn using Elliott’s second technique: the first trend line from the ends of intermediate waves (2) to (4), then a parallel copy on the end of intermediate wave (3). Intermediate wave (5) may end either midway within the channel, or about the upper edge.
There is perfect alternation and excellent proportion between intermediate waves (2) and (4).
At this stage, the expectation is for the final target to me met in October 2019. If price gets up to this target and either the structure is incomplete or price keeps rising through it, then a new higher target would be calculated.
DAILY CHART
Click chart to enlarge.
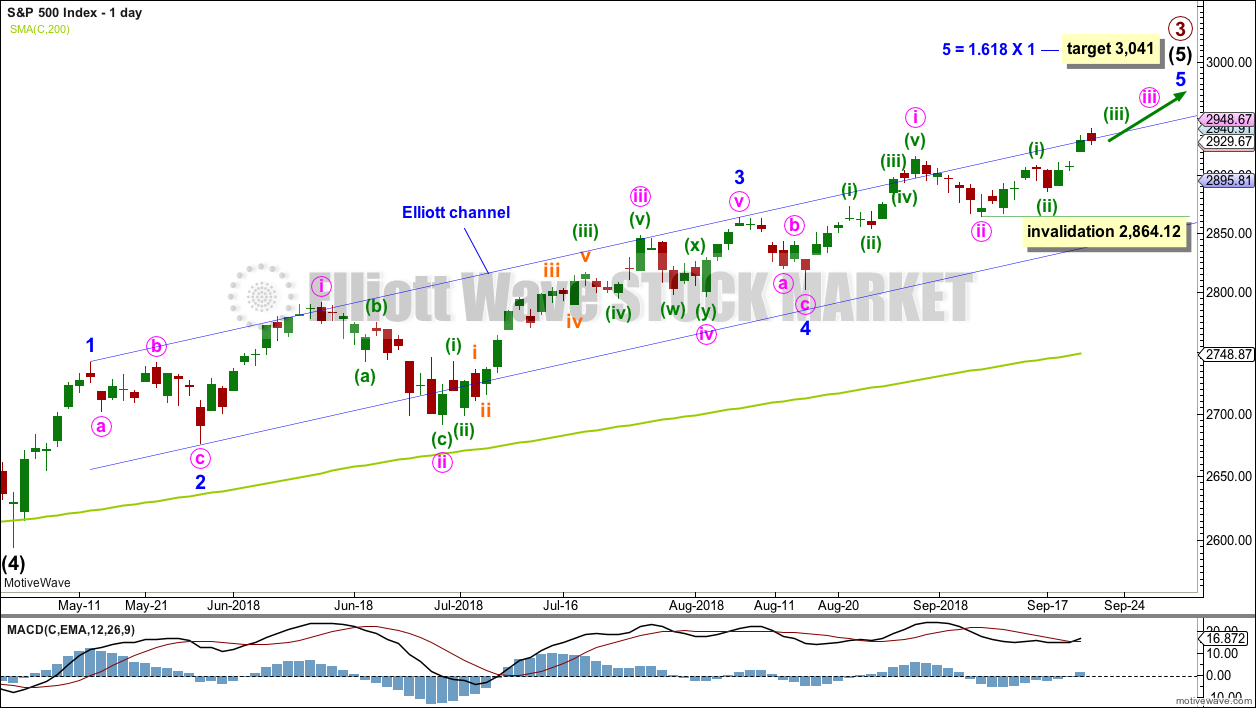
Intermediate wave (5) avoided a truncation now that it has a new high above the end of intermediate wave (3) at 2,872.87.
Intermediate wave (3) exhibits no Fibonacci ratio to intermediate wave (1). It is more likely then that intermediate wave (5) may exhibit a Fibonacci ratio to either of intermediate waves (1) or (3). Intermediate wave (5) has passed equality in length and 1.618 the length of intermediate wave (1). The next Fibonacci ratio in the sequence is 2.618 giving a target at 3,124. If the target at 3,045 is met and passed, then this would be the next calculated target.
A target for intermediate wave (5) to end is calculated at minor degree. Because this target is so close to the classic analysis target at 3,045, it does have a reasonable probability.
Intermediate wave (5) is unfolding as an impulse, and within it minor waves 1 through to 4 may now all be complete.
Within intermediate wave (5), minor wave 3 was extended and now minor wave 5 looks to be extending. When impulses extend, they show their subdivisions at higher time frames; within minor wave 5, now minute wave ii is clearly visible at the daily chart level. When minute wave iv arrives, it too may last a few days and show up on the daily chart.
Within minute wave iii, no second wave correction may move beyond the start of its first wave below 2,864.12. This invalidation point allows for the possibility that minute wave iii may extend further.
If minuette waves (i) and (ii) are correctly labelled, then minuette wave (iv) (when it arrives) may not move back down below minuette wave (i) price territory at 2,908.30.
HOURLY CHART
Click chart to enlarge.
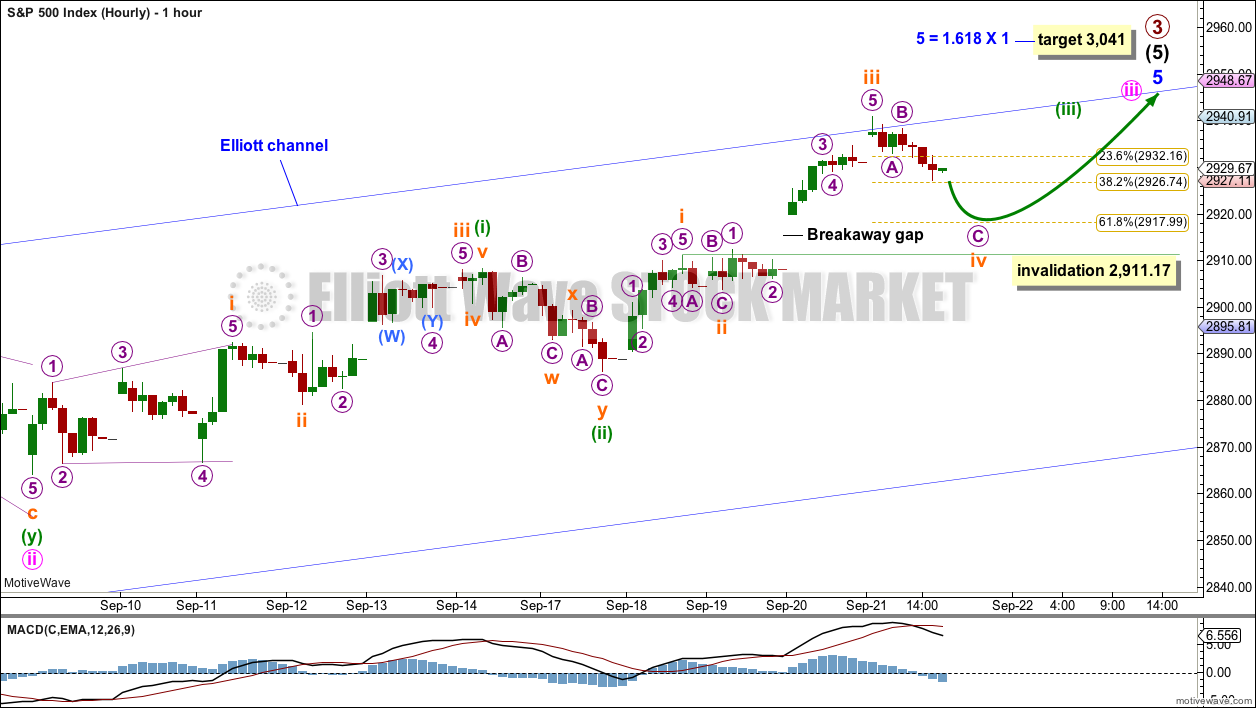
Within minor wave 5, minute waves i and ii may now be complete. Minute wave iii may only subdivide as an impulse.
Within minute wave iii, minuette waves (i) and (ii) may be complete.
Minuette wave (iii) must subdivide as an impulse. Within minuette wave (iii), subminuette waves i, ii and now iii may be complete. Subminuette wave iv may not move into subminuette wave i price territory below 2,911.17.
Subminuette wave ii was a shallow flat correction. Subminuette wave iv may be exhibiting alternation as a deeper zigzag; it may end closer to the 0.618 Fibonacci ratio about 2,918. This target would expect the breakaway gap to provide support and remain open.
The strongest middle portion of minor wave 5 may have completed. Two more pullbacks (minuette wave (iv) and minute wave iv) may unfold along the way up to the target at 3,041. Each of these upcoming fourth wave corrections must now remain above their respective first wave price territories.
TECHNICAL ANALYSIS
WEEKLY CHART
Click chart to enlarge. Chart courtesy of StockCharts.com.
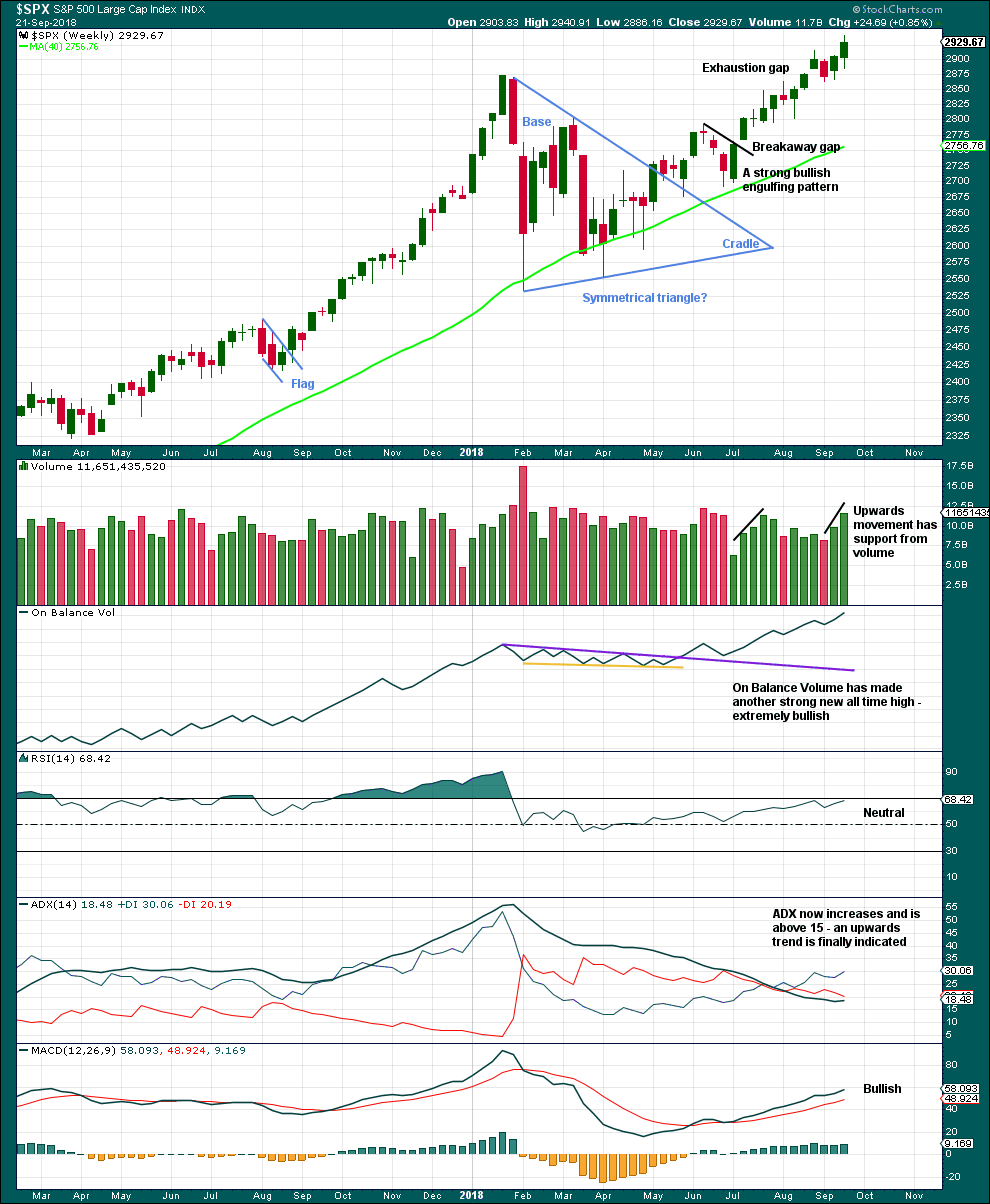
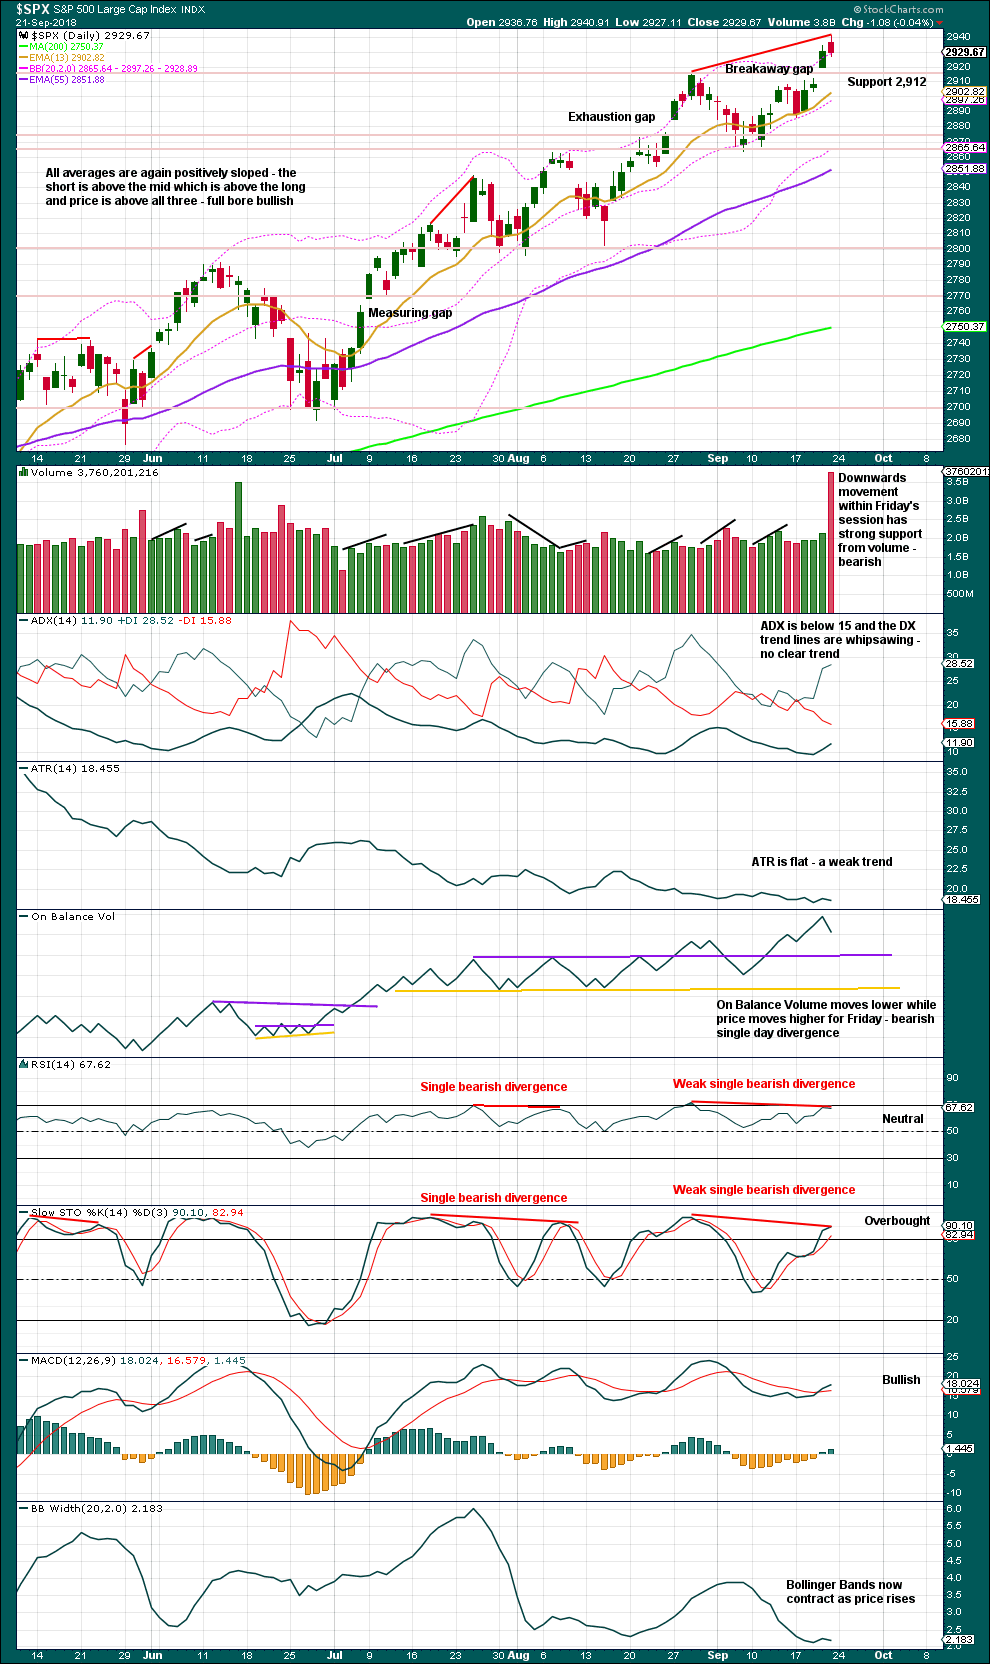
The symmetrical triangle base distance is 340.18. Added to the breakout point of 2,704.54 this gives a target at 3,044.72. This is very close to the new Elliott wave target at 3,041.
This chart is completely bullish. RSI is not yet overbought, so there is room for price to rise.
DAILY CHART
Click chart to enlarge. Chart courtesy of StockCharts.com.
Use the breakaway gap to pull up stops for long positions.
After an upwards breakout, it is typical to see price turn back and test support at prior resistance. If price moves lower to test support about 2,912 early next week, this would be typical behaviour. That may provide another entry opportunity to join the trend.
The trend remains the same until proven otherwise. The trend at this time is clearly upwards. The target has not yet been met.
Trading with an established trend is much safer than trying to pick highs or lows. Trading against a trend will see your trading account quickly depleted; it is a highly risky approach. Risk management is the most important aspect of trading. It is the difference between amateur traders who will see their accounts wiped out and experienced professionals who can consistently profit.
VOLATILITY – INVERTED VIX CHART
WEEKLY CHART
Click chart to enlarge. Chart courtesy of StockCharts.com. So that colour blind members are included, bearish signals
will be noted with blue and bullish signals with yellow.
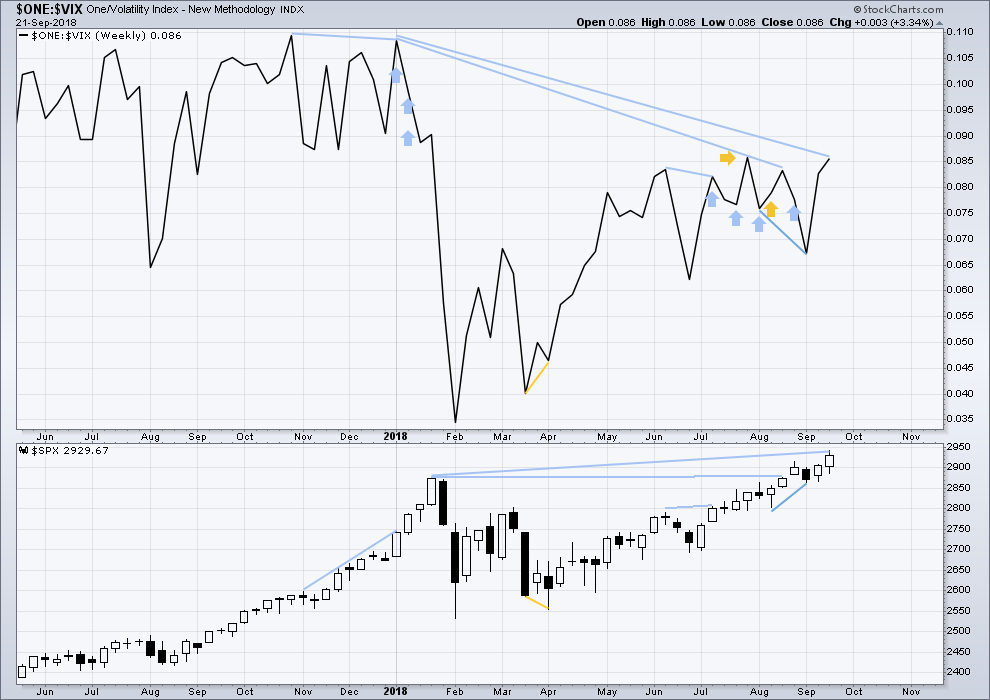
To keep an eye on the all time high for inverted VIX a weekly chart is required at this time.
Notice how inverted VIX has very strong bearish signals four weeks in a row just before the start of the last large fall in price. At the weekly chart level, this indicator may be useful again in warning of the end of primary wave 3.
At this time, there is mid term bearish divergence between price and inverted VIX: price has made another new all time high, but inverted VIX has not. This divergence may persist for some time. It may remain at the end of primary wave 3, and may develop further to the end of primary wave 5.
Upwards movement in price has support this week from a normal corresponding decline in market volatility. There is no new short term divergence.
DAILY CHART
Click chart to enlarge. Chart courtesy of StockCharts.com. So that colour blind members are included, bearish signals
will be noted with blue and bullish signals with yellow.
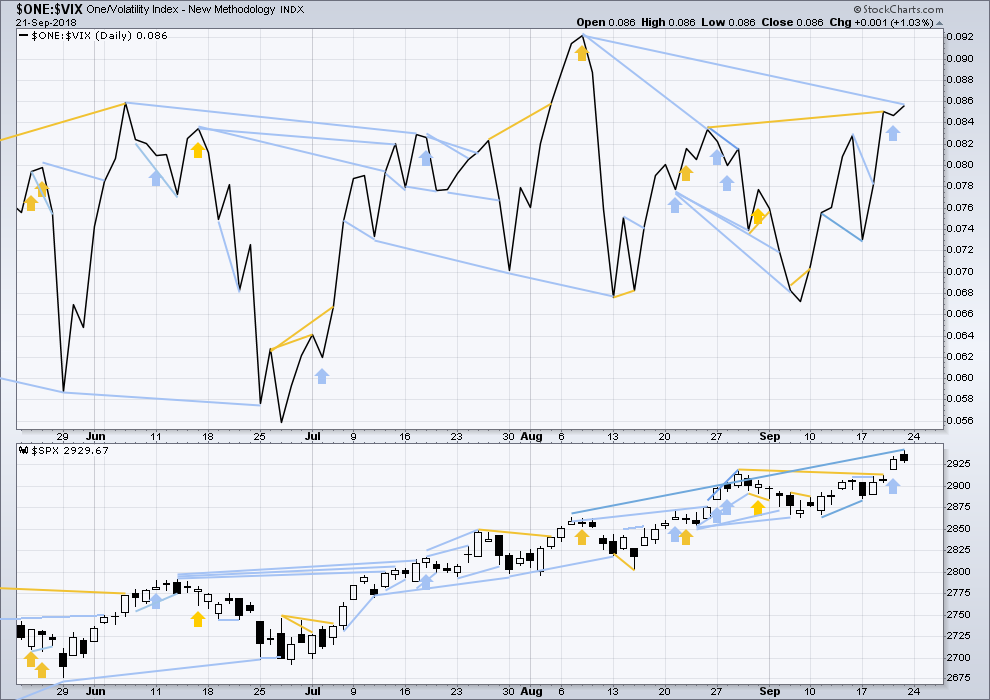
Normally, volatility should decline as price moves higher and increase as price moves lower. This means that normally inverted VIX should move in the same direction as price.
There is mid term divergence with a new all time high from price not supported by a corresponding new all time high from inverted VIX. This divergence is bearish.
Both price and inverted VIX moved higher on Friday. Upwards movement had support from declining market volatility.
Mid term bearish divergence between price and inverted VIX can be seen on both daily and weekly charts now. However, this may not be a good timing tool in identifying the end of primary wave 3; divergence may develop further before primary wave 3 ends.
BREADTH – AD LINE
WEEKLY CHART
Click chart to enlarge. Chart courtesy of StockCharts.com.
When primary wave 3 comes to an end, it may be valuable to watch the AD line at the weekly time frame as well as the daily.
Price has made a new all time high this week, but it does not have support from rising market breadth. There is now short term bearish divergence at the weekly chart level between price and the AD line. It is possible now that the end of primary wave 3 is quite close.
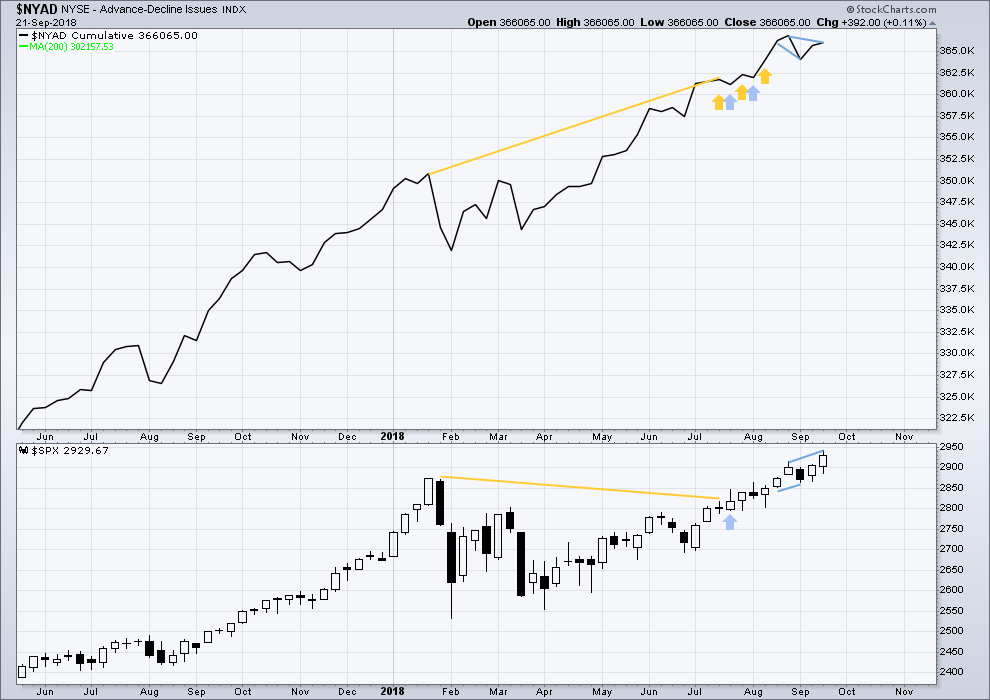
DAILY CHART
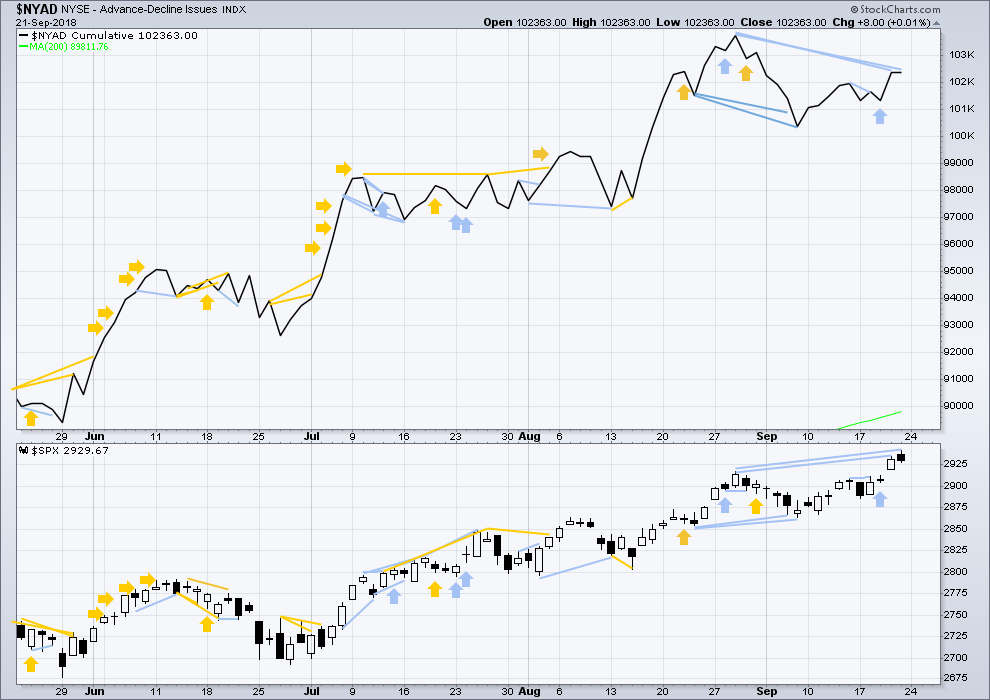
Click chart to enlarge. Chart courtesy of StockCharts.com.
There is normally 4-6 months divergence between price and market breadth prior to a full fledged bear market. This has been so for all major bear markets within the last 90 odd years. With no longer term divergence yet at this point, any decline in price should be expected to be a pullback within an ongoing bull market and not necessarily the start of a bear market. New all time highs from the AD line on the 29th of August means that the beginning of any bear market may be at the end of December 2018, but it may of course be a lot longer than that. My next expectation for the end of this bull market may now be October 2019.
Breadth should be read as a leading indicator.
Price has now made new all time highs for two days in a row, but the AD line has not. There is now short / mid term divergence at the daily chart level; this is bearish, and it may develop further before primary wave 3 comes to an end.
All of small, mid and large caps made new all time highs on the 27th of August. There is a little divergence here in breadth with large caps continuing to make new all time today and small and mid caps lagging.
DOW THEORY
The following lows need to be exceeded for Dow Theory to confirm the end of the bull market and a change to a bear market:
DJIA: 23,360.29.
DJT: 9,806.79.
S&P500: 2,532.69.
Nasdaq: 6,630.67.
Nasdaq and DJT and now the S&P500 have all made recent new all time highs.
At the end of this week, DJIA has now also made a new all time high. This provides Dow Theory confirmation that the bull market continues.
Charts showing each prior major swing low used for Dow Theory may be seen at the end of this analysis here.
ANALYSIS OF THE END OF INTERMEDIATE WAVE (3)
TECHNICAL ANALYSIS
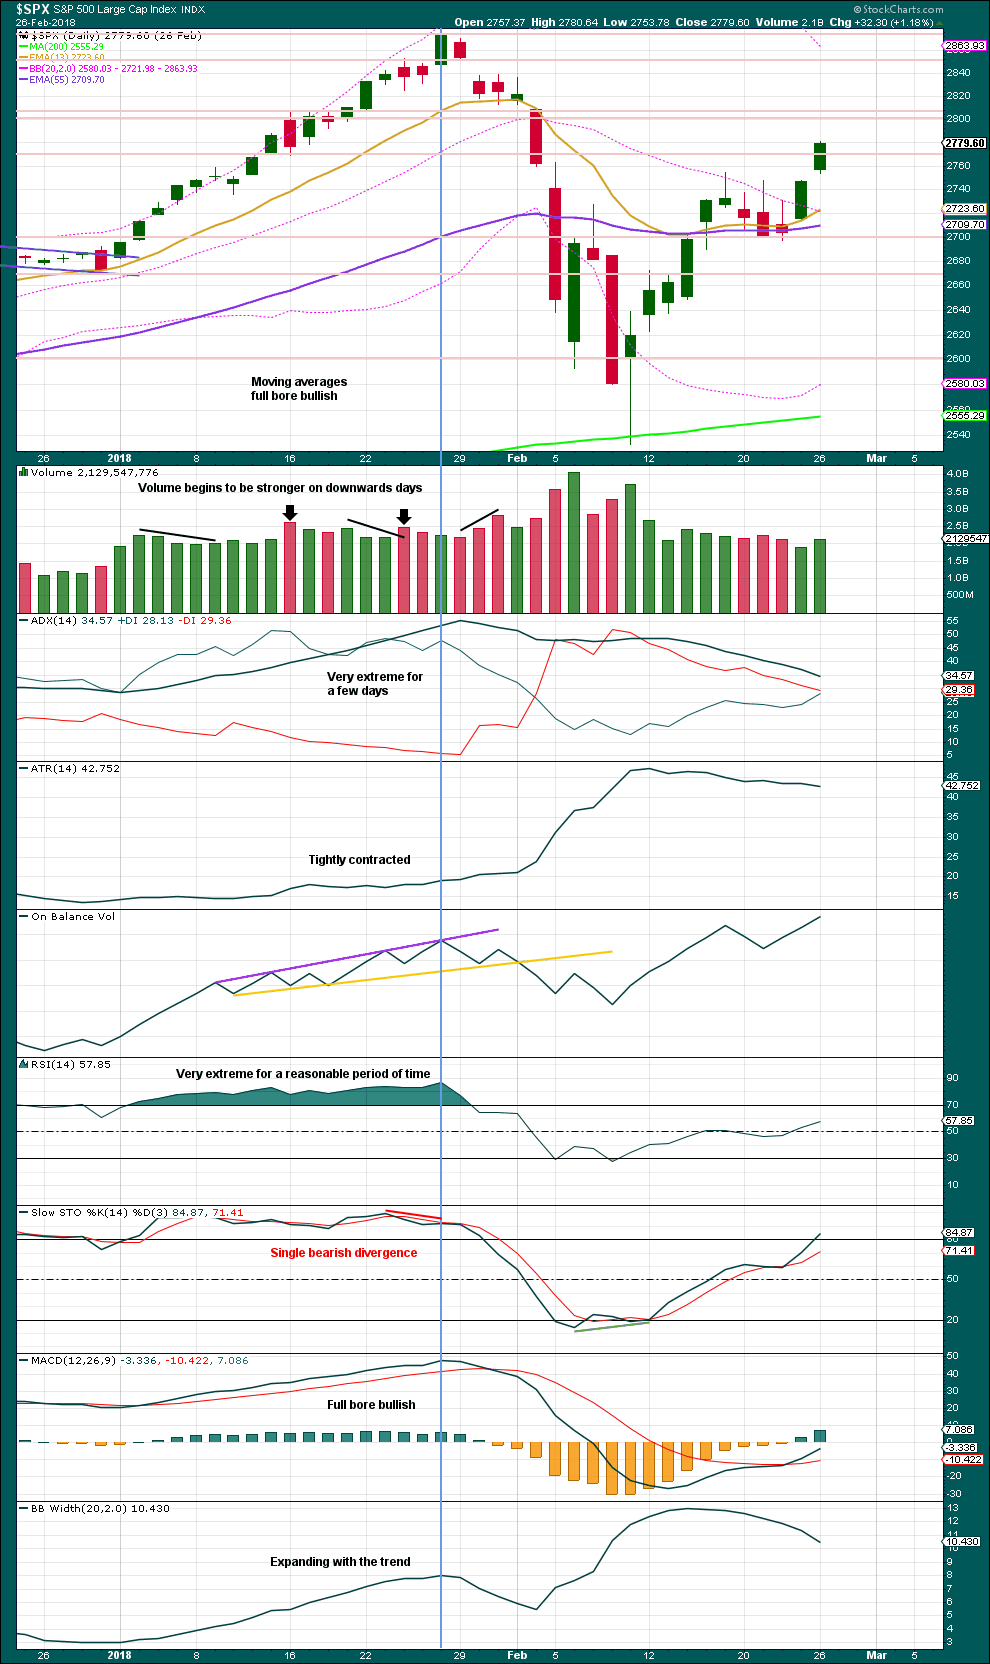
Click chart to enlarge. Chart courtesy of StockCharts.com.
This chart looked overly bullish at the end of intermediate wave (3). The only warning in hindsight may have been from volume spiking slightly on downwards days. There was no bearish divergence between price and either of RSI or On Balance Volume.
Single bearish divergence between price and Stochastics was weak, which is often an unreliable signal.
VIX
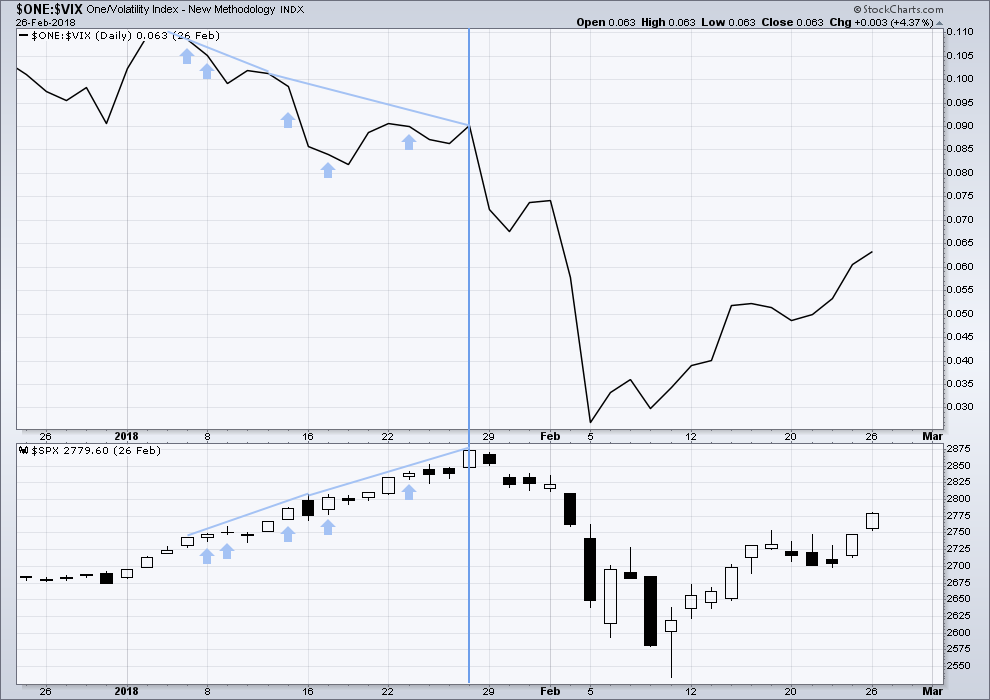
Click chart to enlarge. Chart courtesy of StockCharts.com.
This is a daily chart.
The strongest warning of an approaching intermediate degree correction at the daily chart level came from inverted VIX.
There was strong double bearish divergence at the high of intermediate wave (3), which is noted by the vertical line. There was also a sequence of five days of bearish divergence, days in which price moved higher but inverted VIX moved lower.
AD LINE
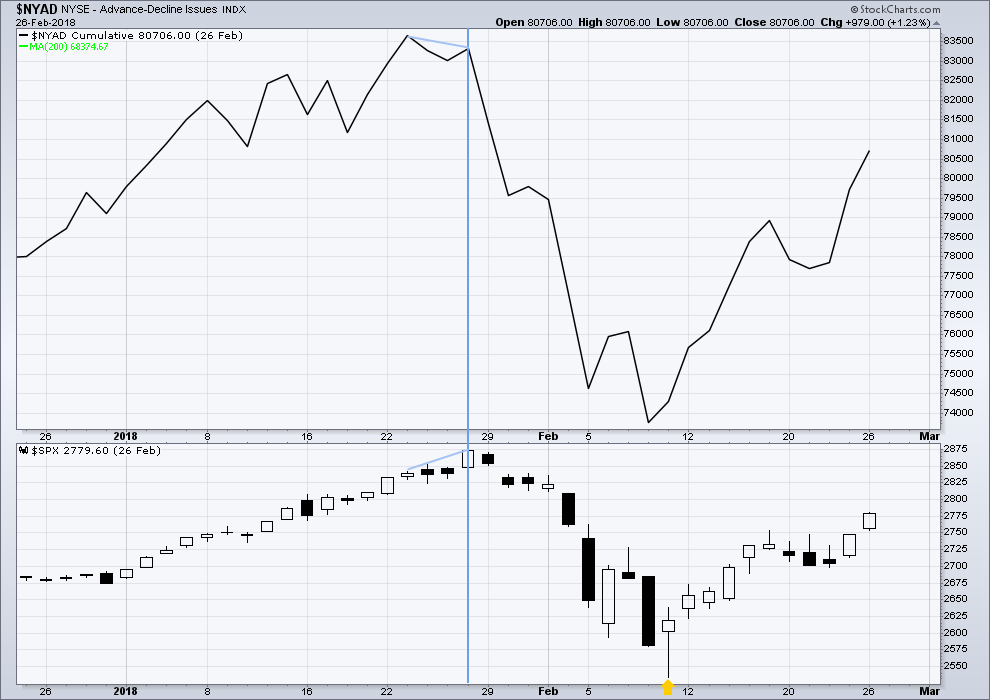
Click chart to enlarge. Chart courtesy of StockCharts.com.
This is a daily chart.
There was only single bearish divergence between price and the AD line at the end of intermediate wave (3). Approaching the high, there were no instances of price moving higher and the AD line moving lower.
Conclusion: When studying the behaviour of price and these indicators just before the start of intermediate wave (4), we may see some clues for warning us of primary wave 4. A cluster of bearish signals from VIX along with a bearish divergence from price and the AD line or On Balance Volume may warn of primary wave 4. The next instance will probably not behave the same as the last, but there may be similarities.
At this time, it does not look like primary wave 4 may begin right now, but we need to be aware of its approach.
Published @ 12:45 a.m. EST on 22nd September, 2018.
—
Careful risk management protects your trading account(s).
Follow my two Golden Rules:
1. Always trade with stops.
2. Risk only 1-5% of equity on any one trade.
As Kevin notes below, if subminuette wave iv overlaps into subminuette wave i price territory, then it can’t be subminuette wave iv
If that happens, then I’d move the degree of labelling for this pullback up one degree, it would then be labelled minuette wave (iv).
But for now, the invalidation point has not been breached, and importantly, the last gap which I have labelled a breakaway gap, remains open.
Remember, it is typical behaviour of price to curve down and test support at prior resistance after a breakout. So far that looks like what is happening.
Assume the most common scenario, until price proves it otherwise. If we approach market analysis in that way then simply on the basis of probability we shall be right more often than we are wrong. And if we are right more often than we are wrong, that should lead to more profits than losses.
There is still alternation in structure between subminuette waves ii and iv. The proportion is no longer very good, but it is not bad enough for me to change the wave count at this time.
Just so I’m clear on that gap: the lower edge of it is 2,910.17.
The low today so far is 2,912.63.
And so the gap has been pierced, but not closed.
And I’m making the decision now to move the degree of labelling for this pullback up one degree, because on the daily chart that’s how it’s looking.
Looking just at the hourly chart…this sell off doesn’t look done. My rough eyeball guess is that price is headed towards the 2890-2905 area.
In which case, counts will get blown, and I start to wonder: MIGHT the minor 5 wave be playing out as an ending diagonal? In which case this down leg becomes the D wave, and we get a final E up and…goodnight, P3, hello, P4?
I’m not sure if there’s a fit there or not but perhaps worth considering.
This…???
The overall market full of mixed signals. Dow down modestly, NDX printing a big reversal day with long lower wick. SPX meandering but off the lows…
Currently SOH and waiting for more clear signals…
Me too, ari. I grabbed a nice profit on Friday. Ready to go back in, either direction, when the next move looks reasonably clear.
There is no selling pressure in the market.
Falling under its own top-heavy bloat. If we get a new high this week. the first impulse down will likely blow past today’s lows.
Delta on some option chains more ridiculously mis-priced than I have seen in quite some time- broken markets!
wait until one of your banksters decides the gig is up and starts exiting. Just might start the instant bonfire! We all know it’s coming…but I still think we are probably a week or two away.
Could be. But you cannot trust them to do the obvious. Expect the un-expected.
DJIA led the recent ramp higher. A break of 26,500.00 could signal it is now leading the way down and just might warrant a wave count re-visit. Trend reversals at both interim tops and bottoms have been early of late.
We should get one more wave up with an immediate reversal signal, probably a MOABEC.
translation?
Mother of all bearish engulfing candles.
SPX right on top of hourly invalidation.
If it invalidates, that should mean that this iv down is a minuette iv, not a subminuette iv.
I note though that the proportions of this iv are in line with it being a minuette iv regardless. It’s of similar size in price and time, whereas the subminuette ii is far smaller in both.
So I’m guessing no matter what, this is minuette iv. Unless it invalidates……….2980.3 I believe.
you think AMD is still topping? just keeps winding up, and if we have SPX minuette v on deck, odds it breaks up
I don’t know. Looking strictly at this hourly chart…I’d say a long here isn’t a bad trade, per se. You could stop right under the lower Darvas box line (29.4) and risk maybe 8% for a potential 20% winner. And raise the stop to a bit over BE the moment the upper Darvas box line is exceeded.
Overall, I don’t see clear topping signs yet. But if AMD<29.4, get out or short would be my advice.
The 2912 Level is certainly being tested
Keeping in mind we live in an era when unrelenting CB market intervention has greatly lessened the reliability of market signals and made price discovery all but impossible, we have several indices displaying island reversal patterns.
We sold DIA 270 strike puts for 3.84 at the open.
We expect the banksters to continue to violently arrest market declines providing for a cheaper re-purchase.
There is only one way to interpret a market that posts 14 consecutive Hindenburg Omen, and that is that a market collapse in already underway.
Can the banksters continue to relentlessly focus buying power on advancing issues to mask market weakness? Of course they can. The question is how long….
I have a post awaiting moderation with a few links to good reads over at zero hedge about what may be headed our way. Enjoy!
We bailed way too early. lol! DIA 2.70 puts now bid at 4.90, ask 5.20!
Here’s hoping for one more bankster ramp so we can reload on the cheap! 🙂
Anyone else with the growing experience that ToS is virtually unusable early in the trading session? Been getting worse over the last few weeks, this morning I enter GS into a 4 TF window…and 7 minutes later I still only have a daily chart up. Worthless. Not happy (but since I only hold $11 in my ToS account…maybe they’ve noticed I haven’t traded there in 14 years and are throttling me??? No….).
Okay, update, this morning the ToS chat room is full of “charts broken”. But I’ll say that it has been generally degrading re: update time over the last several weeks, and today just seems the natural extension of it.
It may be worth given them a call and making some noise……
A few good reads! I pay very close attention to what Chris Cole has to say.
The second link about the Norwegian trader will be commonplace in US markets in the coming months.
https://www.zerohedge.com/news/2018-09-23/understanding-volatility-storm-come-part-1-fragility-markets-medium
https://www.zerohedge.com/news/2018-09-21/norwegian-power-trader-facing-bankruptcy-after-massive-black-swan-loss.
Be careful out there!
While the TA chart is completely bullish, the AD line and Vix are sounding warnings.
Primary wave 3 is expected to end, and primary wave 4 is expected to have some explosive downwards movement when it gets underway.
And so I would still recommend keeping stops relatively tight, whether members choose to use gaps, Elliott wave invalidation points, trend lines, or any other method you prefer.
I updated Bitcoin over at Elliott Wave Gold. You can find it here.
Thank you!!! Very informative. And what you’d pretty much expect from a tulip bulb craze reaching its terminal stages.
The most significantly bearish comment had to have been this regarding the weekly technical state: “This chart is completely bullish.”
Danger Will Robinson!!!
I’ll trust in the wave count though. “Top’s are a process.”
At the same time, the most significantly bullish comment had to have been this regarding the weekly technical state: “This chart is completely bullish.”
Going where no man (er’ woman) has gone before.
I too will trust the wave count. I’m looking for SPX 3000+ before the end of Primary wave 3. Below is a seasonality chart of the DJIA during mid-term election years. It is quite bullish for Oct through Dec. In fact it is the most bullish period of the year; up 4% on average. Perhaps this year will be similar. Perhaps.
If 2017 taught me anything, it’s that a completely bullish chart can always get *more* bullish…
Vvv-vvv-vvv-vvrrrrrooom.
Honk-honk!!
Doh! Maybe if I wasn’t visiting Iceland I might have been firsht! 🙂