
Upwards movement has resumed as the main Elliott wave count expected.
Summary: The pullback looks like is over. On Balance Volume makes new all time highs this week on the daily and weekly charts; this supports a bullish wave count. This view today remains unchanged; the short term volume profile remains bullish.
A new all time high above 2,916.50 would confirm the bullish wave count. At that stage, the target would then be in a small zone from 3,041 (Elliott wave) to 3,045 (classic analysis).
A new low below 2,802.49 would strongly indicate the bearish wave count is most likely. The target for a multi month consolidation of primary wave 4 would then be at either 2,698 (0.236 Fibonacci ratio) or 2,563 (0.382 Fibonacci ratio).
The final target for this bull market to end remains at 3,616, which may be met in October 2019.
New updates to this analysis are in bold.
The biggest picture, Grand Super Cycle analysis, is here.
Last historic analysis with monthly charts is here, video is here.
MAIN ELLIOTT WAVE COUNT – BULL
WEEKLY CHART
Click chart to enlarge.
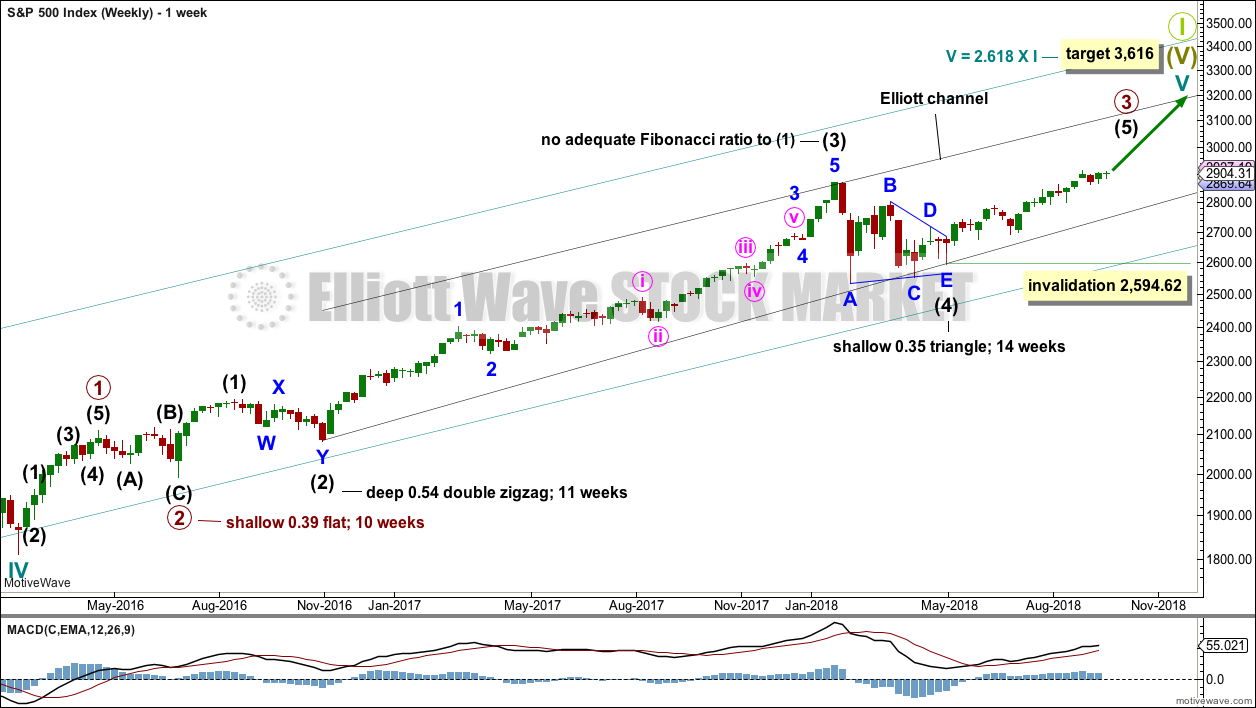
Cycle wave V must complete as a five structure, which should look clear at the weekly chart level and also now at the monthly chart level. It may only be an impulse or ending diagonal. At this stage, it is clear it is an impulse.
Within cycle wave V, the third waves at all degrees may only subdivide as impulses.
Intermediate wave (4) has breached an Elliott channel drawn using Elliott’s first technique. The channel is redrawn using Elliott’s second technique: the first trend line from the ends of intermediate waves (2) to (4), then a parallel copy on the end of intermediate wave (3). Intermediate wave (5) may end either midway within the channel, or about the upper edge.
There is perfect alternation and excellent proportion between intermediate waves (2) and (4).
At this stage, the expectation is for the final target to me met in October 2019. If price gets up to this target and either the structure is incomplete or price keeps rising through it, then a new higher target would be calculated.
DAILY CHART
Click chart to enlarge.
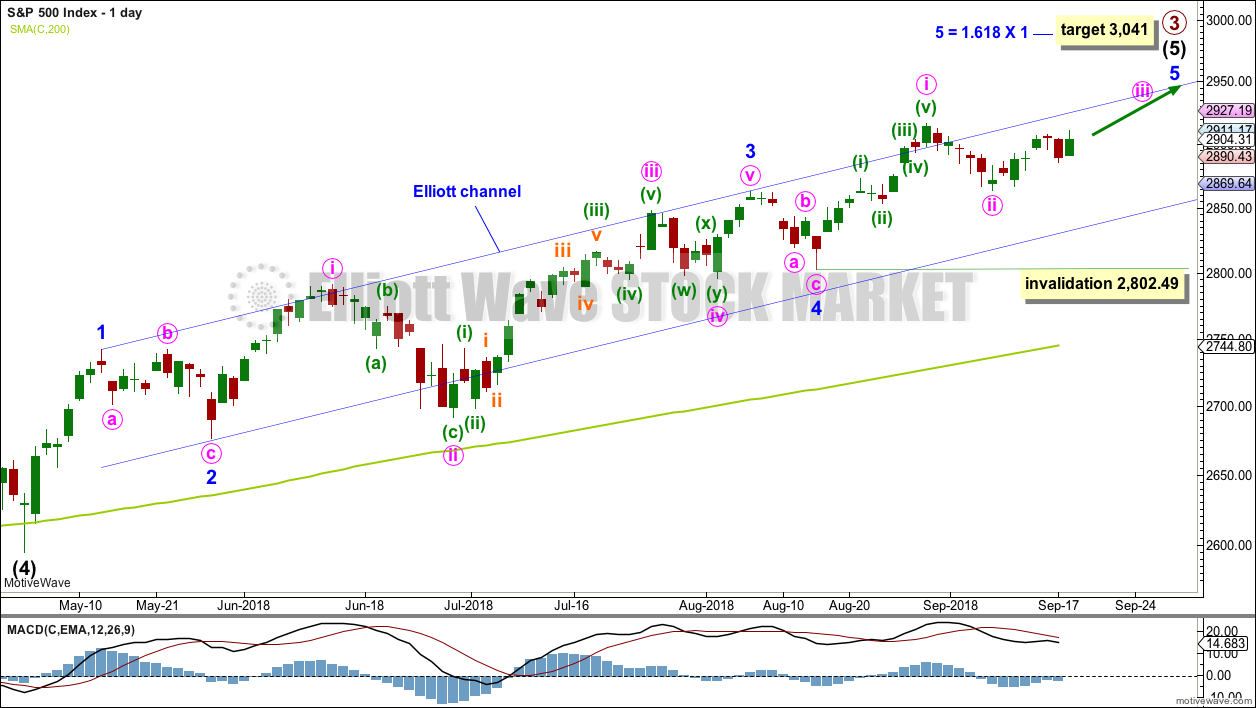
Intermediate wave (5) avoided a truncation now that it has a new high above the end of intermediate wave (3) at 2,872.87.
Intermediate wave (3) exhibits no Fibonacci ratio to intermediate wave (1). It is more likely then that intermediate wave (5) may exhibit a Fibonacci ratio to either of intermediate waves (1) or (3). Intermediate wave (5) has passed equality in length with intermediate wave (1). The next target was at 2,922, 1.618 the length of intermediate wave (1), which may have been almost met.
A target for intermediate wave (5) to end is recalculated at minor degree. Because this target is so close to the classic analysis target at 3,045, it does have a reasonable probability.
Intermediate wave (5) is unfolding as an impulse, and within it minor waves 1 through to 4 may now all be complete.
Assume the upwards trend remains intact while price remains above 2,802.49. The trend remains the same until proven otherwise.
HOURLY CHART
Click chart to enlarge.
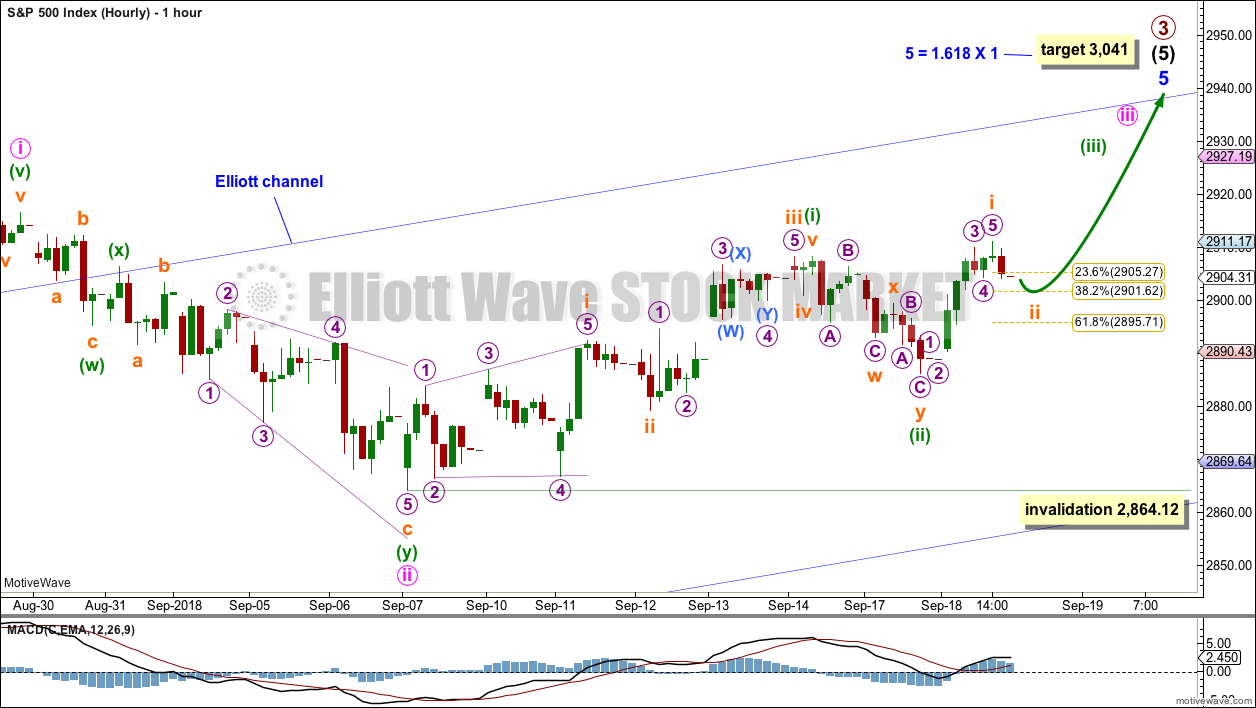
Because we should assume the trend remains the same, until proven otherwise, this will still remain the main wave count while price remains above 2,802.49. At the end of last week, it also now has good support from classic technical analysis.
Within intermediate wave (5) so far, minor wave 1 was relatively short and minor wave 3 extended (but does not exhibit a Fibonacci ratio to minor wave 1). Two actionary waves within an impulse may extend, so minor wave 5 may be extending.
Within minor wave 5, minute wave i may have been over at the last high. Minute wave ii may now be a completed double zigzag, ending just below the 0.382 Fibonacci ratio of minute wave i. Double zigzags are reasonably common structures.
Minute wave iii must subdivide as an impulse, and within it minuette wave (i) may now be complete.
Minuette wave (ii) fits as a completed double zigzag. It is also possible that minuette wave (ii) may continue sideways as a flat correction. Minuette wave (ii) may not move beyond the start of minuette wave (i) below 2,864.12.
There may now be almost three complete first and second waves to start minor wave 5. This wave count now expects to see an increase in upwards momentum over the next one to few days with a new all time high.
ALTERNATE ELLIOTT WAVE COUNT – BEAR
WEEKLY CHART
Click chart to enlarge.
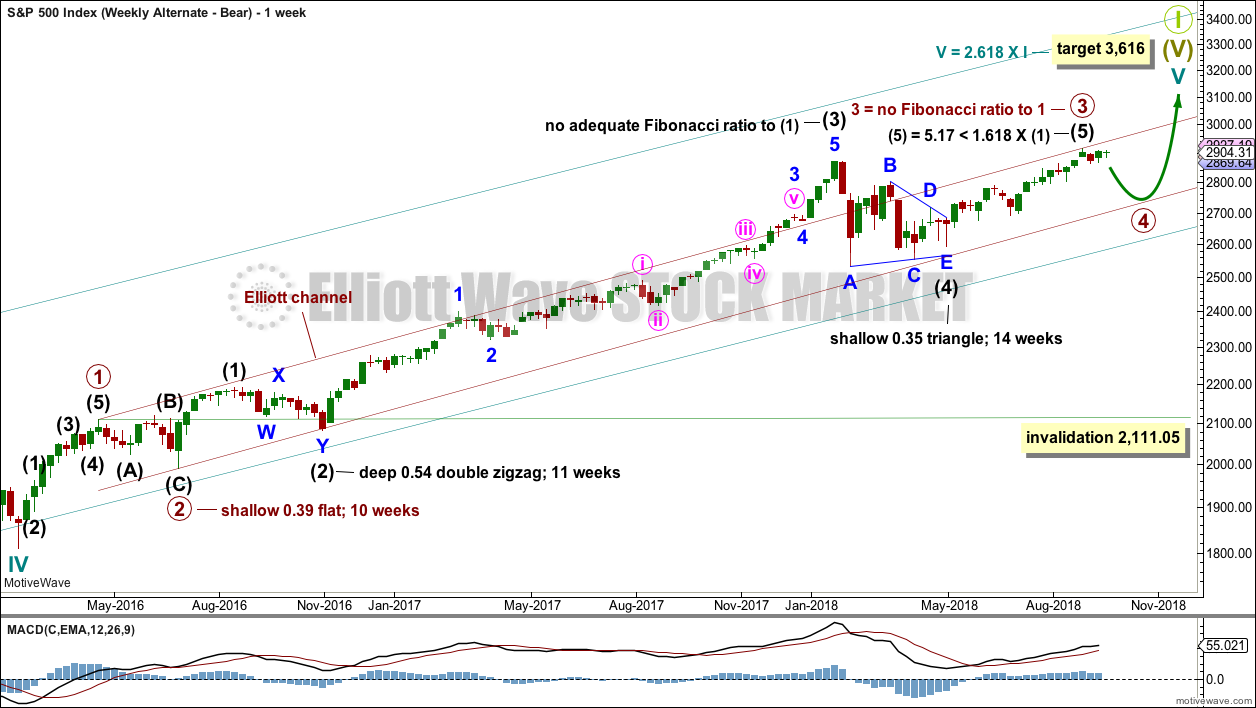
The probability of this alternate wave count is reduced at the end of last week because it does not have support from classic technical analysis.
It is possible that primary wave 3 was over at the last high. Fibonacci ratios are noted on the chart.
Primary wave 2 was a shallow flat lasting 10 weeks. Primary wave 4 may be expected to exhibit alternation in one or both of depth and structure. Primary wave 4 may last about a Fibonacci 8, 13 or possibly even 21 weeks to exhibit reasonable proportion to primary wave 2.
Primary wave 2 shows up on the monthly chart. Primary wave 4 may be expected to last at least one month, and likely longer, for the wave count to have the right look at the monthly chart level.
Primary wave 4 may end about the lower edge of the maroon Elliott channel. Primary wave 4 may end within the price territory of the fourth wave of one lesser degree: intermediate wave (4) has its price territory from 2,872.87 to 2,532.69.
The channel on this bear wave count is redrawn about primary degree waves using Elliott’s first technique. The overshoot at the end of intermediate wave (3) is very typical; third waves are usually the strongest wave within an impulse and may end with strength. The lower edge of this channel contains all deeper pullbacks since the end of primary wave 2, and so it looks fairly likely that primary wave 4 may end about the lower edge of this maroon channel.
If primary wave 4 is deeper than expected, then it should find very strong support at the lower edge of the teal channel. This channel, copied over from the monthly chart, has provided support for all deeper pullbacks within this bear market since March 2009.
Primary wave 4 may not move into primary wave 1 price territory below 2,111.05.
DAILY CHART
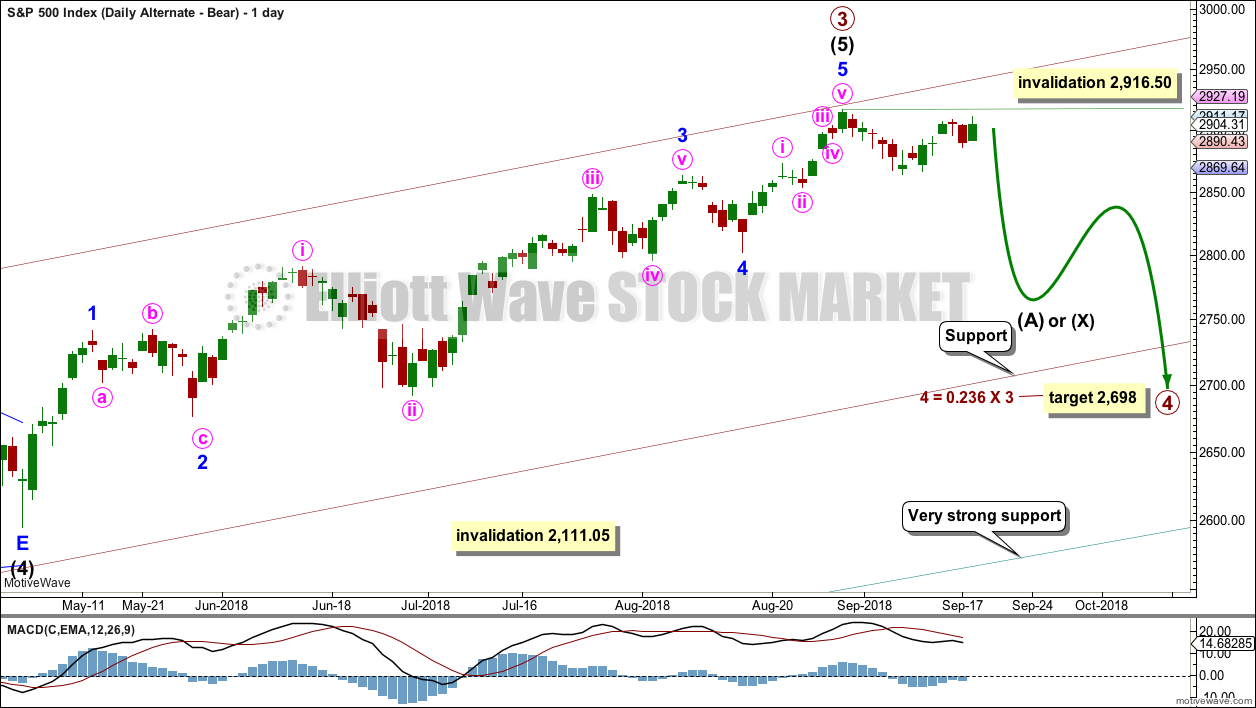
Click chart to enlarge.
The first movement down within primary wave 4 should be a five wave structure, which should be visible at the daily chart level. While that is incomplete, no second wave correction may move beyond the start of the first wave above 2,916.50.
Within the target range of 2,872.87 to 2,532.69 sit the 0.236 and 0.382 Fibonacci ratios of primary wave 3. The 0.236 Fibonacci ratio at 2,698 would be the first target. If price keeps falling through this first target, then the next target would be the 0.382 Fibonacci ratio at 2,563.
Primary wave 4 would most likely be a zigzag, combination or triangle. Within a zigzag, intermediate wave (A) must subdivide as a five wave structure. Within a combination or triangle, intermediate wave (A) (or (X) ) should subdivide as a three wave structure, most likely a zigzag.
Within primary wave 4, downwards waves may be swift and very strong.
HOURLY CHART
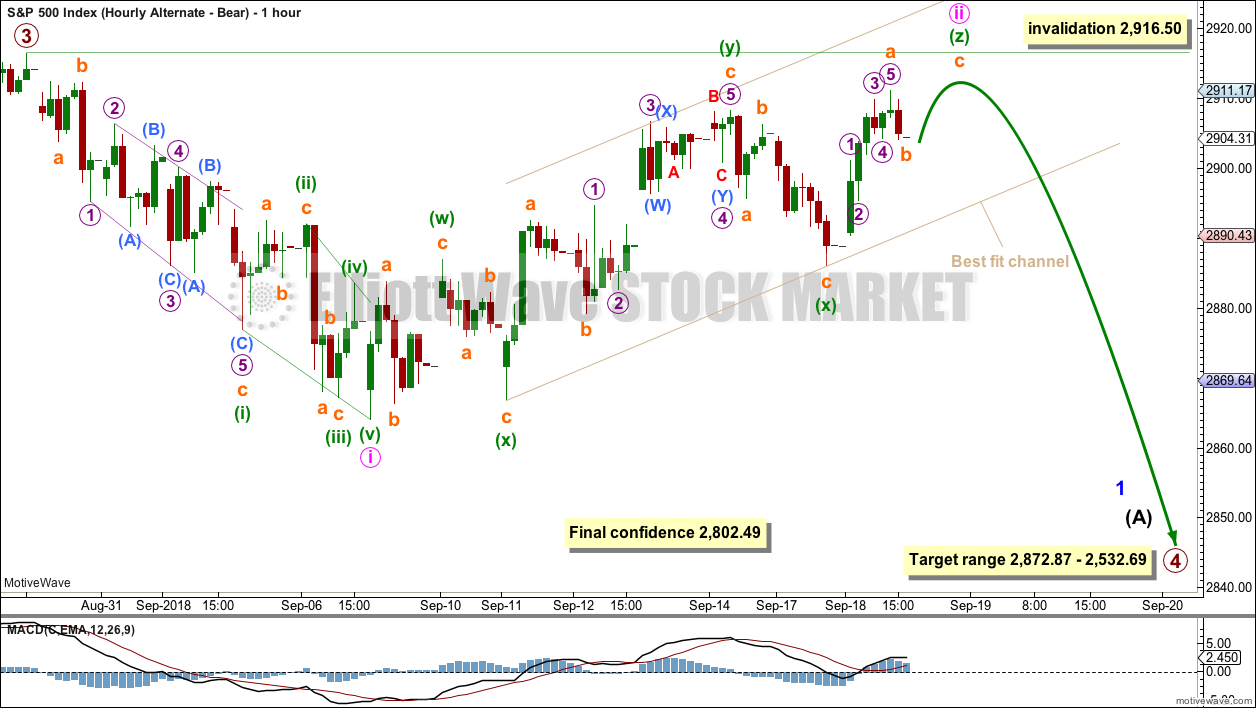
Click chart to enlarge.
The last wave down, which is here labelled minute wave i, is very choppy and overlapping and will not subdivide as an impulse.
Minute wave i may be seen as a leading contracting diagonal. Within a leading diagonal: sub-waves 1, 3 and 5 are most commonly zigzags but may also sub-divide as impulses, sub-waves 2 and 4 may only subdivide as zigzags, and wave 4 must overlap wave 1 price territory. Within a contracting diagonal, the trend lines must converge. This wave count meets all Elliott wave rules for a leading contracting diagonal, but the extended length of minuette wave (i) gives it a strange look.
Within the zigzag of minuette wave (i), subminuette wave c is seen as an ending expanding diagonal. Within micro wave 5, sub-micro wave (B) is not well contained within the diagonal trend lines. The trend lines do diverge but only barely. This structure also looks strange.
This wave count meets all Elliott wave rules, but it does not have the right look. The probability is low.
Minute wave ii no longer fits as a double zigzag. It may be continuing higher now as a reasonably rare triple zigzag. The rarity of triples must reduce the probability of this wave count further.
Minute wave ii may not move beyond the start of minute wave i above 2,916.50. A new all time high this week would firmly invalidate this bearish wave count at all time frames.
This bearish wave count now has three overlapping first and second waves complete. A reasonable increase in downwards momentum would now be expected for this wave count. If it is correct, then a new low below 2,802.49 should now occur within the next very few days to confirm it.
TECHNICAL ANALYSIS
WEEKLY CHART
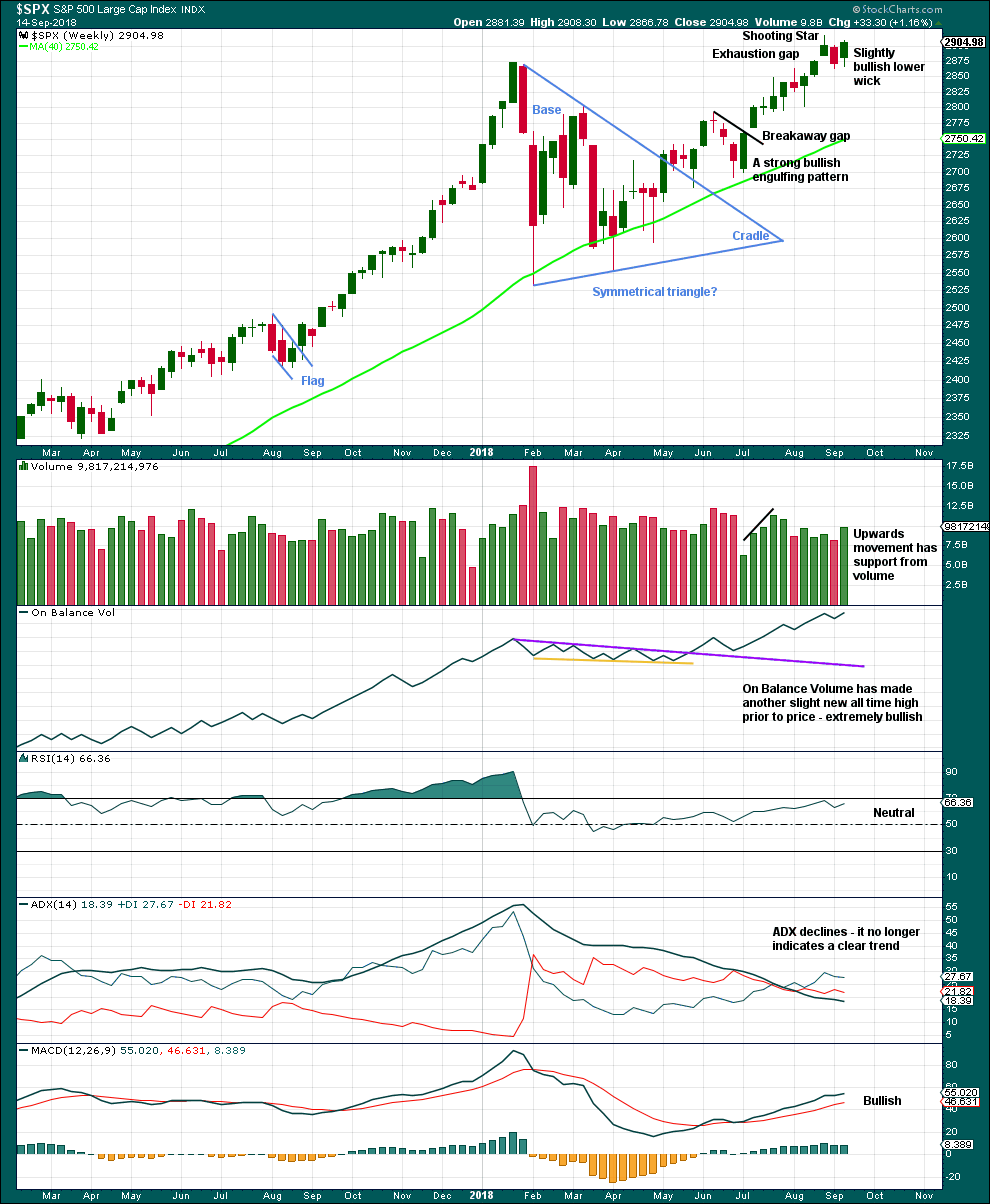
Click chart to enlarge. Chart courtesy of StockCharts.com.
The symmetrical triangle base distance is 340.18. Added to the breakout point of 2,704.54 this gives a target at 3,044.72. This is very close to the new Elliott wave target at 3,041.
It now looks most likely that the downwards week two weeks ago is a typical backtest of support after the new all time high.
The bullish signal from On Balance Volume is given reasonable weight in this analysis. It supports the main Elliott wave count.
DAILY CHART
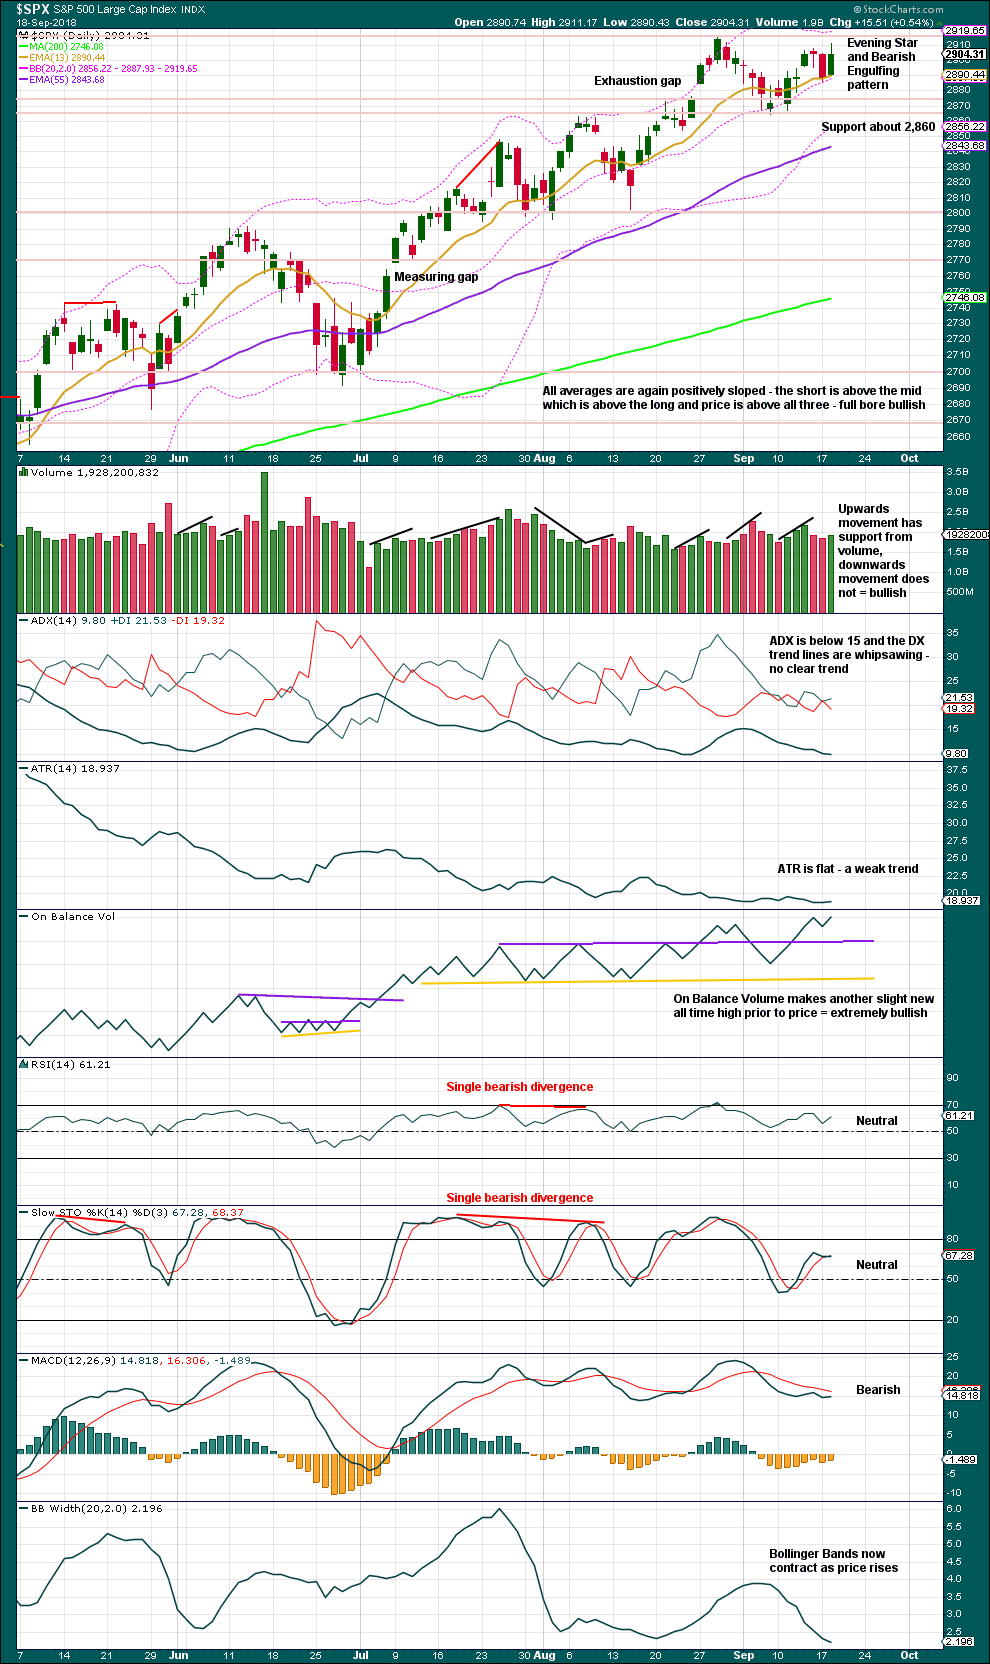
Click chart to enlarge. Chart courtesy of StockCharts.com.
Since the low on the 2nd of April, 2018, price has made a series of higher highs and higher lows. While the last swing low at 2,802.49 has not been breached, there will still be a series of higher highs and higher lows in place; the upwards trend should be assumed to remain intact until proven otherwise. A bullish engulfing candlestick pattern with support from volume comes after another pullback. This is a strong indication that the pullback may be over. Look now for the upwards trend to resume.
The last upwards gap is a pattern gap. These are usually closed.
A new all time high would be an upwards breakout of the current small consolidation. A new low below support at 2,864.12 would be a downwards breakout. It is a downwards day during the consolidation that has strongest volume, suggesting a downwards breakout may be more likely than upwards.
Yesterday’s Bearish Engulfing pattern and Evening Star are now followed by a bullish daily candlestick, which made a slight new high above the star in the Evening Star pattern. This reduces the bearish implications of the patterns; a new all time high here would indicate they would have failed.
The short term volume profile remains bullish.
VOLATILITY – INVERTED VIX CHART
WEEKLY CHART
Click chart to enlarge. Chart courtesy of StockCharts.com. So that colour blind members are included, bearish signals
will be noted with blue and bullish signals with yellow.
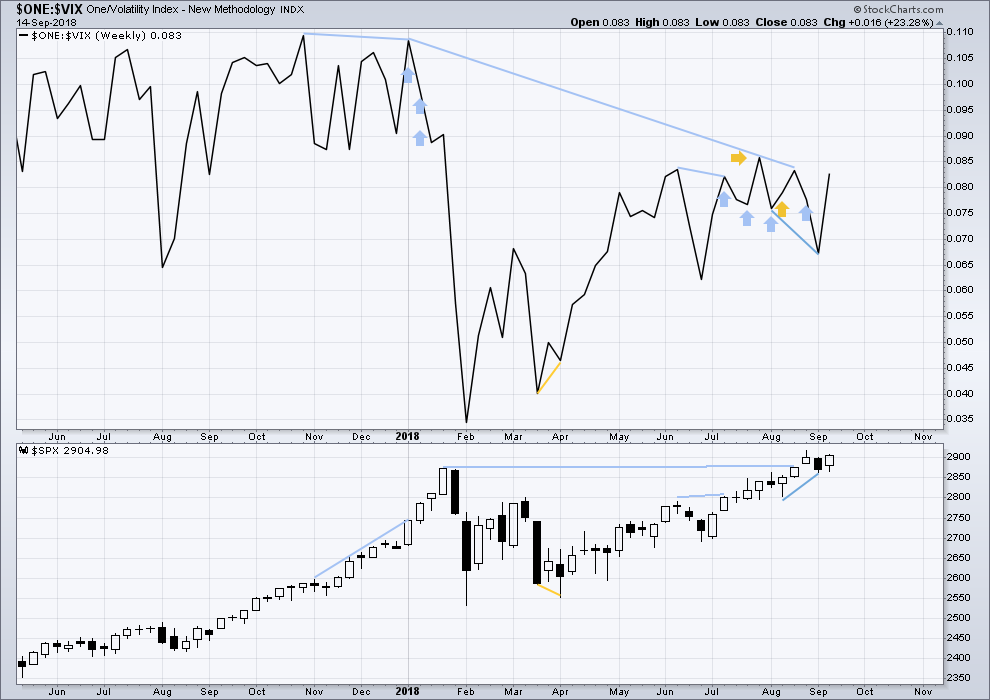
To keep an eye on the all time high for inverted VIX a weekly chart is required at this time.
Notice how inverted VIX has very strong bearish signals four weeks in a row just before the start of the last large fall in price. At the weekly chart level, this indicator may be useful again in warning of the end of primary wave 3.
At this time, there is mid term bearish divergence between price and inverted VIX: price has made a new all time high, but inverted VIX has not. This divergence may persist for some time. It may remain at the end of primary wave 3, and may develop further to the end of primary wave 5.
Strong bearish divergence noted two weeks ago has now been followed by an upwards week. It is considered to have failed.
Upwards movement in price has support last week from a normal corresponding decline in market volatility. There is no new divergence.
DAILY CHART
Click chart to enlarge. Chart courtesy of StockCharts.com. So that colour blind members are included, bearish signals
will be noted with blue and bullish signals with yellow.
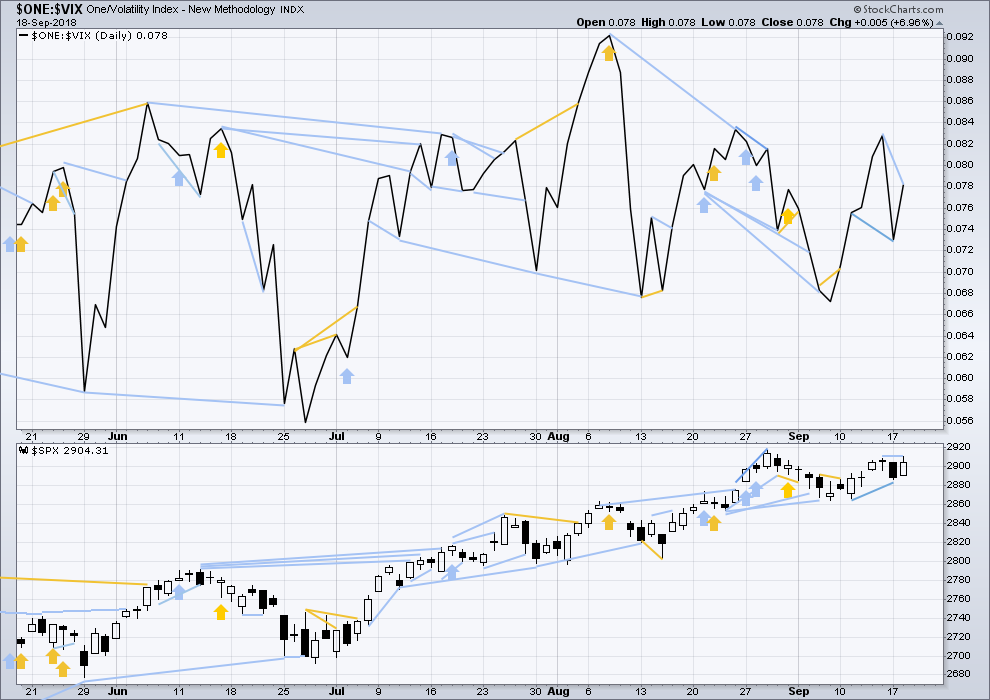
Normally, volatility should decline as price moves higher and increase as price moves lower. This means that normally inverted VIX should move in the same direction as price.
There is mid term divergence with a new all time high from price not supported by a corresponding new all time high from inverted VIX. This divergence is bearish.
Bearish divergence noted in yesterday’s analysis may have failed because of today’s reasonably strong upwards session.
Price has made a very slight new high above the high three session prior, but inverted VIX has not. Upwards movement today does not have support from a normal corresponding decline in market volatility. This short term divergence is bearish.
BREADTH – AD LINE
WEEKLY CHART
Click chart to enlarge. Chart courtesy of StockCharts.com.
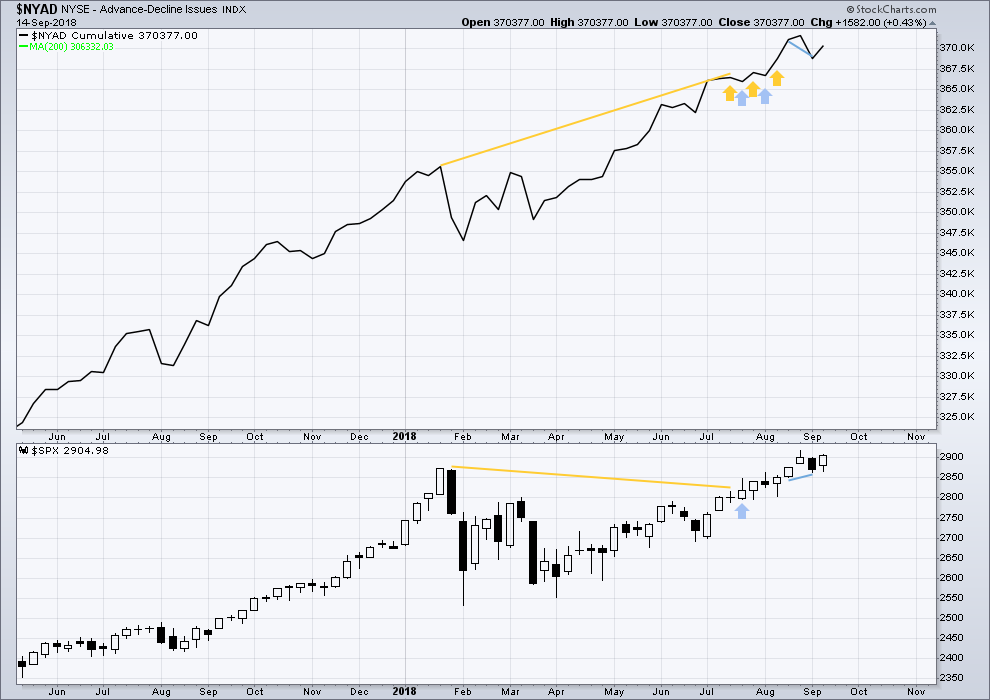
When primary wave 3 comes to an end, it may be valuable to watch the AD line at the weekly time frame as well as the daily.
Short term weak divergence between price and the AD line noted last week has now been followed by an upwards week. It is considered to have failed.
There is no new divergence this week between price and the AD line.
DAILY CHART
Click chart to enlarge. Chart courtesy of StockCharts.com.
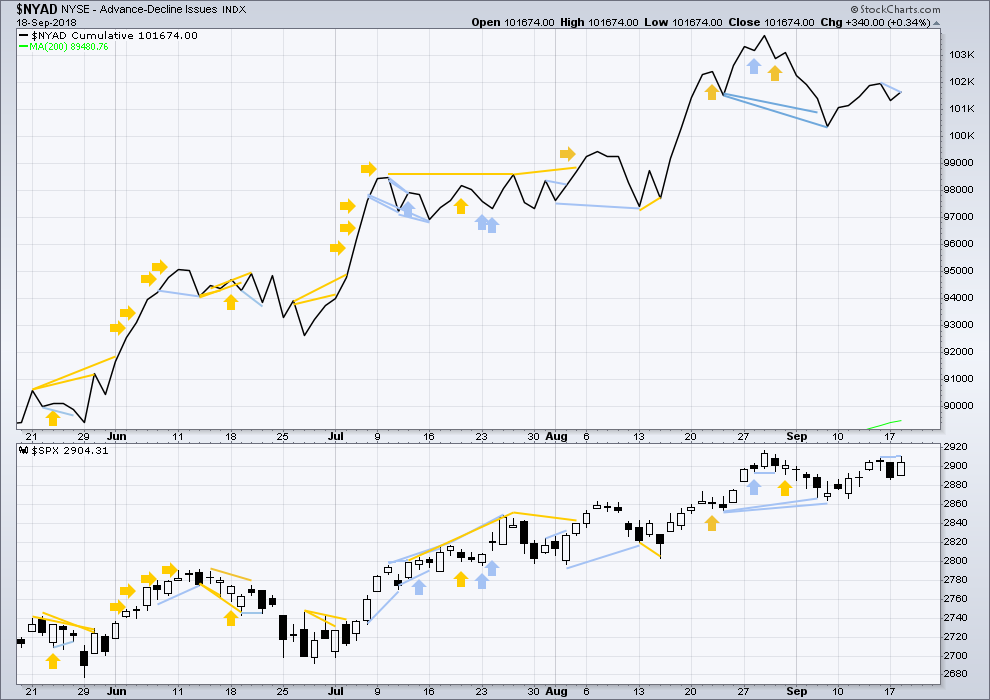
There is normally 4-6 months divergence between price and market breadth prior to a full fledged bear market. This has been so for all major bear markets within the last 90 odd years. With no longer term divergence yet at this point, any decline in price should be expected to be a pullback within an ongoing bull market and not necessarily the start of a bear market. New all time highs from the AD line means that any bear market may be an absolute minimum of 4 months away. It may of course be a lot longer than that. My next expectation for the end of this bull market may now be October 2019.
Breadth should be read as a leading indicator.
Rising price has support from rising market breadth, but breadth is not rising as fast as price. This is a little bearish. Some divergence towards the end of primary wave 3 may be expected to develop; this bearishness may fit the main Elliott wave count.
Price has made a very slight new high above the high three sessions prior, but the AD line has not. Today’s short term divergence is bearish, but it is weak.
All of small, mid and large caps made new all time highs on the 27th of August. There is a little divergence here in breadth with large caps continuing to make new all time highs on the 29th of August and small and mid caps lagging.
All of small, mid and large caps saw price rise last week. The rise in price has support from market breadth.
DOW THEORY
The following lows need to be exceeded for Dow Theory to confirm the end of the bull market and a change to a bear market:
DJIA: 23,360.29.
DJT: 9,806.79.
S&P500: 2,532.69.
Nasdaq: 6,630.67.
Nasdaq and DJT and now the S&P500 have all made recent new all time highs. For Dow Theory confirmation of the ongoing bull market, DJIA needs to make a new all time high.
DJT made another new all time high last week. It may be leading the market.
Charts showing each prior major swing low used for Dow Theory may be seen at the end of this analysis here.
ANALYSIS OF THE END OF INTERMEDIATE WAVE (3)
TECHNICAL ANALYSIS
Click chart to enlarge. Chart courtesy of StockCharts.com.
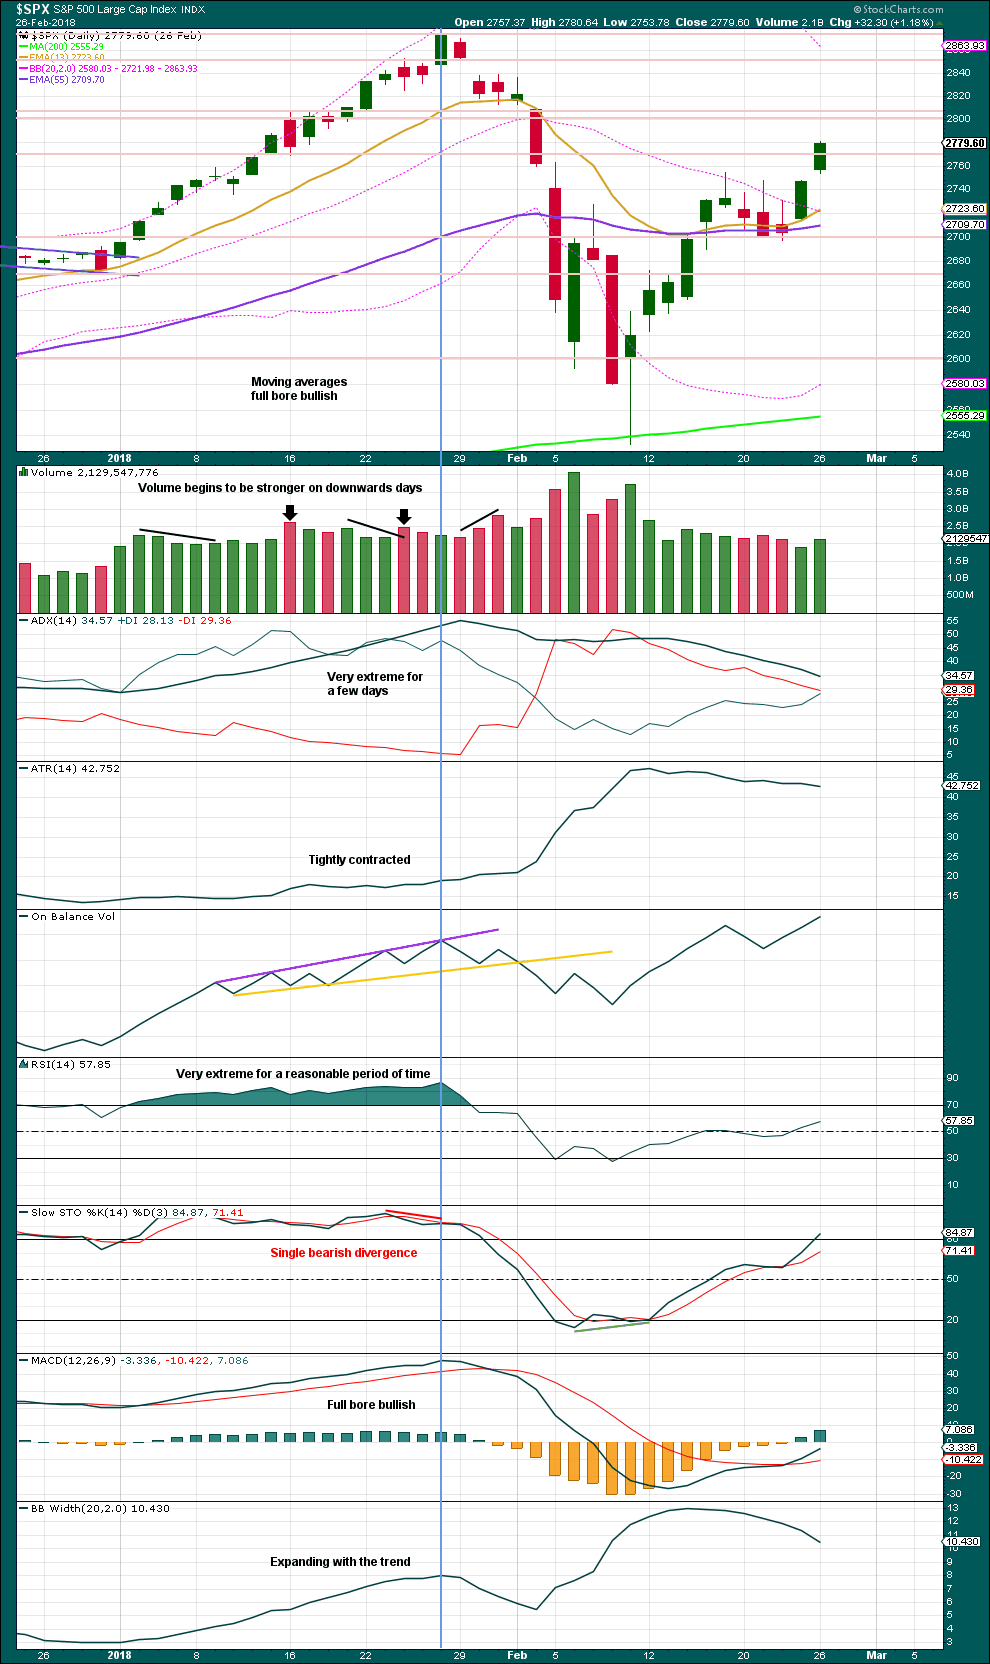
This chart looked overly bullish at the end of intermediate wave (3). The only warning in hindsight may have been from volume spiking slightly on downwards days. There was no bearish divergence between price and either of RSI or On Balance Volume.
Single bearish divergence between price and Stochastics was weak, which is often an unreliable signal.
VIX
Click chart to enlarge. Chart courtesy of StockCharts.com.
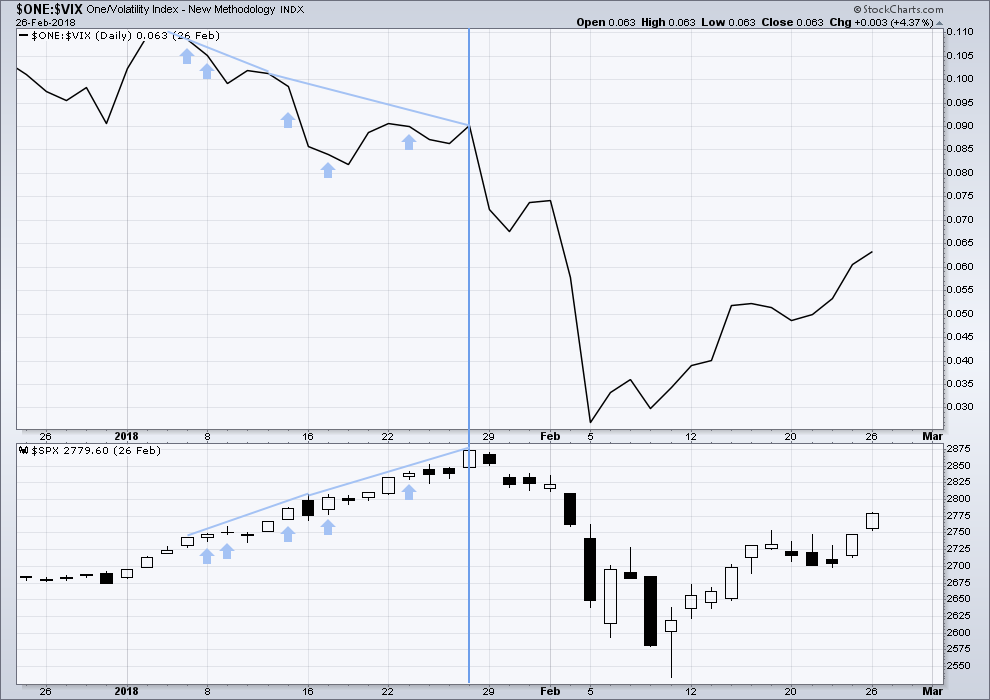
This is a daily chart.
The strongest warning of an approaching intermediate degree correction at the daily chart level came from inverted VIX.
There was strong double bearish divergence at the high of intermediate wave (3), which is noted by the vertical line. There was also a sequence of five days of bearish divergence, days in which price moved higher but inverted VIX moved lower.
AD LINE
Click chart to enlarge. Chart courtesy of StockCharts.com.
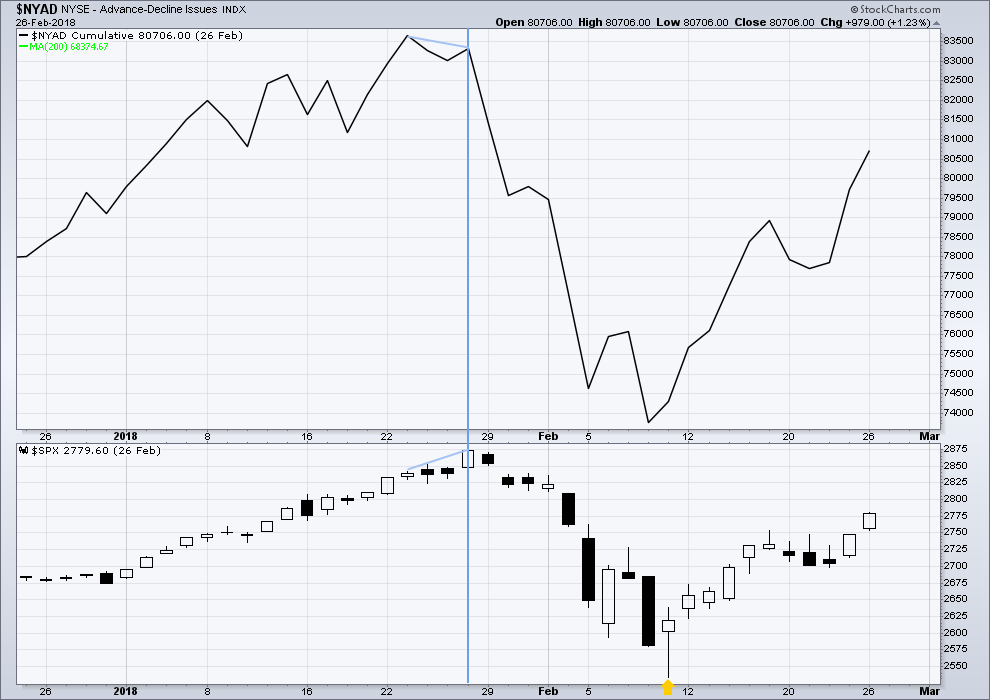
This is a daily chart.
There was only single bearish divergence between price and the AD line at the end of intermediate wave (3). Approaching the high, there were no instances of price moving higher and the AD line moving lower.
Conclusion: When studying the behaviour of price and these indicators just before the start of intermediate wave (4), we may see some clues for warning us of primary wave 4. A cluster of bearish signals from VIX along with a bearish divergence from price and the AD line or On Balance Volume may warn of primary wave 4. The next instance will probably not behave the same as the last, but there may be similarities.
At this time, it does not look like primary wave 4 may begin right now, but we need to be aware of its approach.
Published @ 08:08 p.m. EST.
—
Careful risk management protects your trading account(s).
Follow my two Golden Rules:
1. Always trade with stops.
2. Risk only 1-5% of equity on any one trade.
Just so you all know, I’m discarding the idea of a small fourth wave triangle completed today. The trend lines are just wrong.
Got my eye on ZEN, which is in a weekly/monthly strong uptrend. The daily shows “yet another” pullback in place, which should lead to another excellent entry long.
The 3 white lines are symmetric projections of similar down moves.
This will bottom and turn sometime between “now” and a few days. A touch and bounce off the lower purple dynamic range line would be perfect.
The hourly view. I’m looking for a trend line break after a fibo bounce. A polarity inversion is nice but the hourly swing high here is $1.5 or more up from where the TL is likely to break so I’ll use the TL only. Given the small pullback overall…I’ll reduce size to 1/4 to 1/3, in case this move extends deeper. I’ll use a stop under the appropriate fibo, AND if it’s hit, reenter at larger size on the next deeper similar set up. How I play the game (sometimes). Hand to hand combat with the instrument until profits are extracted!
Hourly chart updated:
It looks like a small triangle is unfolding. On the 5 minute chart the subdivisions fit nicely. but the proportion between micro waves 2 and 4 do not.
EW triangles are always continuation patterns.
We may see a new ATH tomorrow.
Yea, it’s been looking a bit “fourth-wavey” today. This fits.
A weekly view of the RUT, which is getting hammered today. However, at this TF, there is no structural damage, and if anything, this is indicating a good long set up is approach, if and as the RUT hits and turns off one of those fibo clusters underneath (sitting on one now as a matter of fact). And very little risk of a weekly level swing low that is lower than the prior. A nominal pullback…so far.
Finance rocking today on the continued rise in interest rates. WFC bouncing very nicely off the fibo levels I pointed out yesterday.
SPX currently doing a small TF ii down. Next fibo level for a possible turn is 2901.6 (38%), then 2998.7 (50%), then 2995.7 (62%), then 2991.5 (78%). One of ’em will hold.
Here’s XLF weekly.
It’s broken upward out of 15 weeks or so of squeeze! And the weekly trend is now shifted from “neutral” to “strongly up”. The upper Darvas resistance line is blown through. And the MACD at this TF is clearly “up”.
It’s a bullish chart.
VIX now below 12…and one of the greatest long volatility set ups in history approaches (the P4 down of course). However, VIX might even get to the mid 10’s before the P4 launches and VIX heads up to 40. Patience Skywalker….
Right you are Kevin……although I really don’t see how it starts without the banksters stopping. Last two candles you can see them plain as day.
All it takes is a few of those banksters deciding the gig is up, and starting to take their massive profits. That trickle turns into a torrent. Witness last Jan/early Feb. It’ll happen again, as you know, and it’s coming soon.
The deteriorating breadth ( 11 consecutive H.O.s!) and anemic volume suggests to me this last wave up is being engineered with freakish leverage focused in select index components. The initial sign of the unwind could be a MOABEC. (mother of all bearish engulfing candles)
As to the banksters stopping, it is my view that that they are not going to.
This is one reason I am very concerned that what is coming next is going to merely be a normal correction. We can clearly see from the price action that the banksters are hell bent on doing their level best to arrest any and all market declines, and that suggests, at least to me that the next serious decline is going to take place in a context of their doing their utmost to prevent it. If that is the case, it means the next serious market decline is going to occur despite their best efforts to reverse it and so a sign of their loss of control. An awful lot of hedge fund traders have left this market and with the remarkably low and declining volume and breadth, the banksters are the only ones back-stopping this market. There are simply no short sellers who are normally responsible for hammering out market bottoms when they cover short positions. Interesting times we live in!
VIX needs to fill open gap at 11.31.
Then it’s time to back up the 18 wheeler.
Reverse split in SVXY hysterically funny.
ProShares hoping folk have already forgotten the last scam.
Look for it to head back to the teens as P4 unfolds.
Five minutes to open and FIRST. The loneliest number.
You were first to post. That is a winner.