
Upwards movement continues as the main Elliott wave count expects.
The alternate Elliott wave count remains valid, but it has less support from classic technical analysis, so it is judged to have a lower probability.
Summary: The pullback looks like it is over. There is a bullish engulfing candlestick pattern to indicate a trend change, and upwards movement has support from volume and rising market breadth.
A new all time high above 2,916.50 would confirm the bullish wave count. At that stage, the target would then be in a small zone from 3,041 (Elliott wave) to 3,045 (classic analysis).
A new low below 2,802.49 would strongly indicate the bearish wave count is most likely. The target for a multi month consolidation of primary wave 4 would then be at either 2,698 (0.236 Fibonacci ratio) or 2,563 (0.382 Fibonacci ratio).
The final target for this bull market to end remains at 3,616, which may be met in October 2019.
New updates to this analysis are in bold.
The biggest picture, Grand Super Cycle analysis, is here.
Last historic analysis with monthly charts is here, video is here.
MAIN ELLIOTT WAVE COUNT – BULL
WEEKLY CHART
Click chart to enlarge.
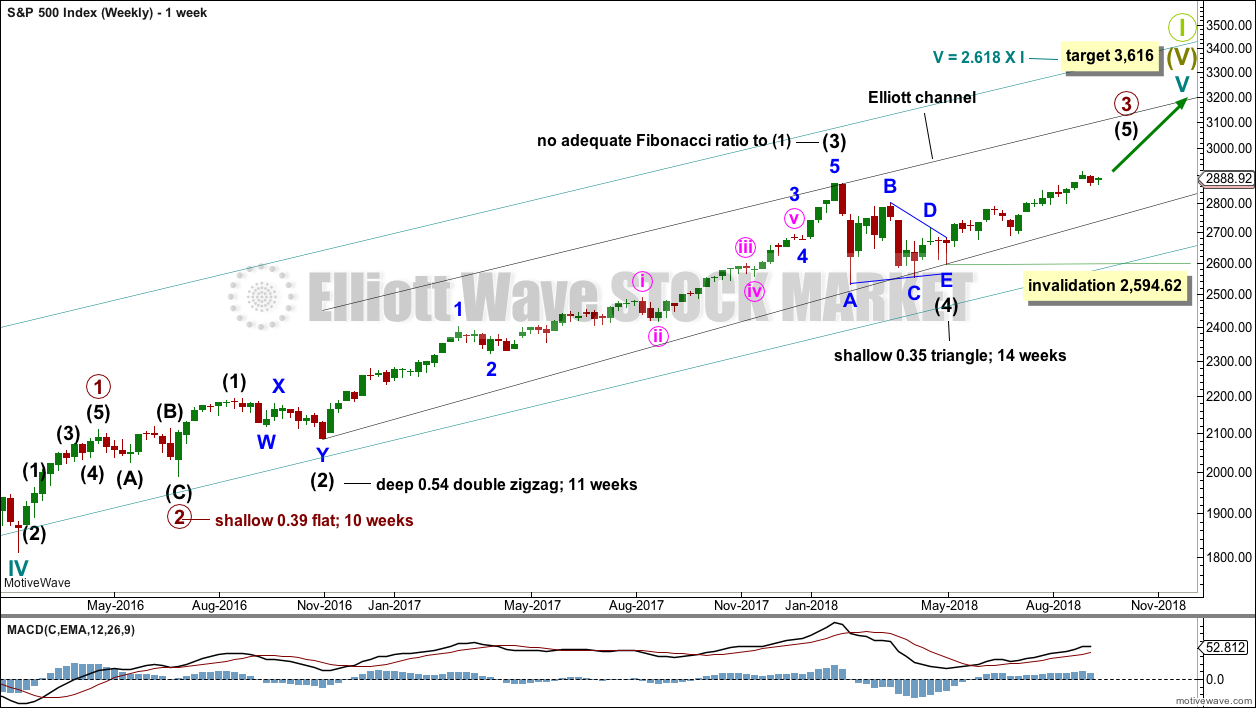
Cycle wave V must complete as a five structure, which should look clear at the weekly chart level and also now at the monthly chart level. It may only be an impulse or ending diagonal. At this stage, it is clear it is an impulse.
Within cycle wave V, the third waves at all degrees may only subdivide as impulses.
Intermediate wave (4) has breached an Elliott channel drawn using Elliott’s first technique. The channel is redrawn using Elliott’s second technique: the first trend line from the ends of intermediate waves (2) to (4), then a parallel copy on the end of intermediate wave (3). Intermediate wave (5) may end either midway within the channel, or about the upper edge.
There is perfect alternation and excellent proportion between intermediate waves (2) and (4).
At this stage, the expectation is for the final target to me met in October 2019. If price gets up to this target and either the structure is incomplete or price keeps rising through it, then a new higher target would be calculated.
DAILY CHART
Click chart to enlarge.
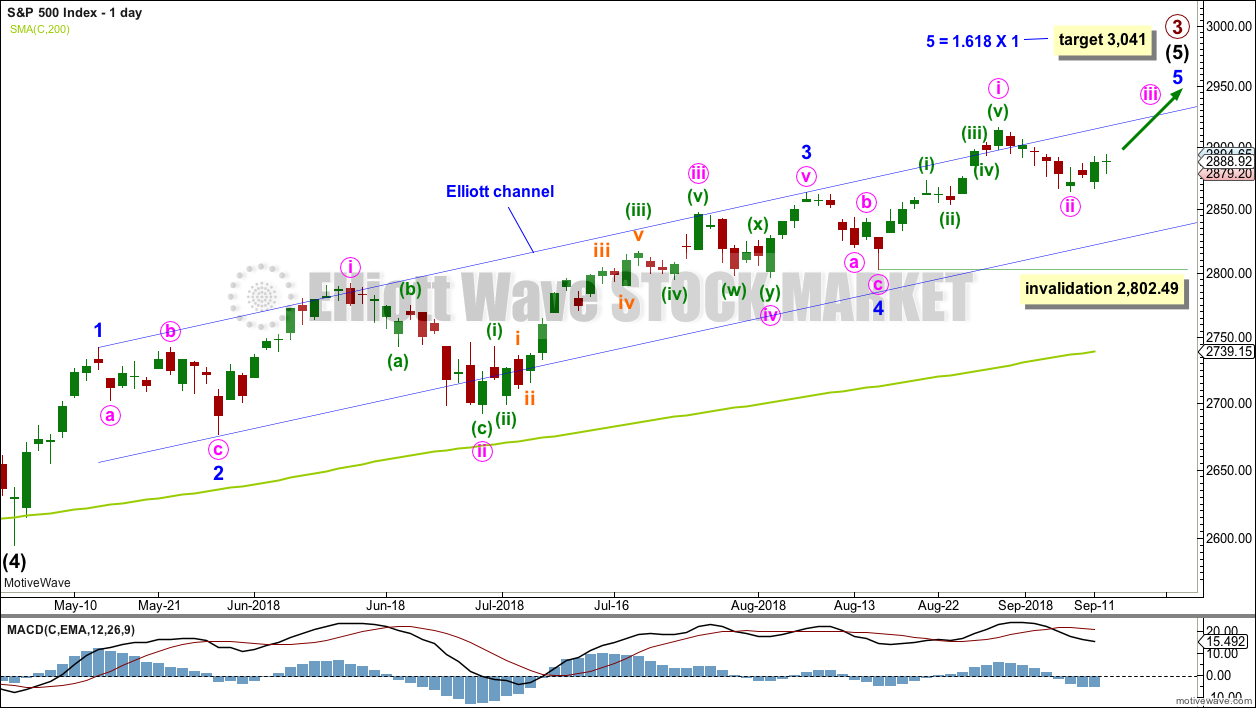
Intermediate wave (5) avoided a truncation now that it has a new high above the end of intermediate wave (3) at 2,872.87.
Intermediate wave (3) exhibits no Fibonacci ratio to intermediate wave (1). It is more likely then that intermediate wave (5) may exhibit a Fibonacci ratio to either of intermediate waves (1) or (3). Intermediate wave (5) has passed equality in length with intermediate wave (1). The next target was at 2,922, 1.618 the length of intermediate wave (1), which may have been almost met.
A target for intermediate wave (5) to end is recalculated at minor degree. Because this target is so close to the classic analysis target at 3,045, it does have a reasonable probability.
Intermediate wave (5) is unfolding as an impulse, and within it minor waves 1 through to 4 may now all be complete.
Assume the upwards trend remains intact while price remains above 2,802.49. The trend remains the same until proven otherwise.
HOURLY CHART
Click chart to enlarge.
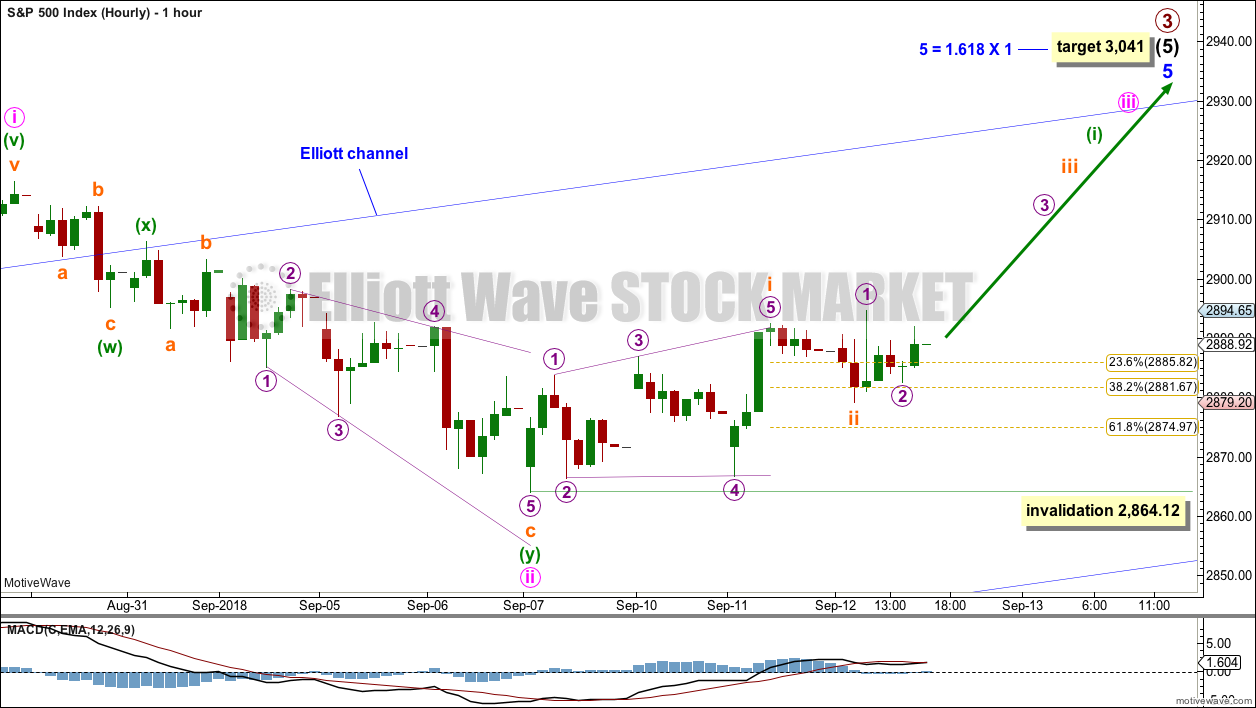
Because we should assume the trend remains the same, until proven otherwise, this will still remain the main wave count while price remains above 2,802.49. It has some support from classic technical analysis with a bullish engulfing candlestick pattern on the daily chart, and rising price has support from rising volume.
Within intermediate wave (5) so far, minor wave 1 was relatively short and minor wave 3 extended (but does not exhibit a Fibonacci ratio to minor wave 1). Two actionary waves within an impulse may extend, so minor wave 5 may be extending.
Within minor wave 5, minute wave i may have been over at the last high. Minute wave ii may now be a completed double zigzag, ending just below the 0.382 Fibonacci ratio of minute wave i.
Minute wave iii may have begun with a leading expanding diagonal, which is labelled subminuette wave i. Subminuette wave ii may be over as a relatively shallow zigzag. There may now be two first and second waves complete. Some increase in upwards momentum may happen over the next two sessions.
If minute wave ii continues any lower, it may not move beyond the start of minute wave i below 2,802.49.
ALTERNATE ELLIOTT WAVE COUNT – BEAR
WEEKLY CHART
Click chart to enlarge.
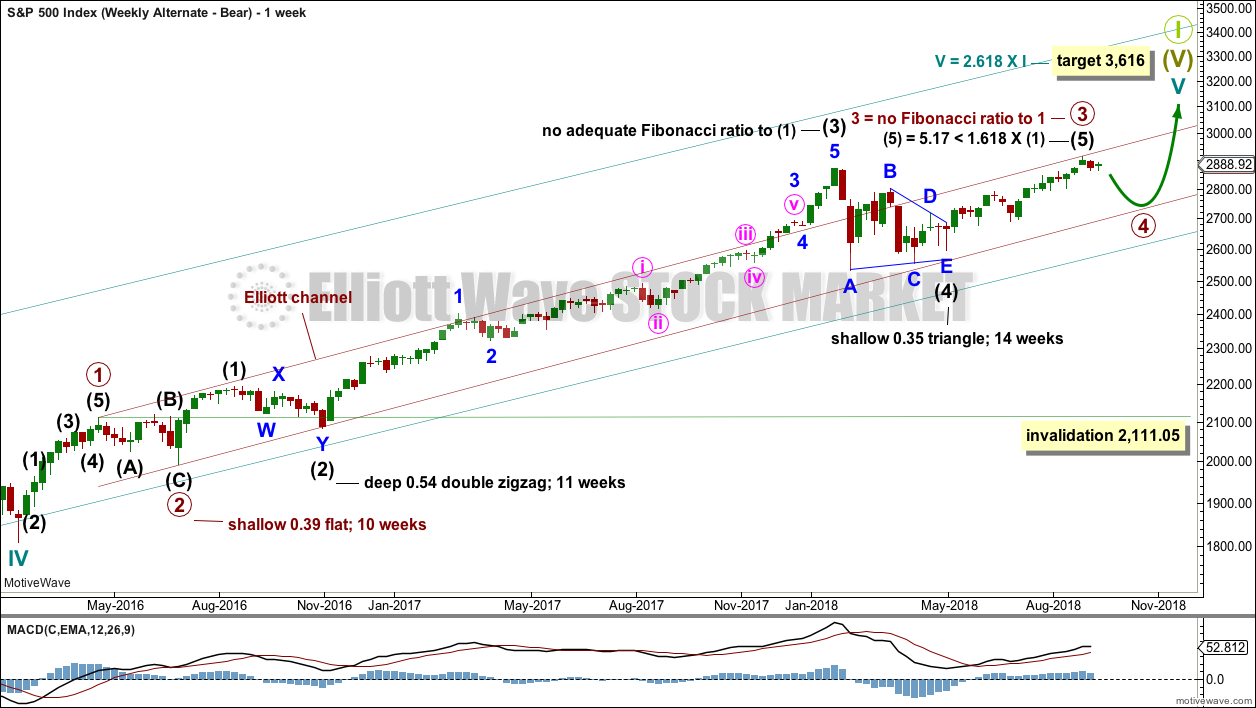
It is possible that primary wave 3 was over at the last high. Fibonacci ratios are noted on the chart.
Primary wave 2 was a shallow flat lasting 10 weeks. Primary wave 4 may be expected to exhibit alternation in one or both of depth and structure. Primary wave 4 may last about a Fibonacci 8, 13 or possibly even 21 weeks to exhibit reasonable proportion to primary wave 2.
Primary wave 2 shows up on the monthly chart. Primary wave 4 may be expected to last at least one month, and likely longer, for the wave count to have the right look at the monthly chart level.
Primary wave 4 may end about the lower edge of the maroon Elliott channel. Primary wave 4 may end within the price territory of the fourth wave of one lesser degree: intermediate wave (4) has its price territory from 2,872.87 to 2,532.69.
The channel on this bear wave count is redrawn about primary degree waves using Elliott’s first technique. The overshoot at the end of intermediate wave (3) is very typical; third waves are usually the strongest wave within an impulse and may end with strength. The lower edge of this channel contains all deeper pullbacks since the end of primary wave 2, and so it looks fairly likely that primary wave 4 may end about the lower edge of this maroon channel.
If primary wave 4 is deeper than expected, then it should find very strong support at the lower edge of the teal channel. This channel, copied over from the monthly chart, has provided support for all deeper pullbacks within this bear market since March 2009.
Primary wave 4 may not move into primary wave 1 price territory below 2,111.05.
DAILY CHART
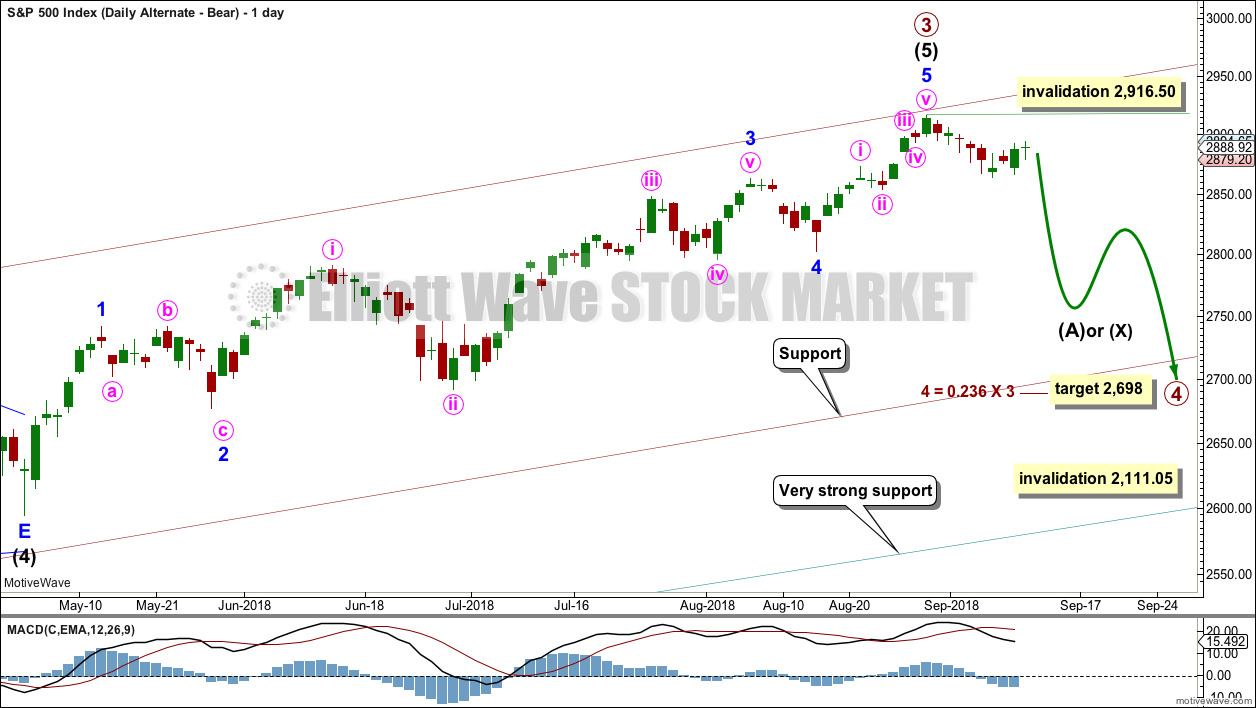
Click chart to enlarge.
The first movement down within primary wave 4 should be a five wave structure, which should be visible at the daily chart level. While that is incomplete, no second wave correction may move beyond the start of the first wave above 2,916.50.
Within the target range of 2,872.87 to 2,532.69 sit the 0.236 and 0.382 Fibonacci ratios of primary wave 3. The 0.236 Fibonacci ratio at 2,698 would be the first target. If price keeps falling through this first target, then the next target would be the 0.382 Fibonacci ratio at 2,563.
Primary wave 4 would most likely be a zigzag, combination or triangle. Within a zigzag, intermediate wave (A) must subdivide as a five wave structure. Within a combination or triangle, intermediate wave (A) (or (X) ) should subdivide as a three wave structure, most likely a zigzag.
Within primary wave 4, downwards waves may be swift and very strong.
HOURLY CHART
Click chart to enlarge.
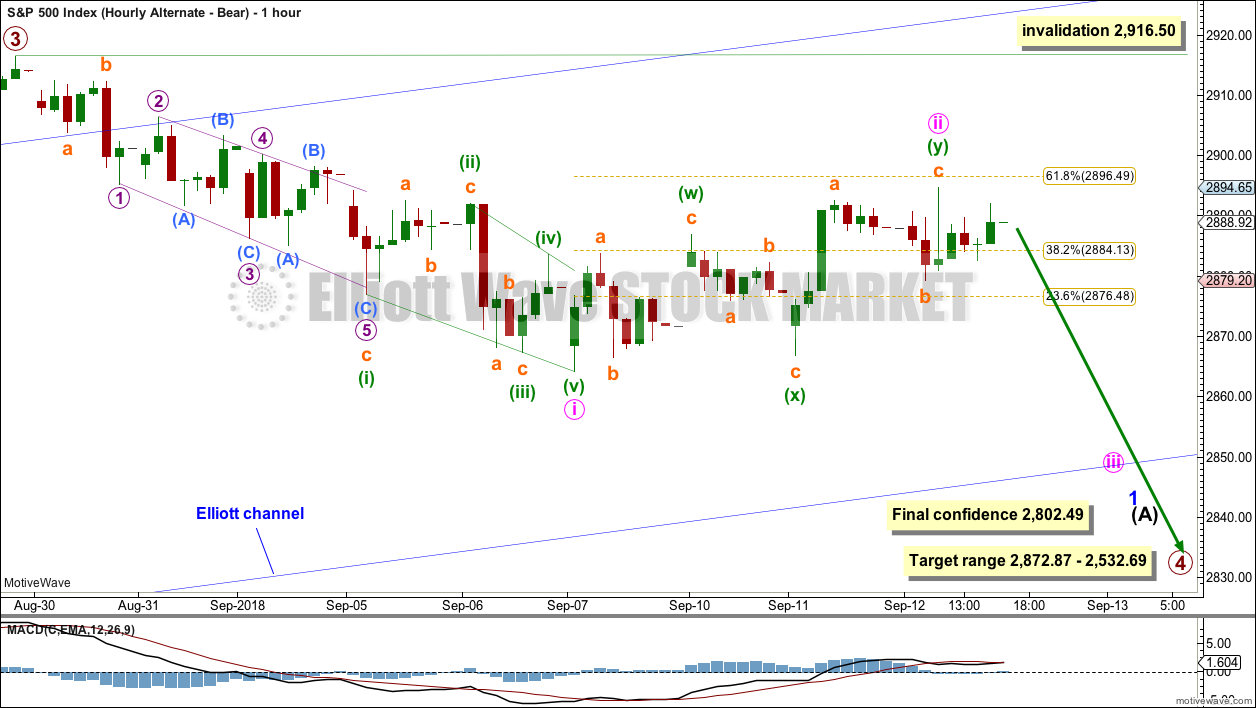
The last wave down, which is here labelled minute wave i, is very choppy and overlapping and will not subdivide as an impulse.
Minute wave i may be seen as a leading contracting diagonal. Within a leading diagonal: sub-waves 1, 3 and 5 are most commonly zigzags but may also sub-divide as impulses, sub-waves 2 and 4 may only subdivide as zigzags, and wave 4 must overlap wave 1 price territory. Within a contracting diagonal, the trend lines must converge. This wave count meets all Elliott wave rules for a leading contracting diagonal, but the extended length of minuette wave (i) gives it a strange look.
Within the zigzag of minuette wave (i), subminuette wave c is seen as an ending expanding diagonal. Within micro wave 5, sub-micro wave (B) is not well contained within the diagonal trend lines. The trend lines do diverge but only barely. This structure also looks strange.
This wave count meets all Elliott wave rules, but it does not have the right look. The probability is low.
Minute wave ii may have ended today close to the 0.618 Fibonacci ratio as a double zigzag. If it continues any higher as a relatively rare triple zigzag, then it may not move beyond the start of minute wave i above 2,916.50.
TECHNICAL ANALYSIS
WEEKLY CHART
Click chart to enlarge. Chart courtesy of StockCharts.com.
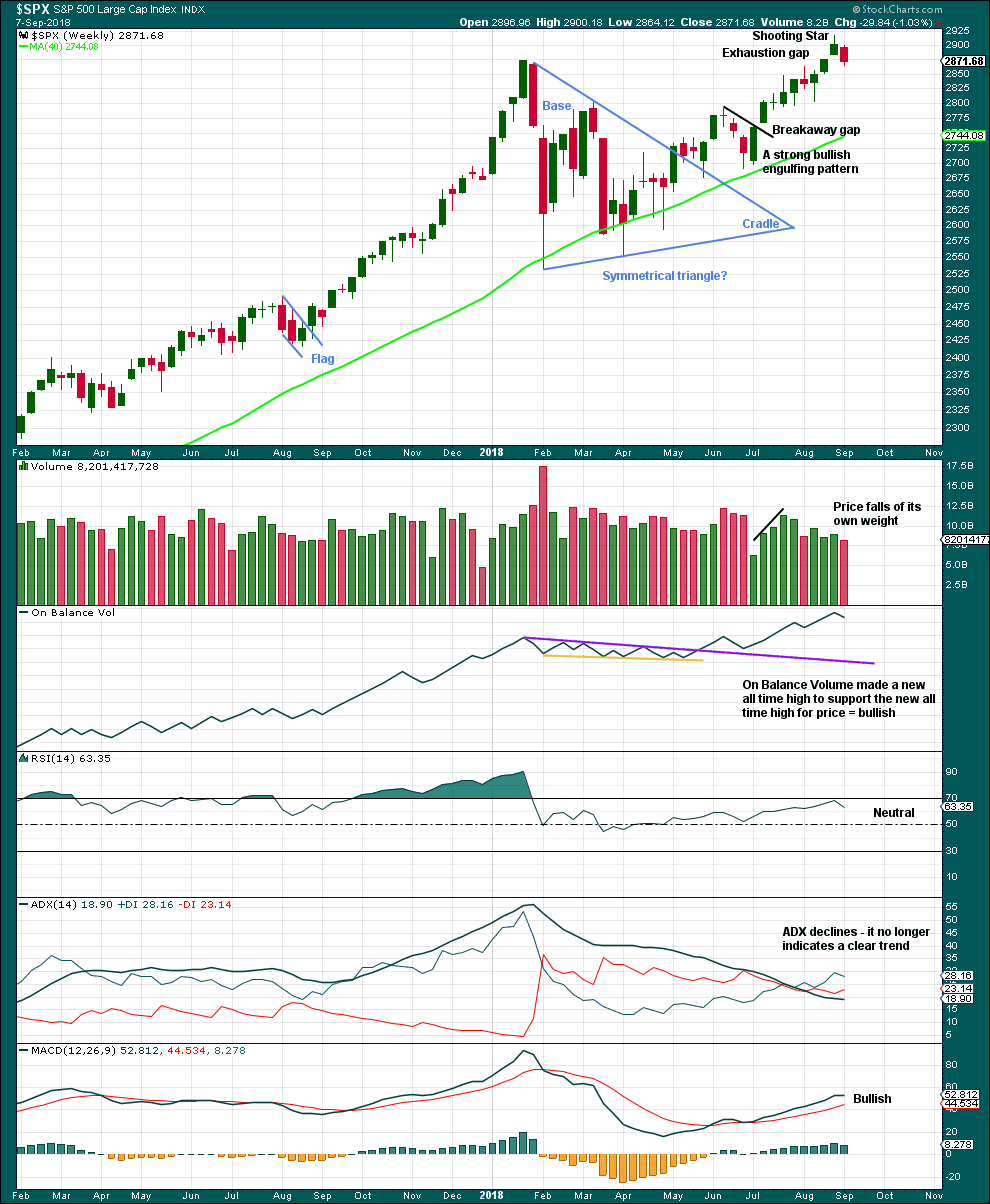
The symmetrical triangle may now be complete. The base distance is 340.18. Added to the breakout point of 2,704.54 this gives a target at 3,044.72. This is very close to the new Elliott wave target at 3,041.
The shooting star candlestick pattern now has some bearish confirmation with a downwards week which closes the last gap. The gap is now correctly named an exhaustion gap. The target at 3,044 may not be met.
However, it is also possible that the downwards week last week is a typical backtest of support after the new all time high.
DAILY CHART
Click chart to enlarge. Chart courtesy of StockCharts.com.
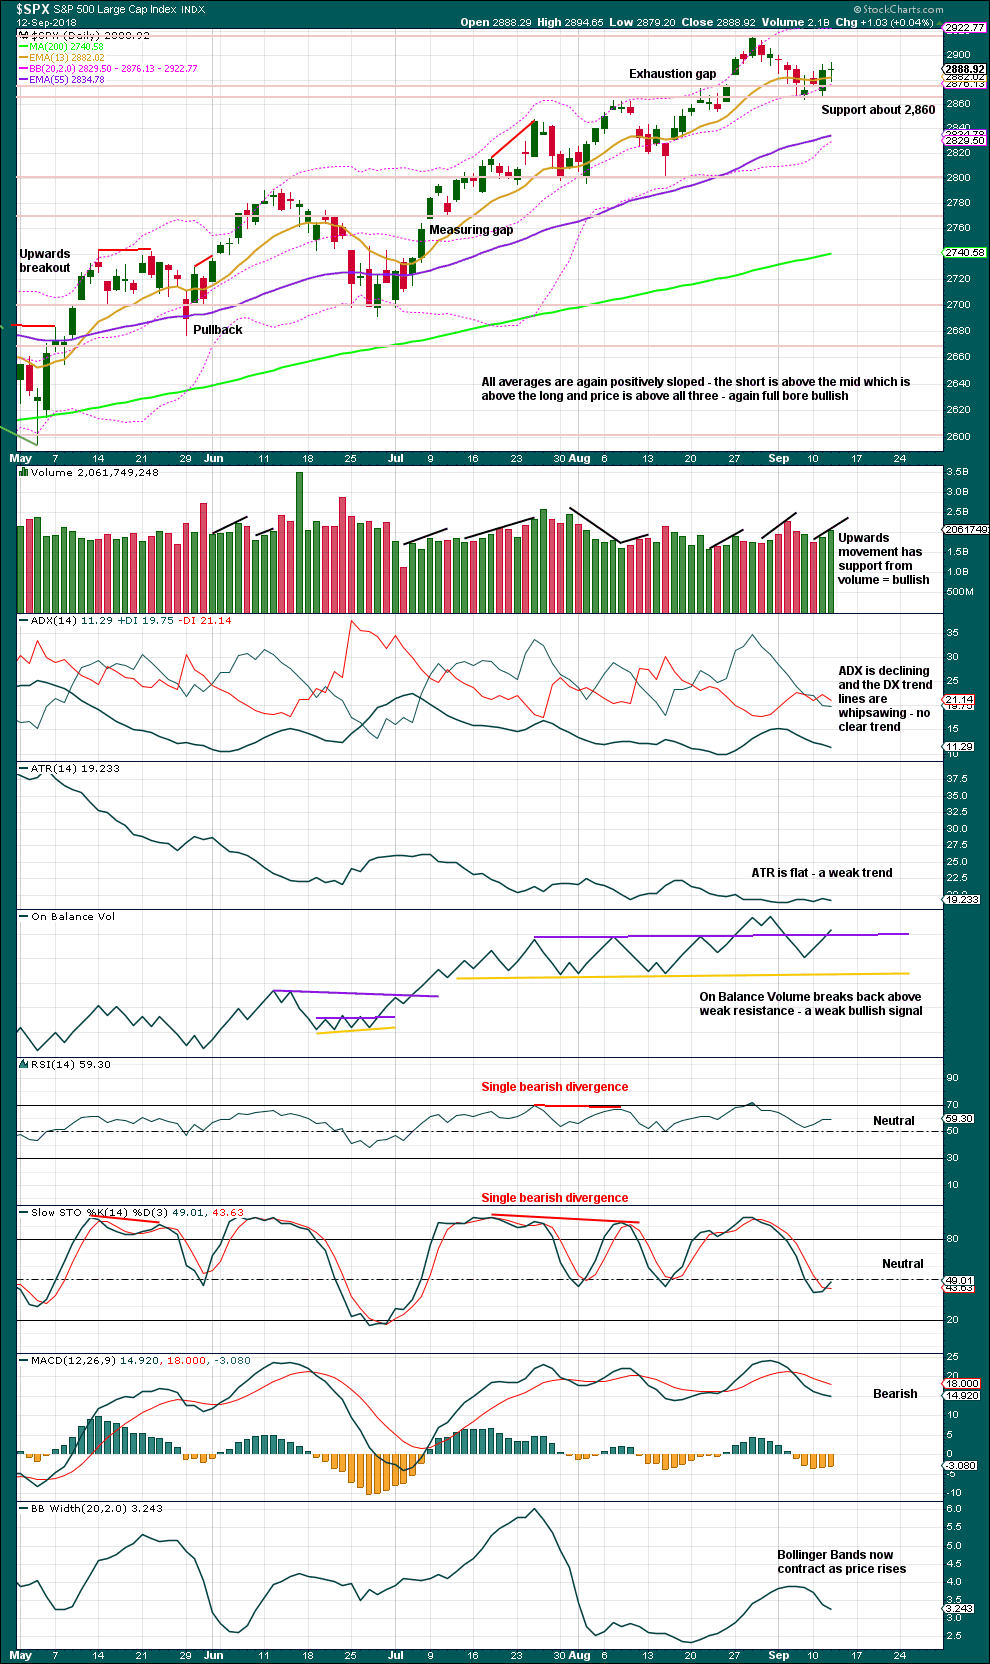
Since the low on the 2nd of April, 2018, price has made a series of higher highs and higher lows. While the last swing low at 2,802.49 has not been breached, there will still be a series of higher highs and higher lows in place; the upwards trend should be assumed to remain intact until proven otherwise. A bullish engulfing candlestick pattern with support from volume comes after another pullback. This is a strong indication that the pullback may be over. Look now for the upwards trend to resume.
Downwards movement looks corrective; this does not look like a convincing start to primary wave 4. ATR is weak and volume is now declining.
Resistance breached by On Balance Volume today is weak because the line was only tested three times and then was breached twice. Another break above it is a very weak bullish signal.
An exhaustion gap is the most bearish signal on this chart, and it is for this reason that a bearish alternate is now charted at all time frames.
Support about 2,860 is holding so far. This pullback may be only a test of support about the prior all time high.
Overall, this chart is mostly bullish.
VOLATILITY – INVERTED VIX CHART
WEEKLY CHART
Click chart to enlarge. Chart courtesy of StockCharts.com. So that colour blind members are included, bearish signals
will be noted with blue and bullish signals with yellow.
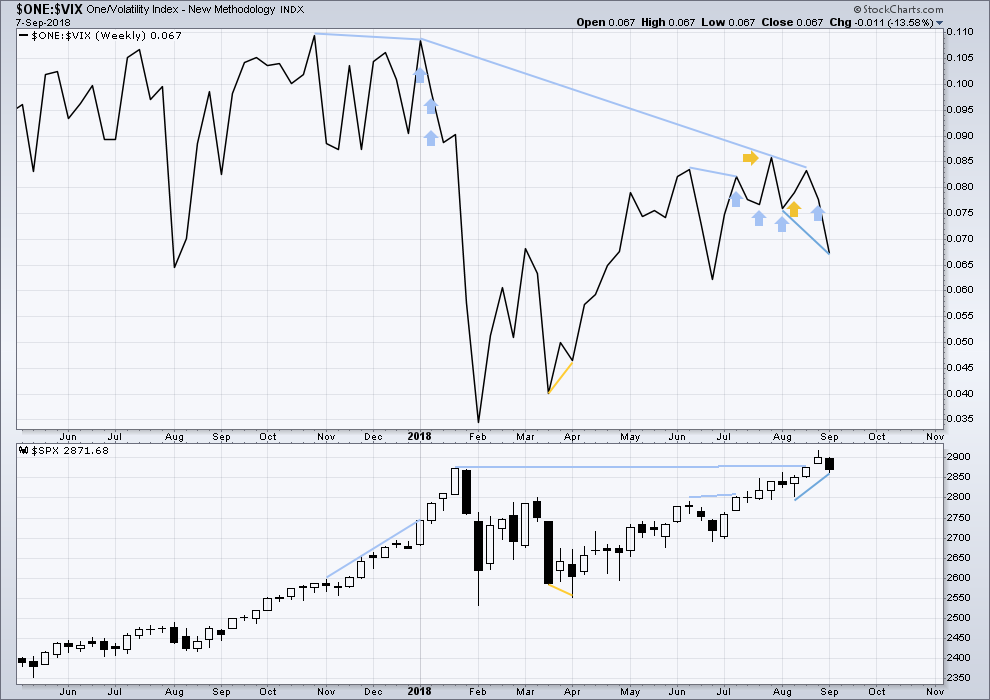
To keep an eye on the all time high for inverted VIX a weekly chart is required at this time.
Notice how inverted VIX has very strong bearish signals four weeks in a row just before the start of the last large fall in price. At the weekly chart level, this indicator may be useful again in warning of the end of primary wave 3.
At this time, there is mid term bearish divergence between price and inverted VIX: price has made a new all time high, but inverted VIX has not. This divergence may persist for some time. It may remain at the end of primary wave 3, and may develop further to the end of primary wave 5.
There is now strong bearish divergence between price and inverted VIX last week. Inverted VIX has made a strong new swing low below the low 4/5 weeks ago, but price has not. Downwards movement from price comes with a strong increase in market volatility.
There is now some reasonable warning that primary wave 3 could be over.
DAILY CHART
Click chart to enlarge. Chart courtesy of StockCharts.com. So that colour blind members are included, bearish signals
will be noted with blue and bullish signals with yellow.
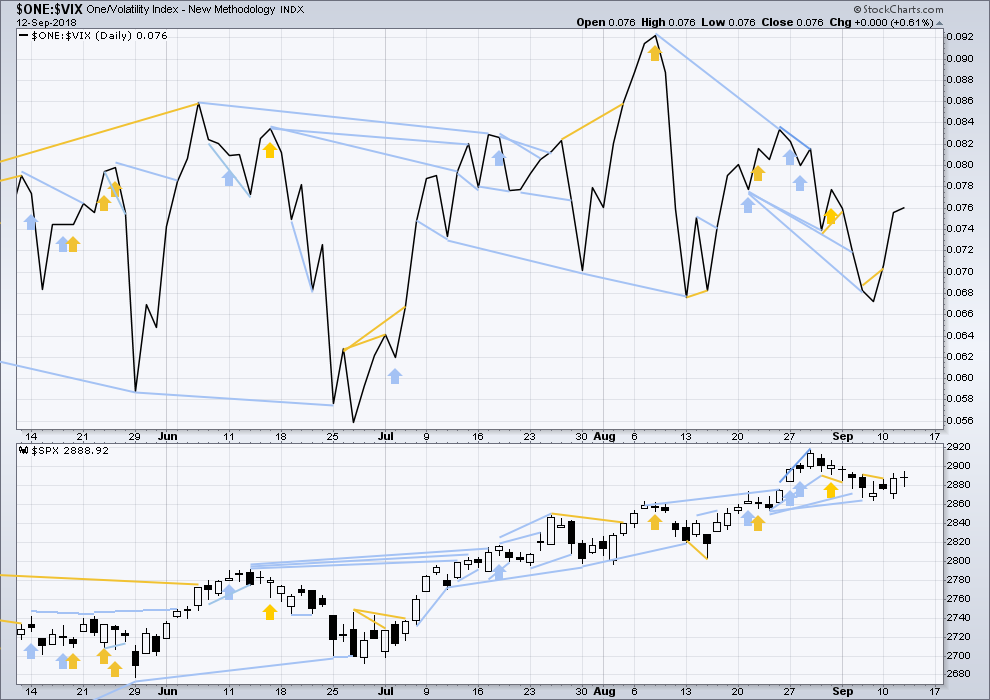
Normally, volatility should decline as price moves higher and increase as price moves lower. This means that normally inverted VIX should move in the same direction as price.
There is mid term divergence with a new all time high from price not supported by a corresponding new all time high from inverted VIX. This divergence is bearish.
The cluster of bearish signals from inverted VIX continues. Volatility is increasing faster than price is falling. This increase in volatility is bearish. This was seen just prior to intermediate wave (4).
Short term bullish divergence noted two days ago has now been followed by upwards movement. It may be resolved here. There is no new divergence today; the rise in price comes with a normal corresponding decline in market volatility.
BREADTH – AD LINE
WEEKLY CHART
Click chart to enlarge. Chart courtesy of StockCharts.com.
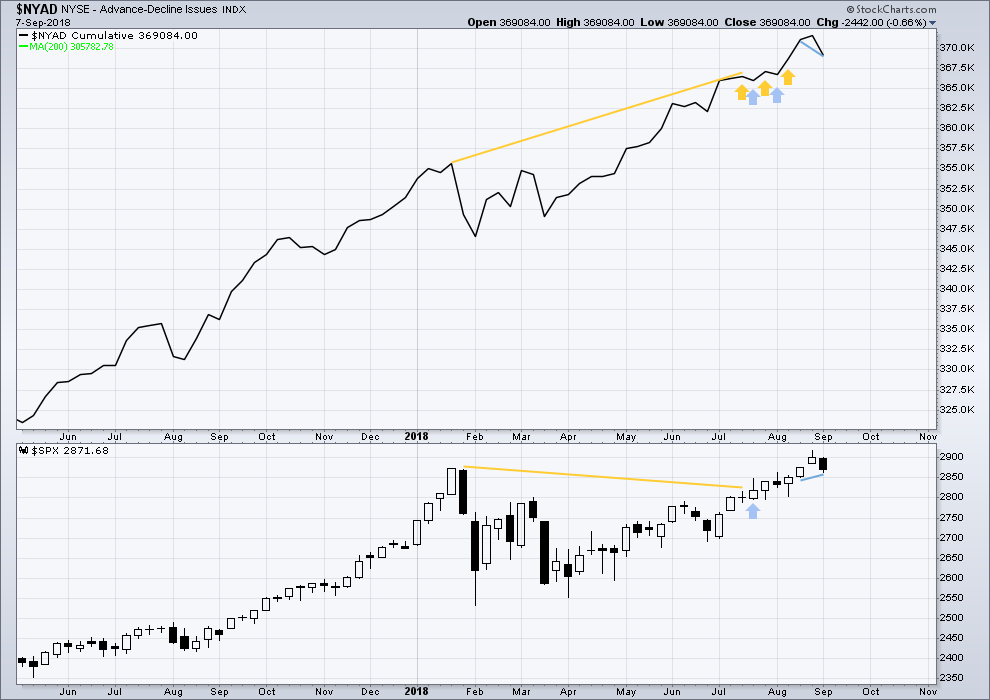
When primary wave 3 comes to an end, it may be valuable to watch the AD line at the weekly time frame as well as the daily.
There is now short term weak divergence between price and the AD line: the AD line has made a new low below the low two weeks ago, but price has not. Downwards movement last week has strong support from declining market breadth. This divergence is bearish and may be all that is seen from the AD line to indicate a start to primary wave 4.
DAILY CHART
Click chart to enlarge. Chart courtesy of StockCharts.com.
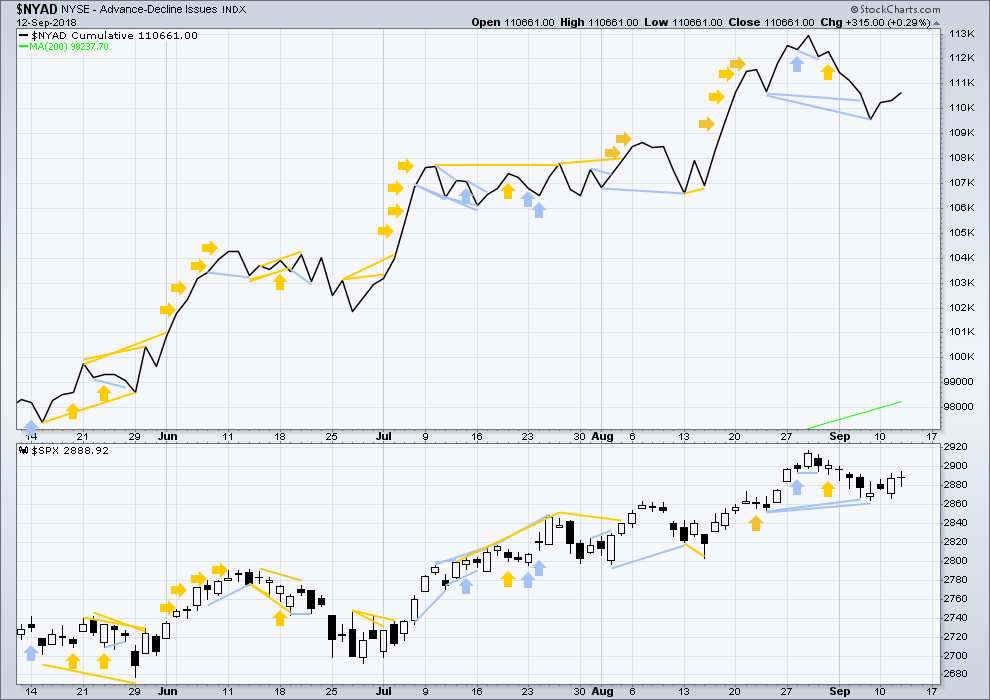
There is normally 4-6 months divergence between price and market breadth prior to a full fledged bear market. This has been so for all major bear markets within the last 90 odd years. With no longer term divergence yet at this point, any decline in price should be expected to be a pullback within an ongoing bull market and not necessarily the start of a bear market. New all time highs from the AD line means that any bear market may now be an absolute minimum of 4 months away. It may of course be a lot longer than that. My next expectation for the end of this bull market may now be October 2019.
Breadth should be read as a leading indicator.
Bearish divergence has not been followed by any downwards movement, so it may have failed. There is no new divergence today between the AD line and price. The rise in price of the last two days has support from rising market breadth.
All of small, mid and large caps made new all time highs on the 27th of August. There is a little divergence here in breadth with large caps continuing to make new all time highs on the 29th of August and small and mid caps lagging.
All of small, mid and large caps saw a fall in price last week. The fall in price has support from market breadth.
DOW THEORY
The following lows need to be exceeded for Dow Theory to confirm the end of the bull market and a change to a bear market:
DJIA: 23,360.29.
DJT: 9,806.79.
S&P500: 2,532.69.
Nasdaq: 6,630.67.
Nasdaq and DJT and now the S&P500 have all made recent new all time highs. For Dow Theory confirmation of the ongoing bull market, DJIA needs to make a new all time high.
Charts showing each prior major swing low used for Dow Theory may be seen at the end of this analysis here.
ANALYSIS OF THE END OF INTERMEDIATE WAVE (3)
TECHNICAL ANALYSIS
Click chart to enlarge. Chart courtesy of StockCharts.com.
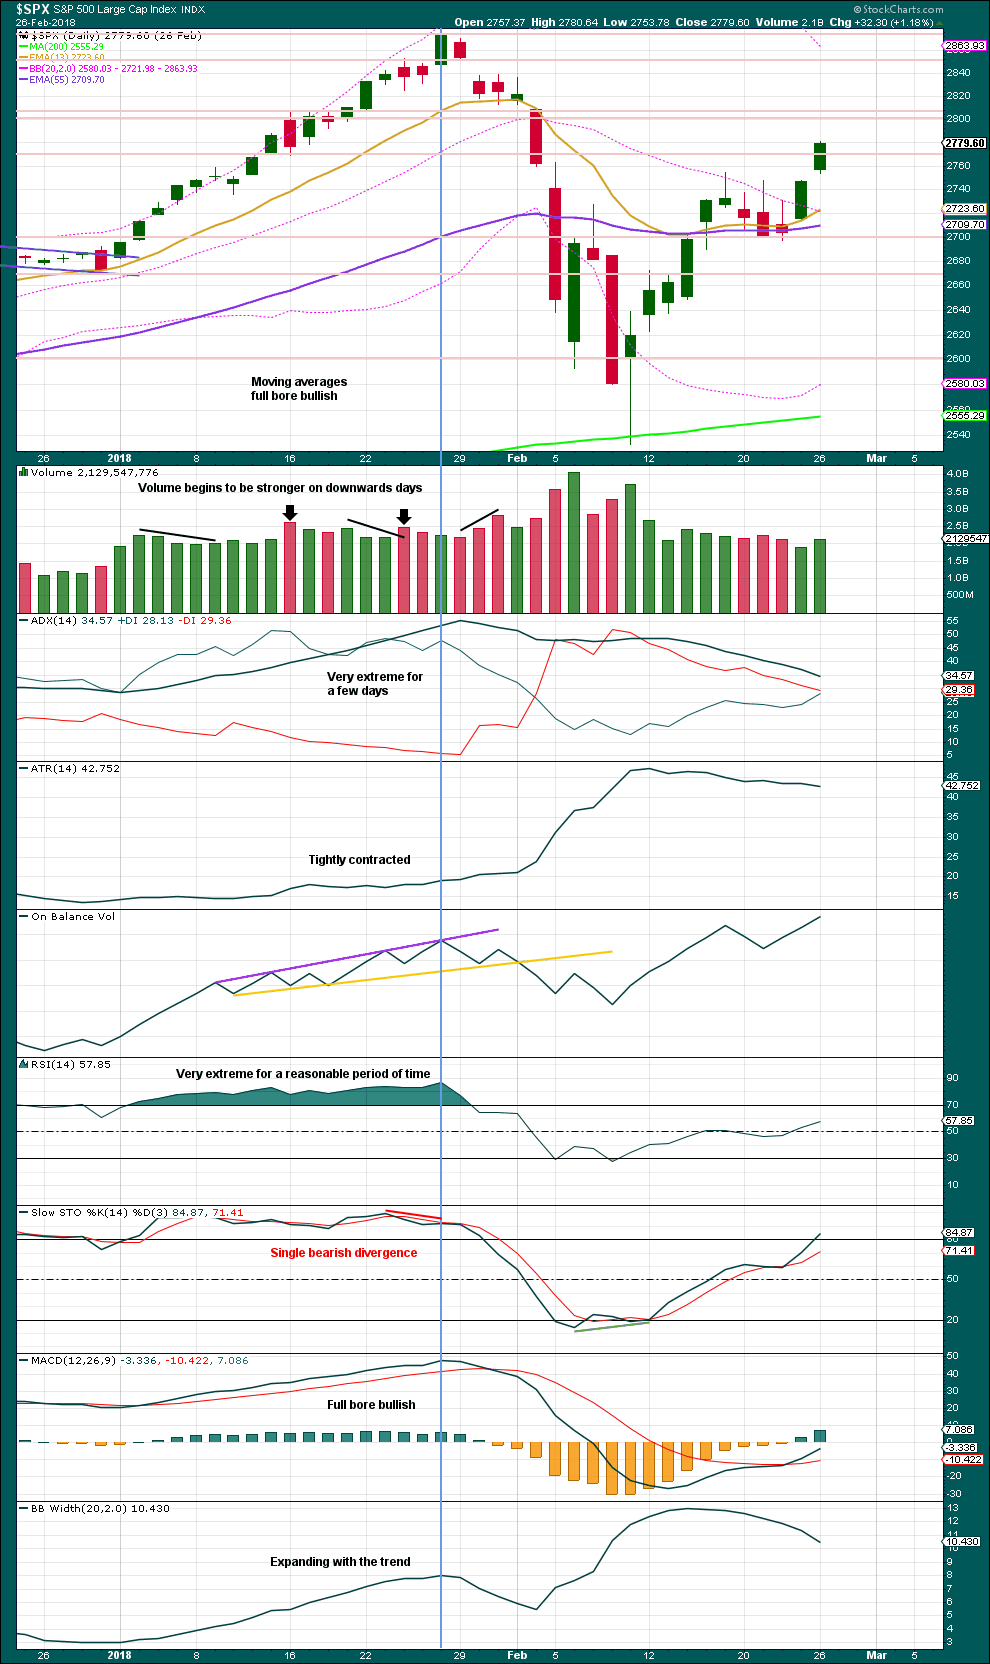
This chart looked overly bullish at the end of intermediate wave (3). The only warning in hindsight may have been from volume spiking slightly on downwards days. There was no bearish divergence between price and either of RSI or On Balance Volume.
Single bearish divergence between price and Stochastics was weak, which is often an unreliable signal.
VIX
Click chart to enlarge. Chart courtesy of StockCharts.com.
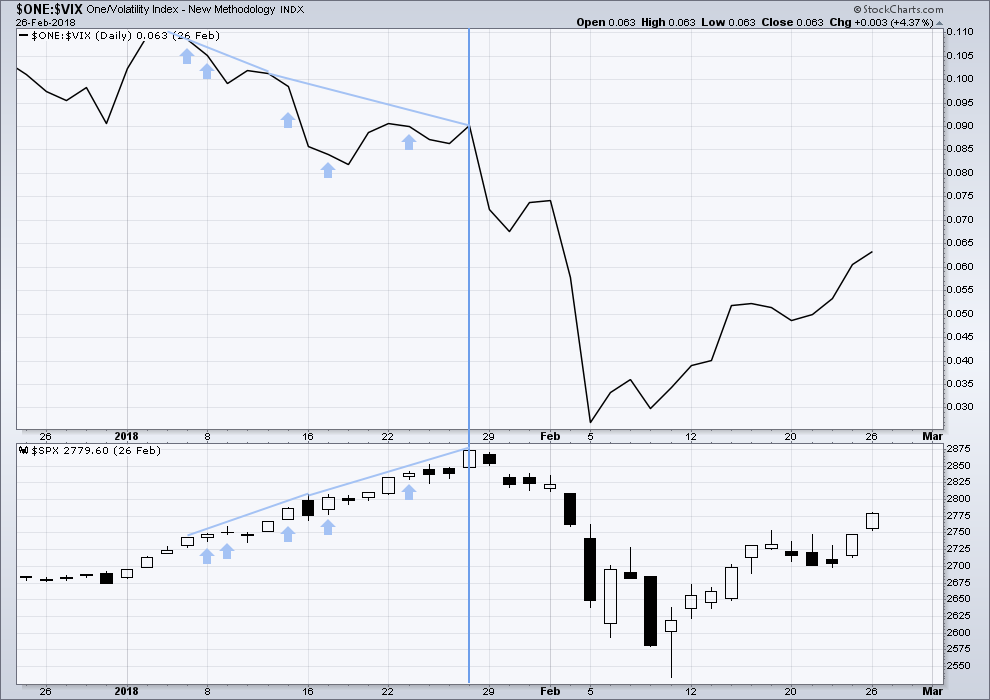
The strongest warning of an approaching intermediate degree correction at the daily chart level came from inverted VIX.
There was strong double bearish divergence at the high of intermediate wave (3), which is noted by the vertical line. There was also a sequence of five days of bearish divergence, days in which price moved higher but inverted VIX moved lower.
AD LINE
Click chart to enlarge. Chart courtesy of StockCharts.com.
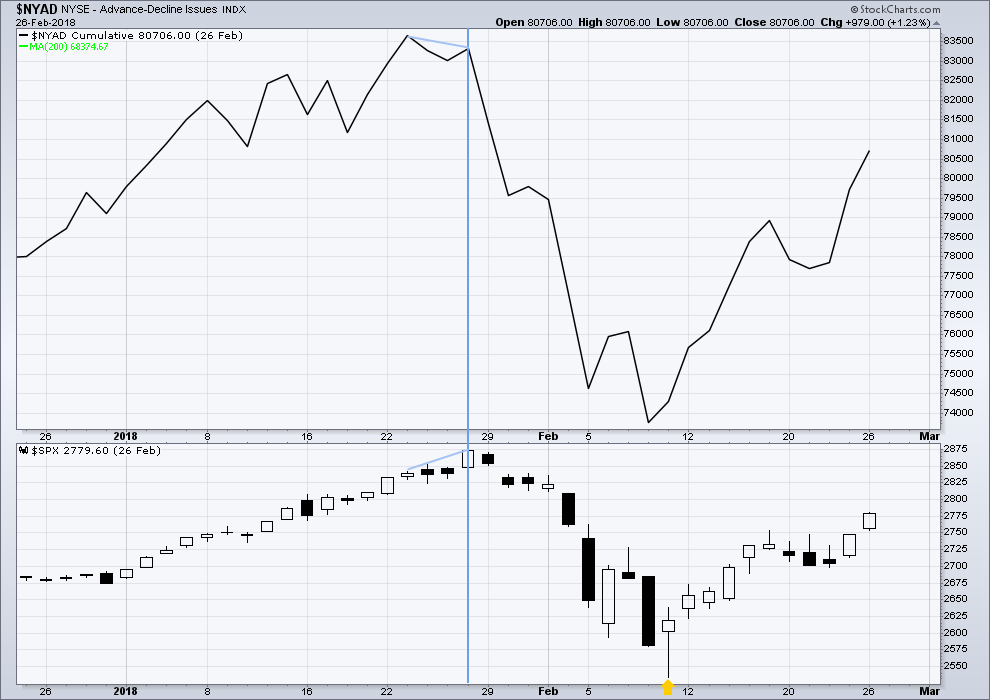
There was only single bearish divergence between price and the AD line at the end of intermediate wave (3). Approaching the high, there were no instances of price moving higher and the AD line moving lower.
Conclusion: When studying the behaviour of price and these indicators just before the start of intermediate wave (4), we may see some clues for warning us of primary wave 4. A cluster of bearish signals from VIX along with a bearish divergence from price and the AD line or On Balance Volume may warn of primary wave 4. The next instance will probably not behave the same as the last, but there may be similarities.
At this time, it does not look like primary wave 4 may begin right now, but we need to be aware of its approach.
Published @ 10:20 p.m. EST.
—
Careful risk management protects your trading account(s).
Follow my two Golden Rules:
1. Always trade with stops.
2. Risk only 1-5% of equity on any one trade.
updated hourly chart
apologies for my lateness this morning everybody
time now to draw a small channel about this upwards movement. I’m going to label a first wave incomplete for minuette (i), and so the invalidation point must remain the same.
minuette (i) looks incomplete, it may complete tomorrow.
Micro iv Triangle?
Triangle or other consolidation wise, I was just looking at that and thinking perhaps it’s micro v up time now…
SPX prices are stuck under the 78.6% (derived) fibo retracement level (2905). Meanwhile NDX similar but under its 61.8% (7580).
see, you guys don’t need me, you’ve figure it out by yourselves!
Yep. And a bullish pennant / flag on the 5 minute chart.
where’s the thrust? ……… at night?
Fibo extensions off prior swings and the overall SPX channel (daily chart). The two gray ellipses mark my best assessment at the moment of likely TOP areas in price and time. We are talking top of a primary 3…with all that implies re: follow on downside action.
Gonna be an exciting final quarter of 2018!
Looking at it again…the primary 3 top could be WHENEVER the higher channel line is tagged, and it could even be days. When that happens, I will start VERY actively getting lighter and lighter quickly, at the very least, and be on high alert for sell triggers. Of course, if there’s clear complete EW structure up to such a tag, that will be awesomely confirming.
This morning SPX looks like a bullish and impulsive 3rd wave to me. The question is this, if and when SPX breaks 2917, will we see confirmation from volume, on-balance volume, and AD line breath.
Right now the McClellan oscillator has risen from a -40 to zero. If it can close above zero today, that would be very supportive to the bullish scenario.
Guten Morgen.
We now have seven consecutive Hindenburg Omens in a row, which is historically unprecedented. What is even more astonishing, is that VIX this morning trades at 12.87, a risk perception profile completely at odds with 7 straight days of more stocks hitting new 52 week lows than highs. Be careful out there…..
FUBAR on all accounts, dystopian central planners be dammed. Not that I’m a huge value investor, but we’ve never had this wide of a standard deviation between price and fundamentals, and if you back out stock buybacks, it’s more than ludicrous. Back all in long VOL!!!
I would like to jump on VIX too. I’m waiting for something that models out as the completion of the intermediate 5 we’ve been tracking for many months, and right now my best estimate is mid-October. I’d expect VIX to be 11.5 or lower by then. That’s when I’ll back up my truck. A primary 4 down should take VIX into the stratosphere. Looking forward to the set up, it should be epic.
Indeed, it will be epic. I and other Vol traders are so conditioned to take quick gains, I hope I can hold on like FEB.
Also; in all honesty with this level and magnitude of manipulation and price fixing, I don’t know how a much deeper correction does not develop if something like P4 down kicks off. They either stop, or they don’t and something would have to really spook them to stop.