Price moved lower for Friday exactly as the main short term Elliott wave count expected.
The week closes with a Shooting Star candlestick pattern.
Summary: Shooting Star candlesticks indicate this pullback is not complete. The Elliott wave count expects it to end below 2,796.34 but not below 2,791.47.
The bigger picture remains extremely bullish.
The mid to longer term target is at 2,922 (Elliott wave) or 3,045 (classic analysis). Another multi week to multi month correction is expected at one of these targets.
The final target for this bull market to end remains at 3,616.
Always practice good risk management. Always trade with stops and invest only 1-5% of equity on any one trade.
New updates to this analysis are in bold.
The biggest picture, Grand Super Cycle analysis, is here.
Last historic analysis with monthly charts is here, video is here.
ELLIOTT WAVE COUNT
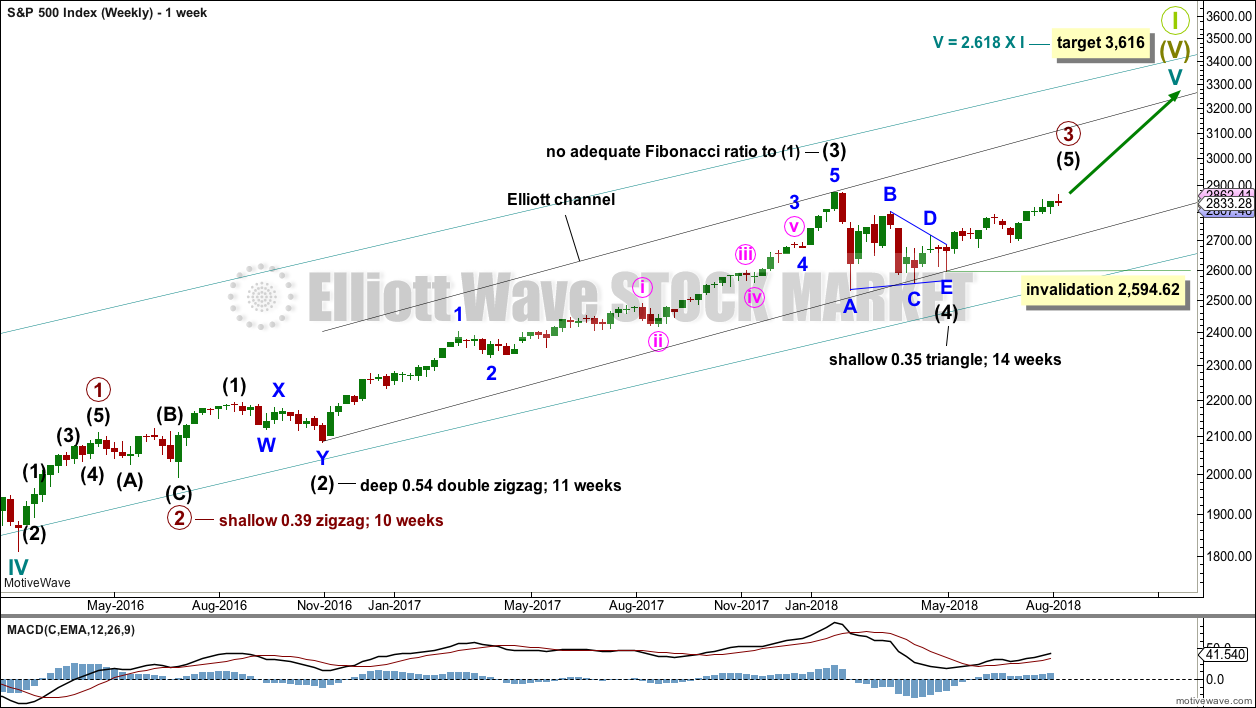
WEEKLY CHART
Cycle wave V must complete as a five structure, which should look clear at the weekly chart level and also now at the monthly chart level. It may only be an impulse or ending diagonal. At this stage, it is clear it is an impulse.
Within cycle wave V, the third waves at all degrees may only subdivide as impulses.
Intermediate wave (4) has breached an Elliott channel drawn using Elliott’s first technique. The channel is redrawn using Elliott’s second technique: the first trend line from the ends of intermediate waves (2) to (4), then a parallel copy on the end of intermediate wave (3). Intermediate wave (5) may end either midway within the channel, or about the upper edge.
Intermediate wave (4) may now be a complete regular contracting triangle lasting fourteen weeks, one longer than a Fibonacci thirteen. There is perfect alternation and excellent proportion between intermediate waves (2) and (4).
Within intermediate wave (5), no second wave correction may move beyond the start of its first wave below 2,594.62. However, the lower edge of the black Elliott channel drawn across the ends of intermediate degree waves should provide very strong support for any deeper pullbacks, holding price well above the invalidation point while intermediate wave (5) unfolds.
At this stage, the expectation is for the final target to me met in October 2019.
A multi week to multi month consolidation for primary wave 4 is expected on the way up to the final target.
The last bullish fifth wave of minor wave 5 to end intermediate wave (3) exhibited commodity like behaviour. It was strong and sustained. It is possible that the upcoming wave of minor wave 5 to end intermediate wave (5) to end primary wave 3 may exhibit similar behaviour, so we should be on the lookout for this possibility.
DAILY CHART
Intermediate wave (5) would be very likely to make at least a slight new high above the end of intermediate wave (3) at 2,872.87 to avoid a truncation.
Intermediate wave (3) exhibits no Fibonacci ratio to intermediate wave (1). It is more likely then that intermediate wave (5) may exhibit a Fibonacci ratio to either of intermediate waves (1) or (3). The most common Fibonacci ratio would be equality in length with intermediate wave (1), but in this instance that would expect a truncation. The next common Fibonacci ratio is used to calculate a target for intermediate wave (5) to end.
Intermediate wave (5) is unfolding as an impulse, and within it minor waves 1 and 2 are complete.
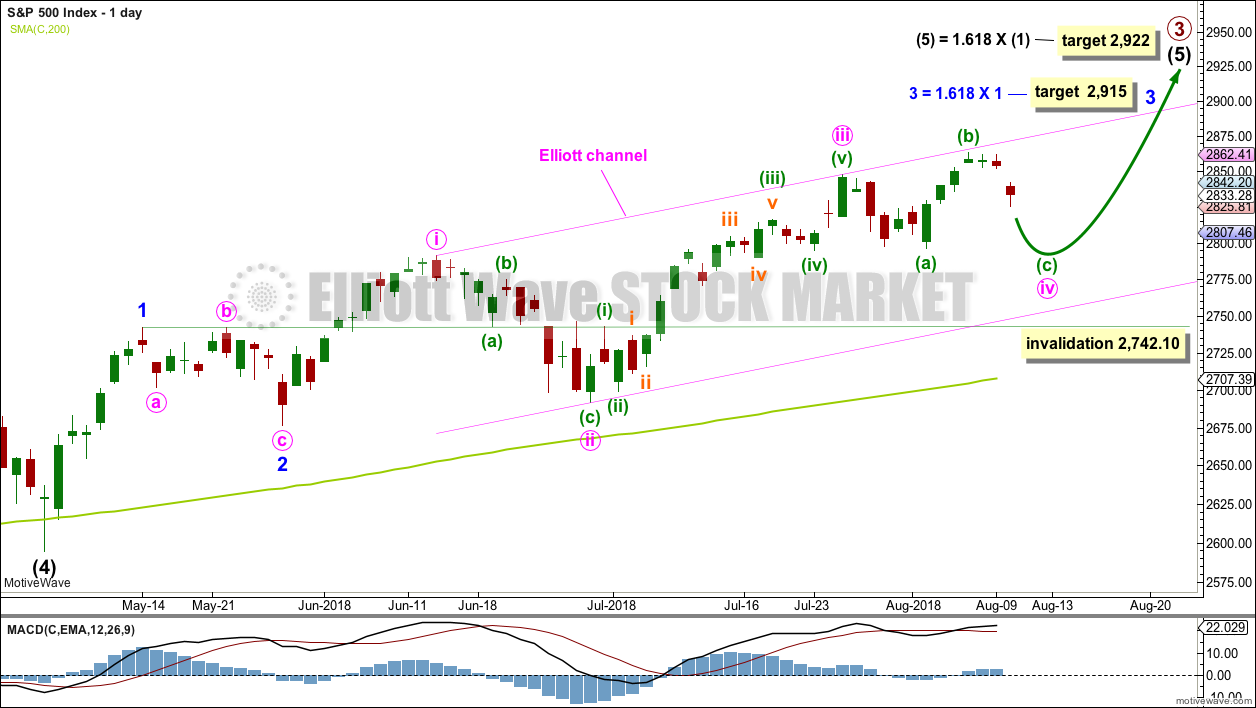
Minor wave 3 may only subdivide as an impulse. A target is calculated for minor wave 3 to end, which expects to see the most common Fibonacci ratio to minor wave 1. Minor wave 3 may last several weeks in total and should look like an impulse at the daily chart level. When it is complete, then minor wave 4 may last about one to two weeks in order for it to exhibit reasonable proportion to minor wave 2. Minor wave 4 must remain above minor wave 1 price territory above 2,742.10.
Within minor wave 3, minute waves i, ii and iii all look complete and minute wave iv may still be an incomplete expanded flat correction. If minute wave iv were to continue further, then it would have better proportion to minute wave ii and would exhibit alternation in structure. This idea also has support at the end of this week from classic technical analysis.
It is also possible that minute wave iv was over at the last low and minor wave 3 was over at the last high. A new low below 2,791.47 could not be a continuation of minute wave iv, so the correction at that stage would be labelled minor wave 4.
The channel is drawn using Elliott’s first technique. The upper edge has provided resistance. This channel is copied over to hourly charts.
MAIN HOURLY CHART
This remains the main wave count today.
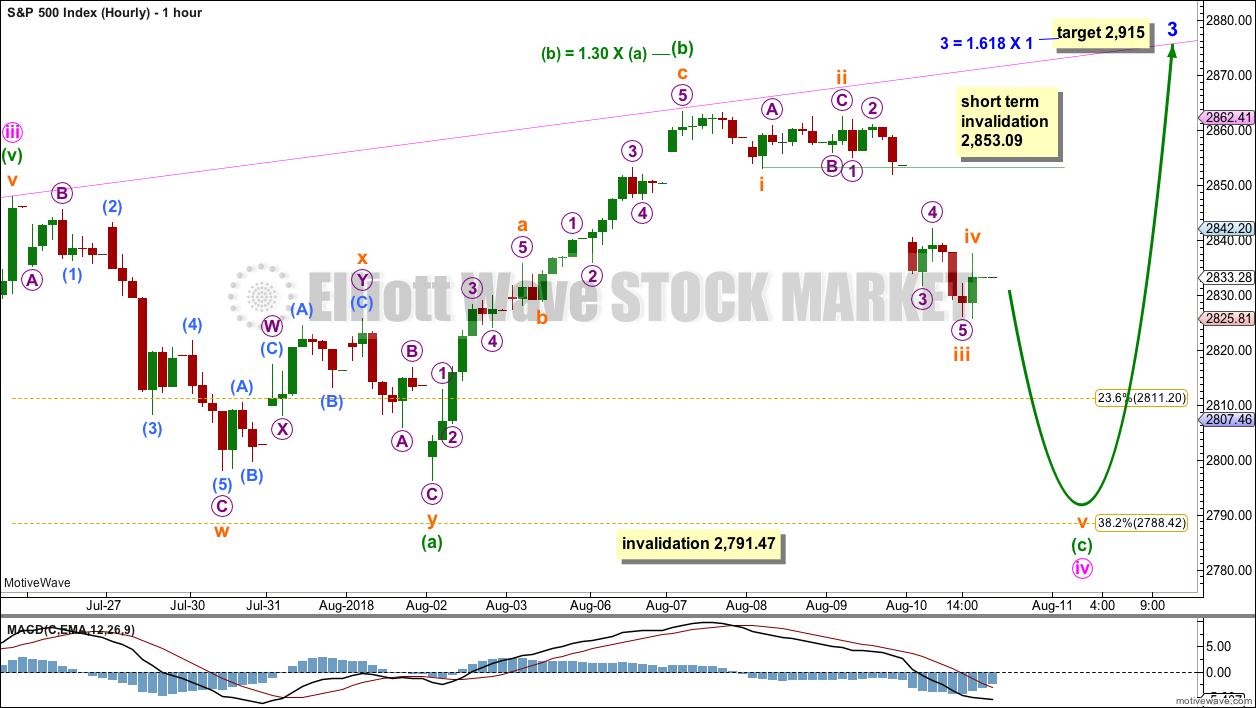
It remains possible that minute wave iv is an incomplete expanded flat correction.
Within the expanded flat, minuette waves (a) and (b) both subdivide as threes. Minuette wave (b) is still within the most common range for B waves within flat corrections, between 1 and 1.38 times the length of wave A.
Minuette wave (c) may be a steep sharp pullback. It would be very likely to make a new low at least slightly below the end of minuette wave (a) at 2,796.34 to avoid a truncation and a very rare running flat.
It is also possible to see minuette wave (a) over earlier as a single zigzag at the low labelled subminuette wave w. If this idea is correct, then minuette wave (c) only needs to make a slight new low below 2,798.11 to avoid a truncation.
Minuette wave (c) must subdivide as a five wave impulse.
The downwards wave labelled subminuette wave i may be seen as a complete five wave impulse on the five minute chart.
Within the impulse of minuette wave (c), the small correction for subminuette wave iv may not move into subminuette wave i price territory above 2,853.09.
Minute wave iv may not move into minute wave i price territory below 2,791.47.
For this main hourly wave count, the upwards wave labelled minuette wave (b) is seen as a zigzag; this labelling has the best fit.
For the two hourly alternates below, the structure (labelled minuette wave (b) on this main hourly chart) is labelled as an impulse; this labelling does not have as good a fit.
ALTERNATE HOURLY CHART
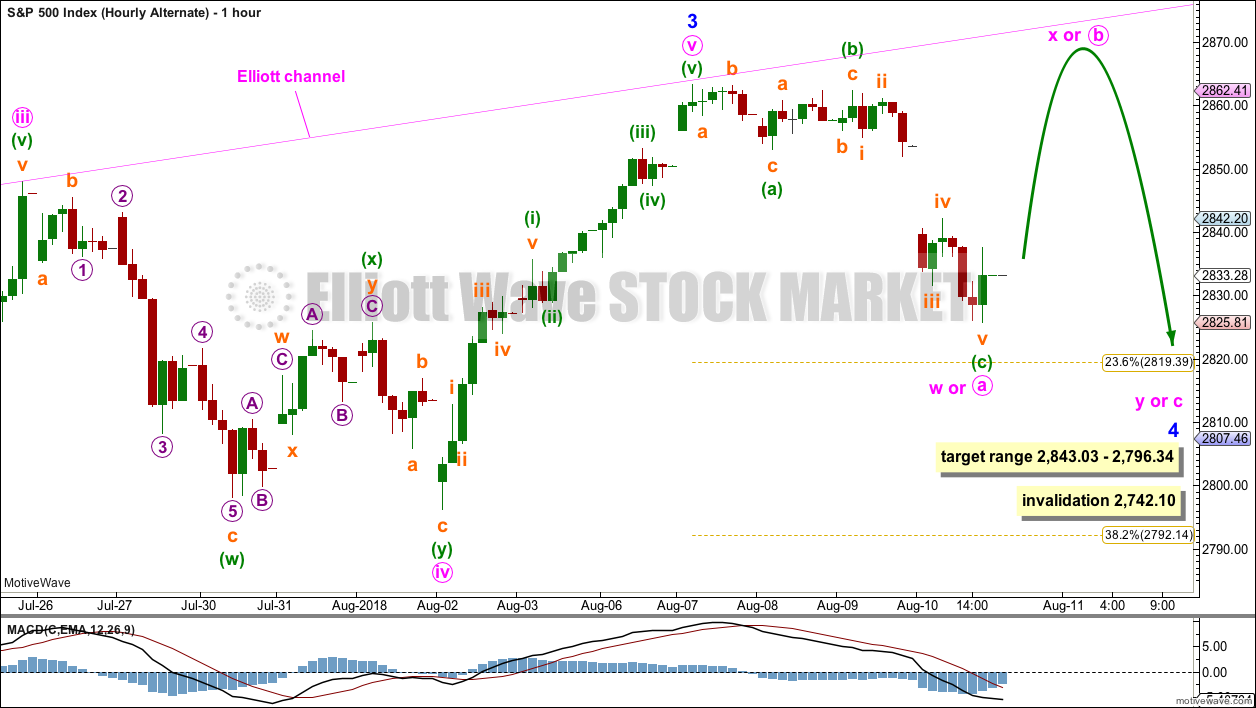
Here, the degree of labelling within minute wave iv is simply moved up one degree.
It is possible that minute wave iv could be over more quickly than was expected. If minute wave iv is over, then the possibility of an earlier than expected end to minute wave v must be considered.
Minor wave 3 may have been over at the last high. Minute wave v is seen as a five wave impulse in order for this wave count to work. This does not have as good a fit as the main wave count, which does see this wave as a zigzag.
Minor wave 4 would most likely be a flat, combination or triangle. These are all sideways types of corrections. It may have begun with a zigzag, which may now be complete for minute wave a. If minute wave a is a three wave structure, then minute wave b may make a new high above the start of minute wave a at 2,863.43 as in an expanded flat or running triangle.
Minor wave 4 may be reasonably expected to last at least about two weeks, and possibly up to about four weeks. It would most likely end somewhere within the fourth wave of one lesser degree; minute wave iv has its range from 2,843.03 to 2,796.34.
SECOND ALTERNATE HOURLY CHART
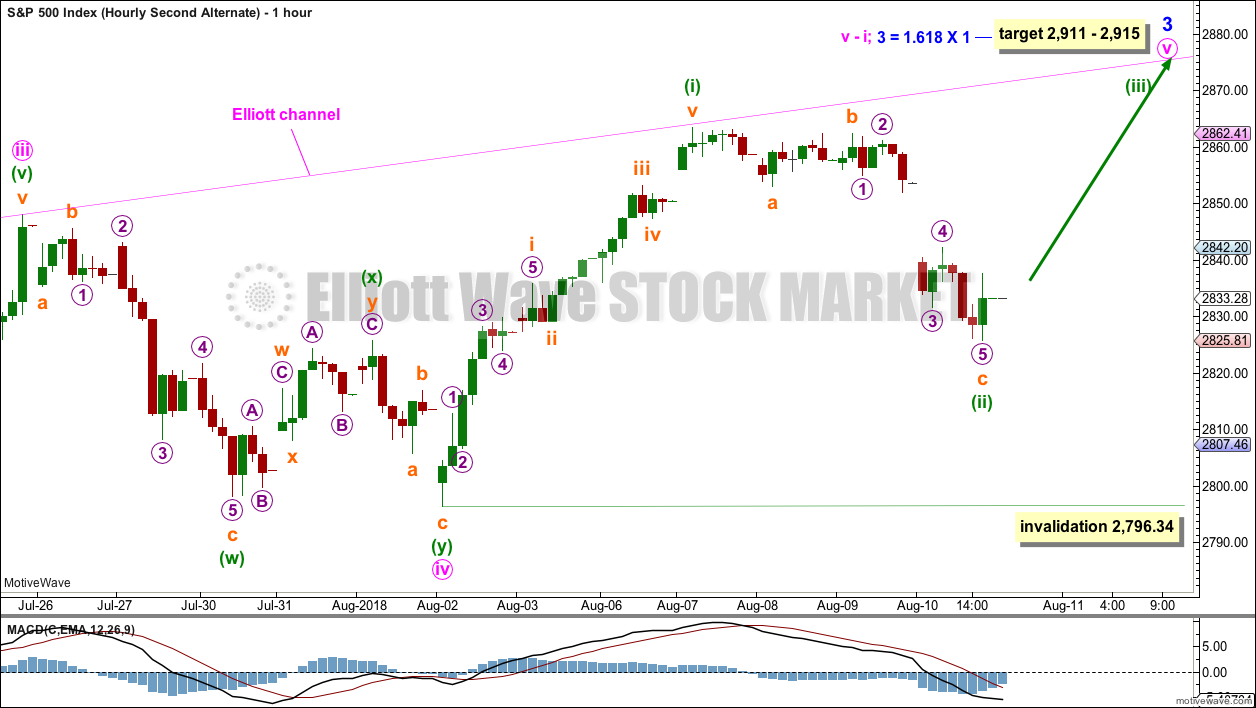
This second alternate wave count moves the degree of labelling within the last upwards wave down one degree. Minute wave v may be incomplete, and only minuette wave (i) within it may be complete.
Minuette wave (ii) is labelled as a complete zigzag. It may be over here, or it may move a little lower as a double zigzag..
This wave count now expects an increase in upwards momentum as minuette wave (iii) moves higher.
If minuette wave (ii) continues any further, it may not move beyond the start of minuette wave (i) below 2,796.34.
TECHNICAL ANALYSIS
WEEKLY CHART
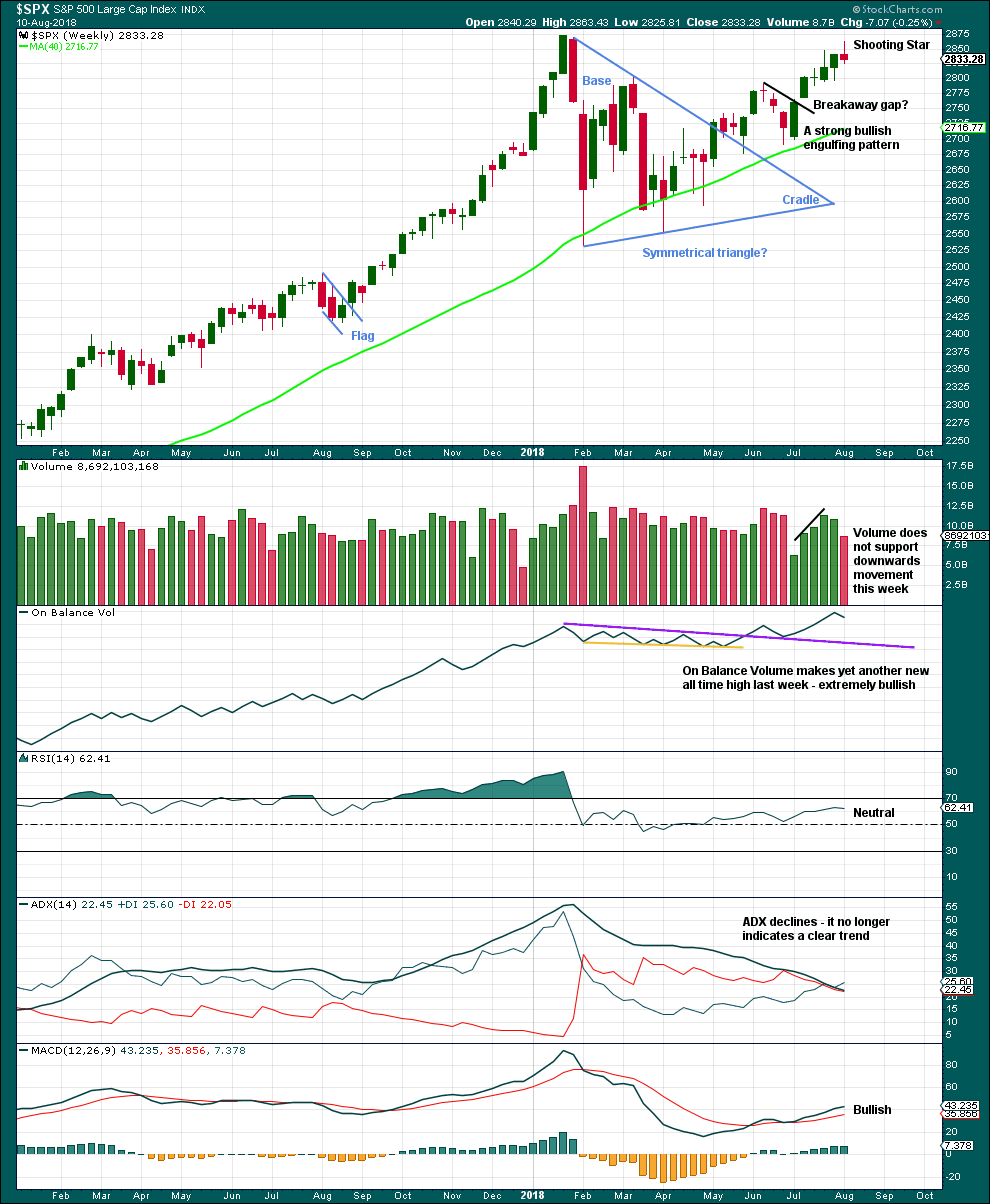
Click chart to enlarge. Chart courtesy of StockCharts.com.
Another new high for On Balance Volume last week remains very bullish indeed, but that does not preclude another small pullback within this developing upwards trend. It is still expected that price is very likely to make new all time highs, but it will not move in a straight line.
This week’s candlestick is a Shooting Star pattern. This is a bearish reversal pattern when it comes after an upwards trend. Look for a downwards week next week.
DAILY CHART
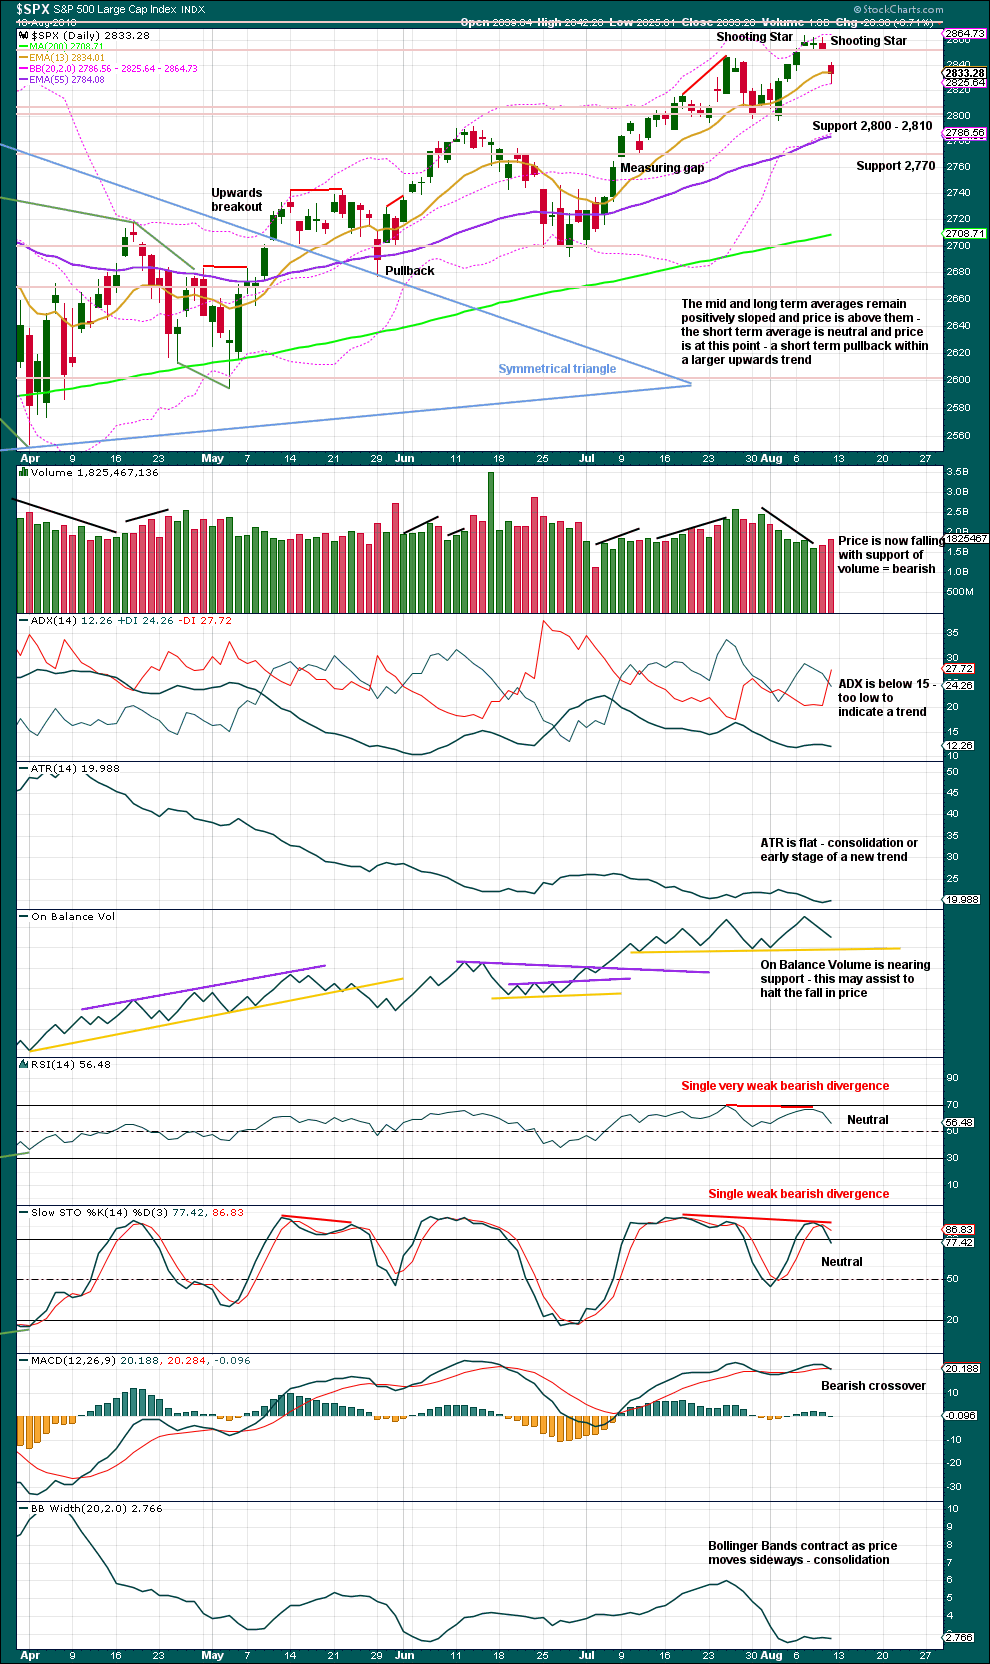
Click chart to enlarge. Chart courtesy of StockCharts.com.
The symmetrical triangle may now be complete. The base distance is 340.18. Added to the breakout point of 2,704.54 this gives a target at 3,044.72. This is above the Elliott wave target at 2,922, so the Elliott wave target may be inadequate.
Since the low on the 2nd of April, 2018, price has made a series of higher highs and higher lows. This is the definition of an upwards trend. But trends do not move in perfectly straight lines; there are pullbacks and bounces along the way.
There are now two Shooting Star candlesticks at or about the last high. This is now a stronger bearish warning. There are three recent examples of Shooting Stars on this chart: on 31st of July, 26th of July, and 11th of June. The second two examples came after an upwards trend and were considered bearish reversal candlesticks. Both were closely accompanied by new all time highs from On Balance Volume and some bearish divergence with price and Stochastics. Both were quickly followed by reasonable pullbacks. This is almost exactly the same situation now, and it now looks like it is happening again here. It is for this reason primarily that the main Elliott wave count expects to see a reasonable pullback continue next week.
The bigger picture remains extremely bullish with another new all time high from On Balance Volume as recently as the 7th of August.
There is strong support for price about 2,800, and support for On Balance Volume is close by. These two supports together may prevent a pullback here from being very deep.
VOLATILITY – INVERTED VIX CHART
WEEKLY CHART
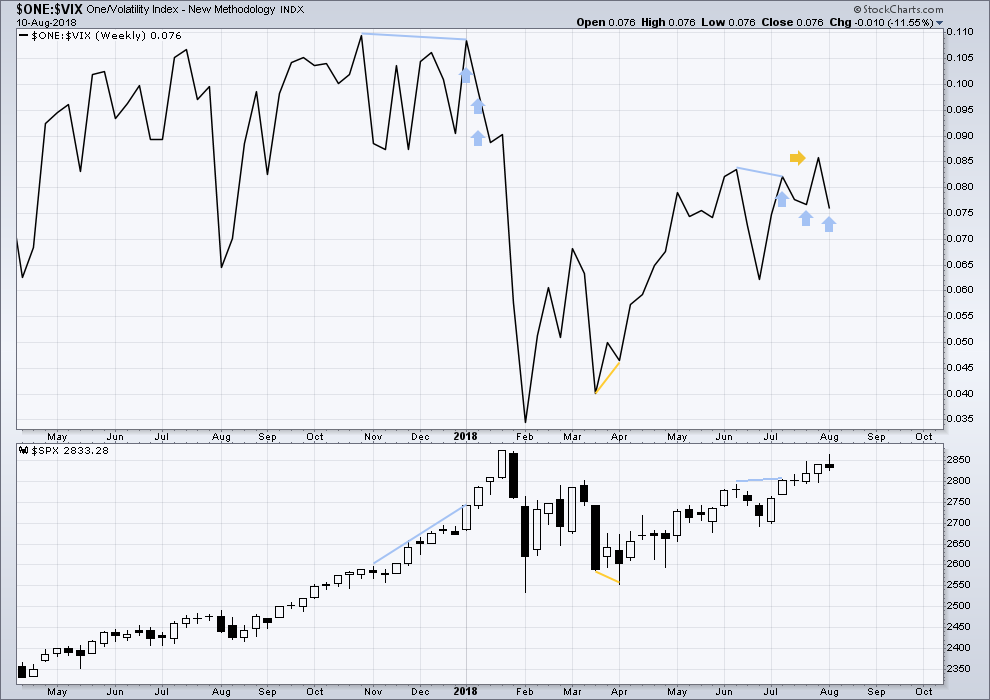
Click chart to enlarge. Chart courtesy of StockCharts.com. So that colour blind members are included, bearish signals
will be noted with blue and bullish signals with yellow.
To keep an eye on the all time high for inverted VIX a weekly chart is required at this time.
Notice how inverted VIX has very strong bearish signals four weeks in a row just before the start of the last large fall in price. At the weekly chart level, this indicator may be useful again in warning of the end of primary wave 3.
This week completes an upwards week with a higher high and a higher low.
While price moved higher, inverted VIX moved lower. Downwards movement during this week does not have support from increasing market volatility. This divergence is bearish.
Inverted VIX is still some way off from making a new all time high.
DAILY CHART
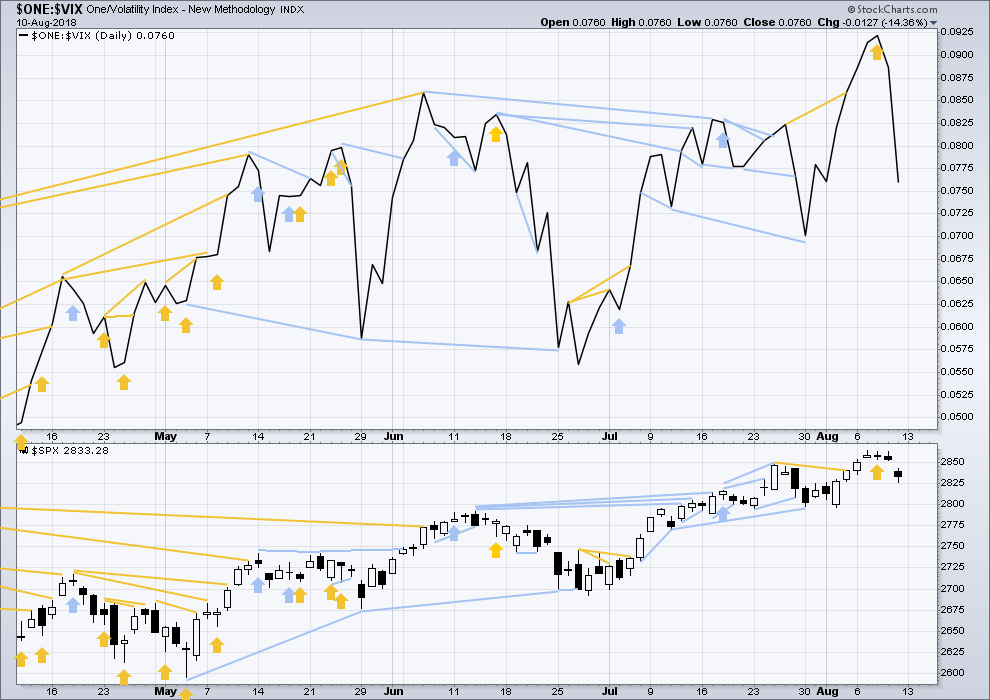
Click chart to enlarge. Chart courtesy of StockCharts.com. So that colour blind members are included, bearish signals
will be noted with blue and bullish signals with yellow.
Normally, volatility should decline as price moves higher and increase as price moves lower. This means that normally inverted VIX should move in the same direction as price.
Last noted mid term bearish divergence has not been followed yet by more downwards movement. It may still indicate downwards movement ahead as there is now a cluster of bearish signals from inverted VIX.
Both price and inverted VIX moved lower on Friday, but inverted VIX has moved more strongly lower than price. While there is no clear divergence at lows, this is reasonably bearish for the short term.
BREADTH – AD LINE
WEEKLY CHART
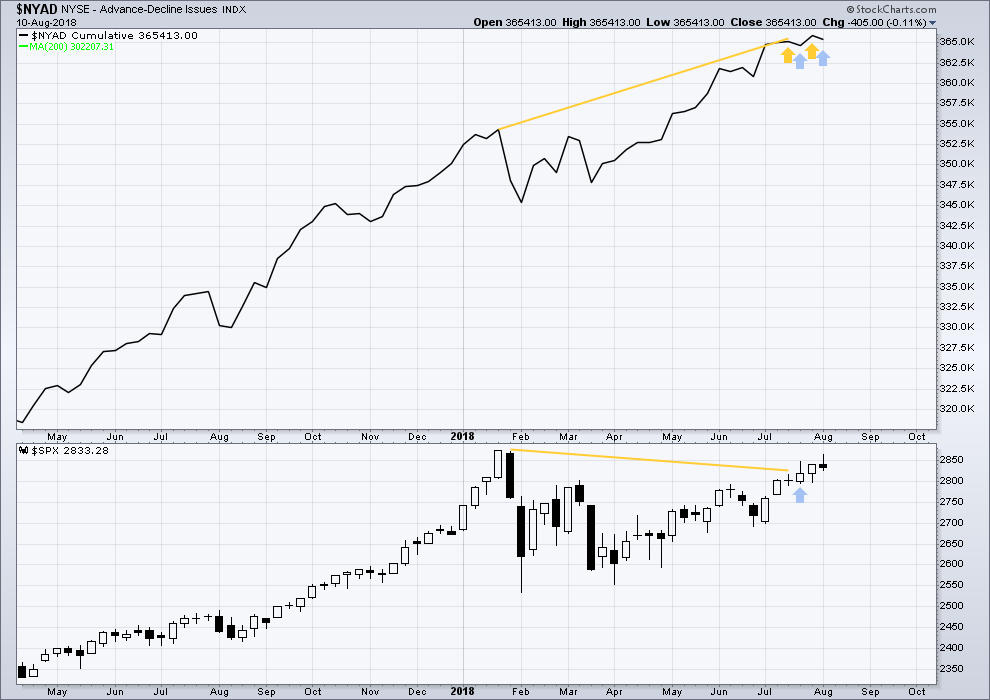
Click chart to enlarge. Chart courtesy of StockCharts.com.
When primary wave 3 comes to an end, it may be valuable to watch the AD line at the weekly time frame as well as the daily.
At this stage, there is very strong bullish divergence between price and the AD line at the weekly time frame. With the AD line making new all time highs, expect price to follow through with new all time highs in coming weeks.
Price this week has moved higher, but the AD line has moved lower.
Upwards movement within this last week does not have support from rising market breadth. This divergence is bearish for the short term.
DAILY CHART
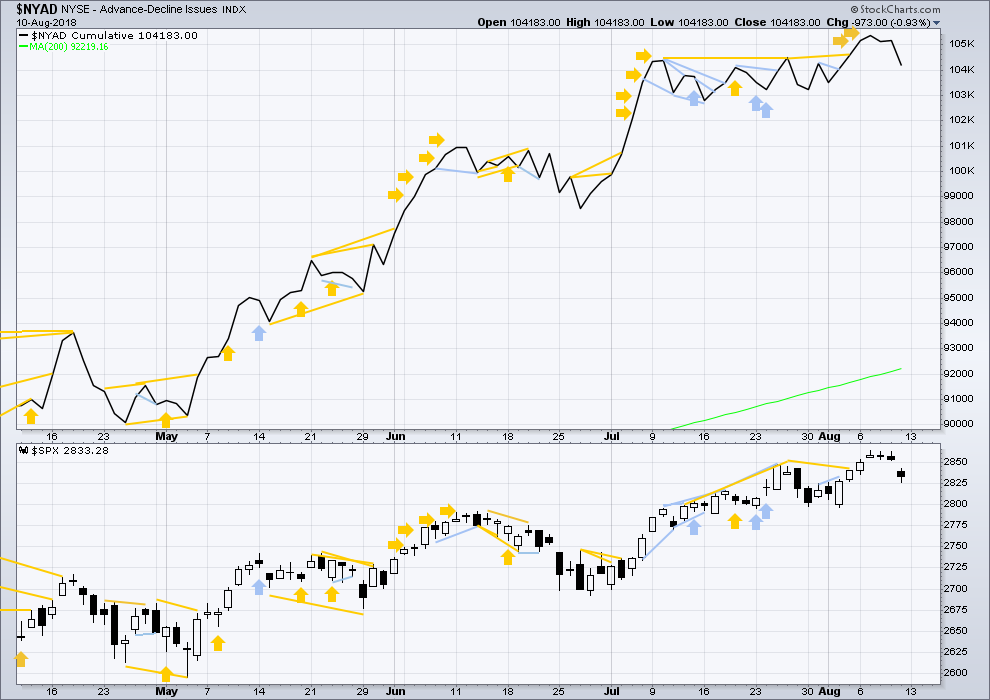
Click chart to enlarge. Chart courtesy of StockCharts.com.
There is normally 4-6 months divergence between price and market breadth prior to a full fledged bear market. This has been so for all major bear markets within the last 90 odd years. With no longer term divergence yet at this point, any decline in price should be expected to be a pullback within an ongoing bull market and not necessarily the start of a bear market. New all time highs from the AD line means that any bear market may now be an absolute minimum of 4 months away. It may of course be a lot longer than that. My next expectation for the end of this bull market may now be October 2019.
Breadth should be read as a leading indicator.
At the end of the week, both price and the AD line have moved lower. There is no divergence. Downwards movement for Friday had support from declining market breadth, which is bearish.
Small caps and mid caps have both made new all time highs. Only large caps have to follow through; they do usually lag in the latter stages of a bull market.
Mid caps have a Gravestone doji at the high and a Shooting Star reversal pattern just below the high. This looks bearish for the short term.
Small caps have another slight new high, but now there are is also a Gravestone doji and a Shooting Star about this high. This looks bearish for the short term.
DOW THEORY
The following lows need to be exceeded for Dow Theory to confirm the end of the bull market and a change to a bear market:
DJIA: 23,360.29.
DJT: 9,806.79.
S&P500: 2,532.69.
Nasdaq: 6,630.67.
Only Nasdaq at this stage is making new all time highs, with another new all time high on the 25th of July. DJIA and DJT need to make new all time highs for the ongoing bull market to be confirmed.
Charts showing each prior major swing low used for Dow Theory may be seen at the end of this analysis here.
Published @ 08:57 p.m. EST on 11th August, 2018.

We are seeing some very interesting correlations between volatility price action in January and the current market. You all heard me pounding the table at the recent lows but if what we think we are seeing is correct, truly explosive moves could still be ahead. Take a look at the very sharp positive momentum divergences in VXX at its recent lows. I have already booked some spectacular gains but we may not be quite done. There needs to be some confirmation for the analogy the next 24 hours. If I see it, I will post it.
Kevin and Joseph:
I have deleted the last two comments. I want to remain neutral here so I deleted both.
I do not want at any time in this comments section for any comments to make claims about fake news without reasonable substantiation.
If anyone here makes a claim regarding the validity of any article discussed, then the claim must be backed up with facts and data.
I see much argument at this time about validity of sources, from a very divisive US President. I will not allow that division to enter this website.
updated hourly chart:
subminuette iv now looks complete
subminuette v may be extending if it is to reach below 2,796.34.
Yep! 🙂
ES bounced EXACTLY at 2820. Wow!
It will probably fall overnight.
Have a great evening everyone!
Traders are not waiting for the pre-close skulduggery.
This could get interesting. I still expect them to try and shake out out a few of them with a pre-close ramp. I hope they try it! lol!
Stink bid at the ready!! 🙂
Maybe it’s time to take a look-see at the hourly SPX. I spy with my little eye…a market that has retraced 62% of it’s last large up move, and additionally has indicated a turn back up right around two different up trend lines under recent price action. And the MACD is very close to reverting to a bull posture.
Yea, it may go down further. It may gyrate around a lot more; it’s in a big iv wave correction after all, it’s virtually “brownian motion” in here!
But until that 62% and those trend lines get busted to the down side, I see this market in bullish light going forward, particularly given high order wave counts, weekly and monthly trends, etc. If it pops down through those, my view changes quickly!
VXX flying another bull flag…
They are going to money around until right at the close and then let ‘er rip. Typical! 🙂
Three up off the lows today. Looks like we are going lower. 🙂
That’s how I count it too
*Yawn* Now another tug-of–war between 2820 and 2830.
I think above 2800 is bullish.
Buyers stepped up at right around 2820 so they are playing this one by the numbers.
Ordinarily long shadow would be bullish, but VIX also sporting a bull flag so who is right?! 🙂
I stepped out with a small gain. If we’re going to go down hard, it would be nice to see it begin in the next hour, and not overnight.
They are not going to make it easy, unfortunately. They are doing a great job keeping traders off balance with all the sleight-of-hand. The way they ramped the cash session at the open after the gap down in futures was absolutely classic. I think for the time being it is smart to aggressively sell the rips. At least that is my approach until proven otherwise! 🙂
Small??! You should have scored few doubles today dude! 🙂
Something strange is going on with Nasdaq. We had a gap off the bottom of VXN and price has seen absolutely no selling. Something not quite right there.
VIX HAS to gap higher. Clueless folk appear at still think it is a great idea to short vol under the circumstances. Will they never learn??!! 🙂
Hi Verne, are you worried that VIX is above its BB right now? in the past few months it seems to not to like being above or below it for very long…
Not a bad idea to take some profits off the table with that move. I am still holding a quarter as it still looks to me like we need a capitulation move.
They are really gaming the system today with all kinds of phony reversal signals so hard to tell if we are close to a bottom. So far the move down is too short for a C wave, and Nasdaq has hardly budged off its recent highs. Very interesting situation!
Hi Ari. I just took another look at VIX recent upper B band penetration and 6/25- 6/28 it stayed pinned to the top for a bit so it is possible we see a repeat over the next few days.
🙂
In the face of a longer/deeper iv wave, I see bonds rallying, and finance breaking down a bit. Here’s BAC, hourly. In there interest of getting some profits through the iv wave, I’ve take a synthetic short in BAC. Looking for 29.27 ideally.
Market pricing anomalies are truly amazing. Everyone knows that Nasdaq is going to follow the other indices lower yet here we are able to short it much closer to the recent highs than any of the other indices. Quite remarkable isn’t it? 🙂
Selling another 1/4 of long vol positions and DJI 253 strike puts for quick scalp of this morning’s phony ramp. Until the 2800 pivot question is finally resolved scalping the moves down still the best approach imho.
The algos were buying short-term pivot breaks overnight in futures and they kept it up today. I suspect if we break 2800 the algos are going to switch to the sell side of the game.
Attempt to reclaim 2840 stuffed. Now they need to successfully defend 2800 on a close. What fun! 🙂
There’s a 61.8% retrace fibo at 2822 that price is pausing just above. Best hope for a stopper today. It breaks that, 2800 is in the target.
So far…stopper! Got painted over a little but price has turned off it and is holding above for the moment.
IYT has broken a primary up trend line on the daily and hourly chart. I’ve taken a synthetic short on it, Dec. expiry. I’d like to see 195.2 minimum, 190.7 would be excellent, 187.5 exceptional!
Did anyone short the DJI pump?! 😀
The force is strong with SPX today. The second alternate hourly is looking goot!! If that is indeed where the EW structure is at, price is ascending in a 3 of a 5 of a 3. Should be some considerable momentum for a while. We’ll see!!
I’m not convinced about this up move. The move up from 2825.81 (the low on Friday) to today’s high is a 3 wave corrective structure.
We’re probably heading back down, unless it actually morphs into a 5 wave impulse…
I’m seeing that way too, at the moment. Nice profit Friday. New stop to buy is a bit south of here, pointing south. We will see what happens.
Distinguishing corrective from motive waves is indeed a critical and difficult skill. It will really keep you from getting bamboozled by the banksters. I am still learning the difference. 2800-2840 remains the key on a close. 🙂
Yea, it’s starting to look a bit like that last big iv we had, with a sequence of tumbling (lower highs) swings down until a final bottom. Could be similar here.
Now that today’s low took out Friday’s low, I have no idea what will happen from here… Was that the end of wave a of the alternate? Was that the end of subminuette 1 of the main count, with waves 2,3,4,5 remaining? Are we going to go up from here in a b wave or a wave 2, or will we meander and plunge below 2800?
I’ve had good profits shorting this wave down, so its SOH (sit on hands) time for me and read other’s posts on here 🙂
Watch volatility! 🙂
Gold and silver continuing their price collapse. AG tanking, down to 5.96 and falling. I was out when the 61.8% got cracked, always a very bad sign (or a strong sign for shorting!). The 78.6% is 5.7 and perhaps that holds. Or it’s headed to 4.93.
I continue to be amazed at the continued decline in the precious metals. I am beginning to salivate at the prospect of $16 GDX and whatever NUGT will be at that point. That is where I will be looking to take a large long position.
I wonder what it implies for the world economy in 6-18 months. Metals are dropping because of either (1) lots of supply or (2) less demand. I’d guess it’s #2, and it’s probably a leading indicator. Of what? A major recession taking shape starting in the 2020 timeframe.
I kept my longs and hedged with big bull call spreads on GLD. Amazing how well that works. Still slightly in the green on profit from rolling spreads down, and sitting on lots of GLD calls a few months out at zero cost basis. 🙂
Rodney I’m sure you are aware but for others: BEWARE NUGT! Look at a monthly chart. Six years ago it was at 16000…now it’s at 18 or whatever. Like VXX, it’s a continuously degrading (in price) instrument. So buying it and holding it for more than a few days is extremely risky, and “holding on for it to come back” is nonsensical. NUGT should only be used (IMO) as an intraday trading tool. The pain of experience talking…
Thanks for the info Kevin. I realize the issues and need for NUGT to be very short term. I will look for other means to get some leverage on the miners which can be leverage on the precious metals themselves.
Those things are absolutely toxic for anyone trying to buy and hold them because of that awful decay and daily re-balancing. The best way to trade em is by getting positioned for free by selling credit spreads. When you get the timing is right, you can make some spectacular trades though, but definitely NOT buy and hold!
I am shocked and trapped at the moment in AG!
Lots of ways to hedge your position…! 🙂
Hope everyone is enjoying their weekend!
Awesome analysis once again by Lara!
We will have critical information about the short to medium term destiny of the market Sunday evening. I have mentioned previously how the most powerful indicator I have found the last few years has been the outcome of battles around contested price pivots.
In my opinion the last one was the 2840 area. ES has tested this pivot numerous times recently. The pattern I have noticed is that when a serious decline is truly underway, previously contested pivots are taken out decisively on the FIRST impulse down. Since that did not happen last Friday, that indicator is suggesting to me that it price will once again find strong support in the 2800-2840 area, lunar cycle notwithstanding. If however, we see ES take out 2800, the prior contested pivot, we could be heading to 2750.
I went into Friday’s session holding my biggest long vol position since January and took profits on about 1/4 of my trades before the close.
An ES break of 2800 will be confirmation from BOTH my favorite indicator, AND what appears to typically be a weak period accompanying the coming full moon, when a market low would be expected. Bottom line is that an ES bounce at 2800 would imho be a very reliable buy signal. A decisive break means more downside ahead!
What about an intraday break? Similar to the low from 8/2? Lara says to expect a low below 2796 but not below 2791.
Intraday price action less important than price on a closing basis.
If we see series gaps down continue, that pivot could fall with an opening gap down past it and a close below it means it becomes strong resistance.
Futures suggesting some sideways coil for today’s session as they implement a “managed decline” strategy. We all know what protracted coils lead to.