An upwards day fits expectations for the main short term Elliott wave count.
Summary: Assume that while price remains above 2,791.47 either a shallow consolidation may continue sideways for a few days or a brief pullback was over at the last low. A new high above 2,848.03 with support from volume would indicate the correction is over.
A new low below 2,791.47 would indicate a deeper pullback may continue. The target for it to end would then be about 2,752.
At the end of the week, the AD line is making new all time highs at the daily and weekly chart levels and On Balance Volume has a new all time high on the weekly chart. This is all very bullish.
If my expectations are wrong for another small pullback, then my error may be in expecting a pullback which may not come. Price may simply continue strongly higher.
The bigger picture remains extremely bullish.
The next target is about 2,915, where another consolidation to last about two weeks may be expected.
The invalidation point remains at 2,743.26.
The mid to longer term target is at 2,922 (Elliott wave) or 3,045 (classic analysis). Another multi week to multi month correction is expected at one of these targets.
The final target for this bull market to end remains at 3,616.
Always practice good risk management. Always trade with stops and invest only 1-5% of equity on any one trade.
New updates to this analysis are in bold.
The biggest picture, Grand Super Cycle analysis, is here.
Last historic analysis with monthly charts is here, video is here.
ELLIOTT WAVE COUNT
WEEKLY CHART
Cycle wave V must complete as a five structure, which should look clear at the weekly chart level and also now at the monthly chart level. It may only be an impulse or ending diagonal. At this stage, it is clear it is an impulse.
Within cycle wave V, the third waves at all degrees may only subdivide as impulses.
Intermediate wave (4) has breached an Elliott channel drawn using Elliott’s first technique. The channel is redrawn using Elliott’s second technique: the first trend line from the ends of intermediate waves (2) to (4), then a parallel copy on the end of intermediate wave (3). Intermediate wave (5) may end either midway within the channel, or about the upper edge.
Intermediate wave (4) may now be a complete regular contracting triangle lasting fourteen weeks, one longer than a Fibonacci thirteen. There is perfect alternation and excellent proportion between intermediate waves (2) and (4).
Within intermediate wave (5), no second wave correction may move beyond the start of its first wave below 2,594.62. However, the lower edge of the black Elliott channel drawn across the ends of intermediate degree waves should provide very strong support for any deeper pullbacks, holding price well above the invalidation point while intermediate wave (5) unfolds.
At this stage, the expectation is for the final target to me met in October 2019.
A multi week to multi month consolidation for primary wave 4 is expected on the way up to the final target.
The last bullish fifth wave of minor wave 5 to end intermediate wave (3) exhibited commodity like behaviour. It was strong and sustained. It is possible that the upcoming wave of minor wave 5 to end intermediate wave (5) to end primary wave 3 may exhibit similar behaviour, so we should be on the lookout for this possibility.
DAILY CHART
Intermediate wave (5) would be very likely to make at least a slight new high above the end of intermediate wave (3) at 2,872.87 to avoid a truncation.
Intermediate wave (3) exhibits no Fibonacci ratio to intermediate wave (1). It is more likely then that intermediate wave (5) may exhibit a Fibonacci ratio to either of intermediate waves (1) or (3). The most common Fibonacci ratio would be equality in length with intermediate wave (1), but in this instance that would expect a truncation. The next common Fibonacci ratio is used to calculate a target for intermediate wave (5) to end.
It is possible that minute wave iii could be over at last week’s high; if it is complete here, it would not exhibit a Fibonacci ratio to minute wave i. Minute wave iv must be very shallow to remain above minute wave i price territory at 2,791.47.
At this stage, it is possible that minute wave iv was over at this week’s low, or that it may continue sideways for a few days as a flat. A flat correction requires a new high to at least 2,842.86 and possibly above 2,848.03, followed by a short wave down to end below 2,796.34 but not below 2,791.47.
If downwards movement continues below 2,791.47, then the best alternate idea would be to move the degree of labelling within minute wave iii all down one degree and see only minuette wave (i) within minute wave iii complete at the last high. Downwards movement would then be labelled minuette wave (ii), which may not move beyond the start of minuette wave (i) below 2,691.99. However, downwards movement should find support reasonably above the invalidation point at support about the lower edge of the best fit channel.
A target is calculated for minor wave 3 to end, which expects to see the most common Fibonacci ratio to minor wave 1. Minor wave 3 may last several weeks in total and should look like an impulse at the daily chart level. When it is complete, then minor wave 4 may last about one to two weeks in order for it to exhibit reasonable proportion to minor wave 2. Minor wave 4 must remain above minor wave 1 price territory.
A best fit channel is added in taupe to this chart. It contains all of intermediate wave (5) so far. The lower edge may provide support for any deeper pullbacks. The upper edge may provide resistance.
FIRST HOURLY CHART
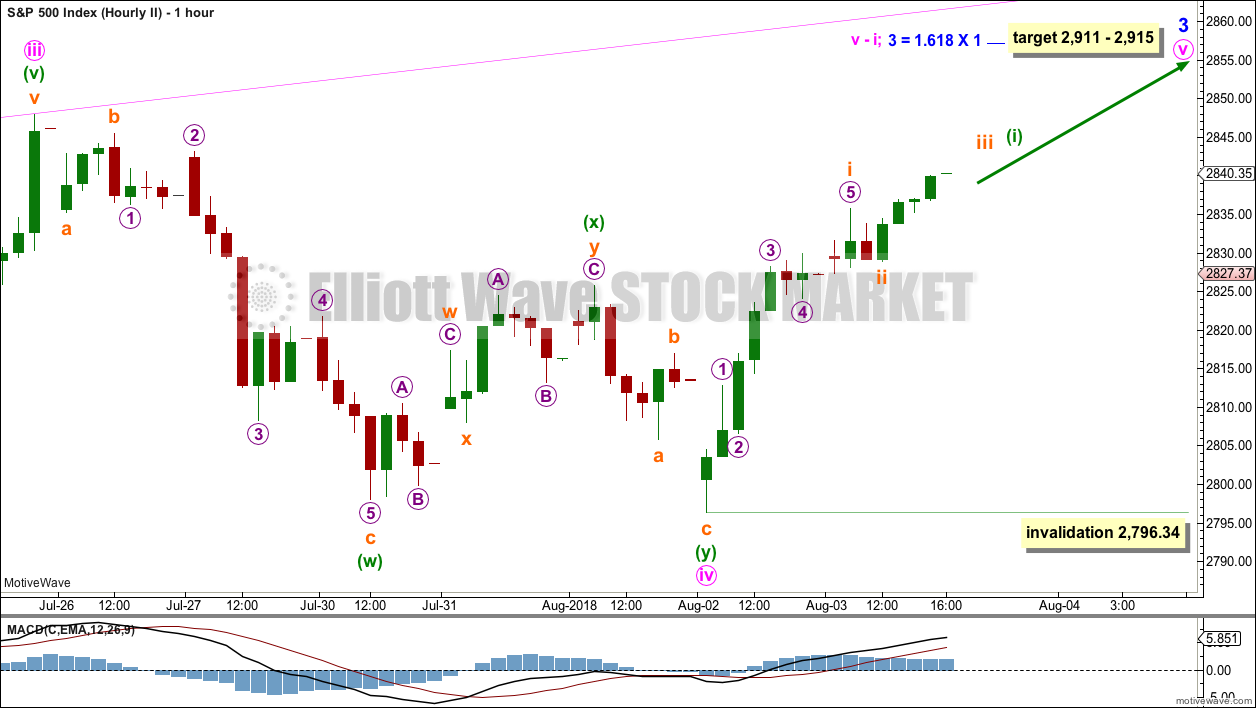
If minute wave iii was over at the last high, then there are reasonable Fibonacci ratios within it.
Minute wave ii was a very deep 0.87 single zigzag lasting 11 sessions. Minute wave iv would most likely be shallow, and most likely exhibit alternation in structure with minute wave ii as a flat, combination or triangle.
At this stage, if minute wave iv is continuing, then the structural possibilities may be narrowed down to a flat correction. Rules for triangles or combinations are at this stage not met.
Within the flat correction, minuette wave (b) must retrace a minimum 0.9 length of minuette wave (a), and it may make a new high above the start of minuette wave (a) as in an expanded flat. Minuette wave (b) should exhibit weakness; it should have light and declining volume, and should not come with a new high for either of On Balance Volume or the AD line. At this stage, these conditions are met.
When minuette wave (b) has reached the minimum requirement and may be a complete structure, then minuette wave (c) downwards would be most likely to make at least a slight new low below the end of minuette wave (a) at 2,796.34 to avoid a truncation.
Minute wave iv may not move into minute wave i price territory below 2,791.47.
At the end of this week, this first hourly chart has support from classic technical analysis.
SECOND HOURLY CHART
By simply moving the degree of labelling within the correction all up one degree, it is possible today that minute wave iv could again be over as a shallow double zigzag.
However, it would be very brief and so disproportionate to minute wave ii. Minute wave ii lasted 11 sessions. Minute wave iv would have lasted only six sessions.
There would be a little alternation in structure as minute wave ii was a single zigzag and minute wave iv may be a double zigzag. Alternation is a guideline, not a rule, and alternation in structure does not always occur.
There would be excellent alternation in depth: minute wave ii was very deep and minute wave iv would be very shallow.
Within minute wave v, no second wave correction may move beyond the start of its first wave below 2,796.34.
If price makes a new high above 2,848.03 and meets one or more of the following conditions, then this would be the main wave count:
– support from volume
– a new high from On Balance Volume
– a new high from the AD line
ALTERNATE HOURLY CHART
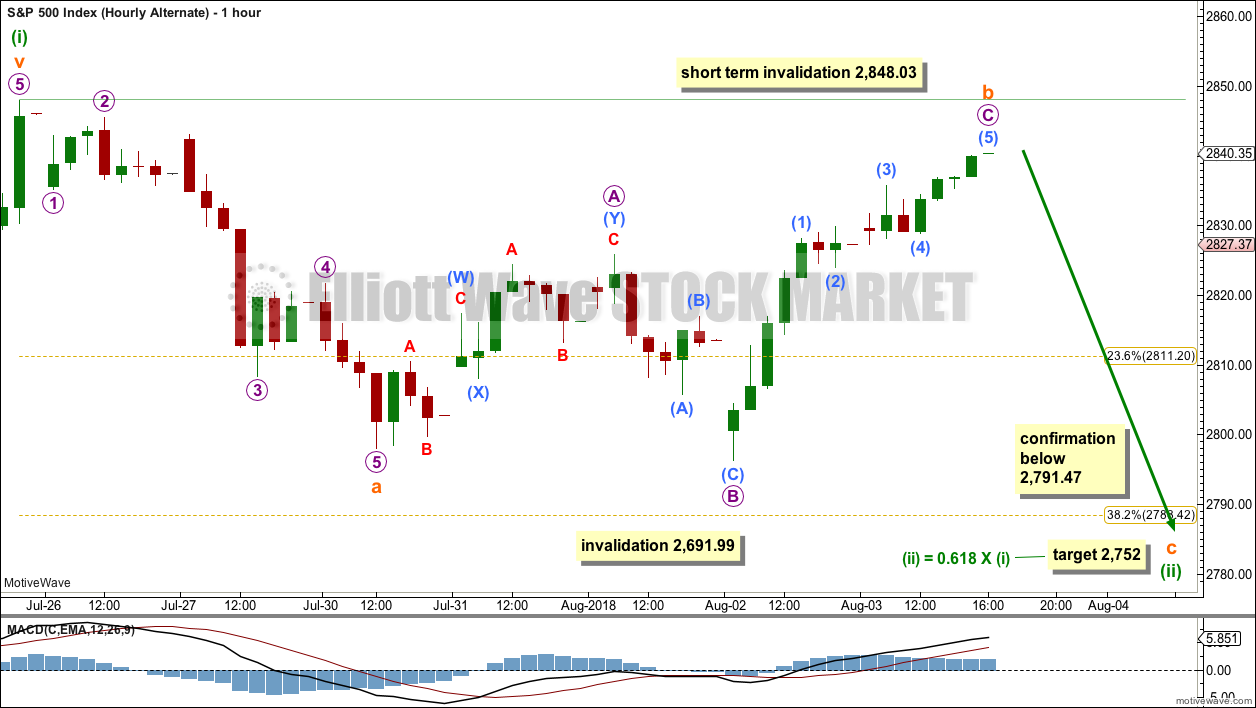
This alternate wave count moves the degree of labelling within minute wave iii all down one degree.
If minuette wave (i) was over at the last high, then downwards movement of the last six sessions may be the start of minuette wave (ii). A target for minuette wave (ii) would reasonably be the 0.618 Fibonacci ratio of minuette wave (i) about 2,752. However, if this target is wrong, it may be a little too low. There may be support just above this point at the lower edge of the best fit channel, which is seen on the daily chart.
Minuette wave (ii) may not move beyond the start of minuette wave (i) below 2,691.99.
This wave count sees minuette wave (ii) as a possible single zigzag. Within minuette wave (ii), subminuette wave a subdivides as a five, and subminuette wave b now may be complete as a regular flat correction. This wave count no longer has a better fit for recent subdivisions. This wave count now has to see a five wave structure unfolding higher as micro wave C; at this state, within micro wave C, sub-micro wave (3) is very difficult to see as an impulse on the five minute chart.
If subminuette wave b continues higher, then it may not move beyond the start of subminuette wave i above 2,848.03.
Following a new high above 2,848.03, it would be possible that minuette wave (ii) could still be unfolding as a flat correction in the same way as the correction for minute wave iv could be a flat correction (as per the first hourly chart). But the idea as a flat correction would be discarded with such a shallow A wave.
TECHNICAL ANALYSIS
WEEKLY CHART
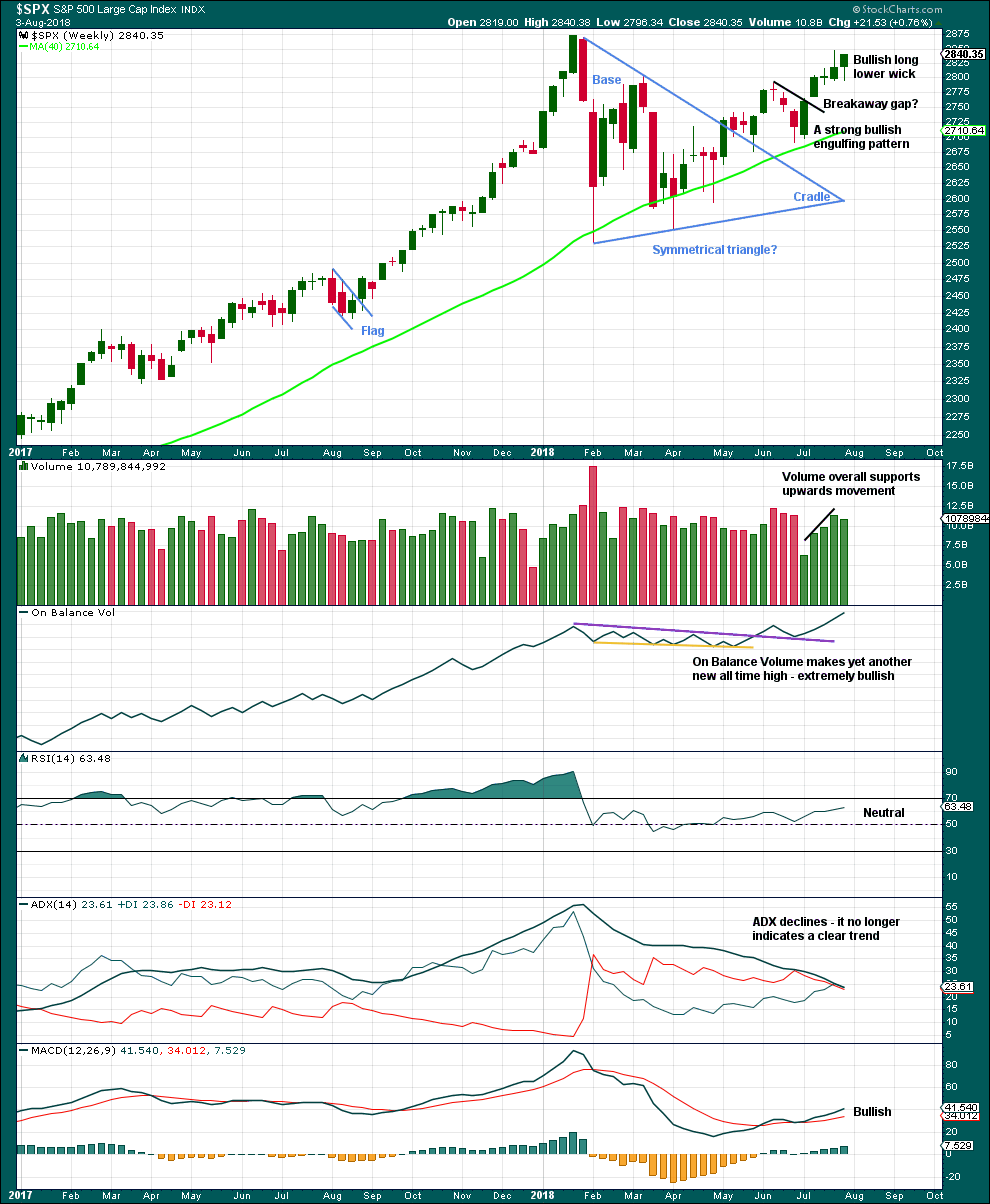
Click chart to enlarge. Chart courtesy of StockCharts.com.
Another new high for On Balance Volume remains very bullish indeed, but that does not preclude another small pullback within this developing upwards trend. It is still expected that price is very likely to make new all time highs, but it will not move in a straight line.
This week’s candlestick is bullish with a long lower wick. But it lacks support from volume, which may suggest a B wave.
DAILY CHART
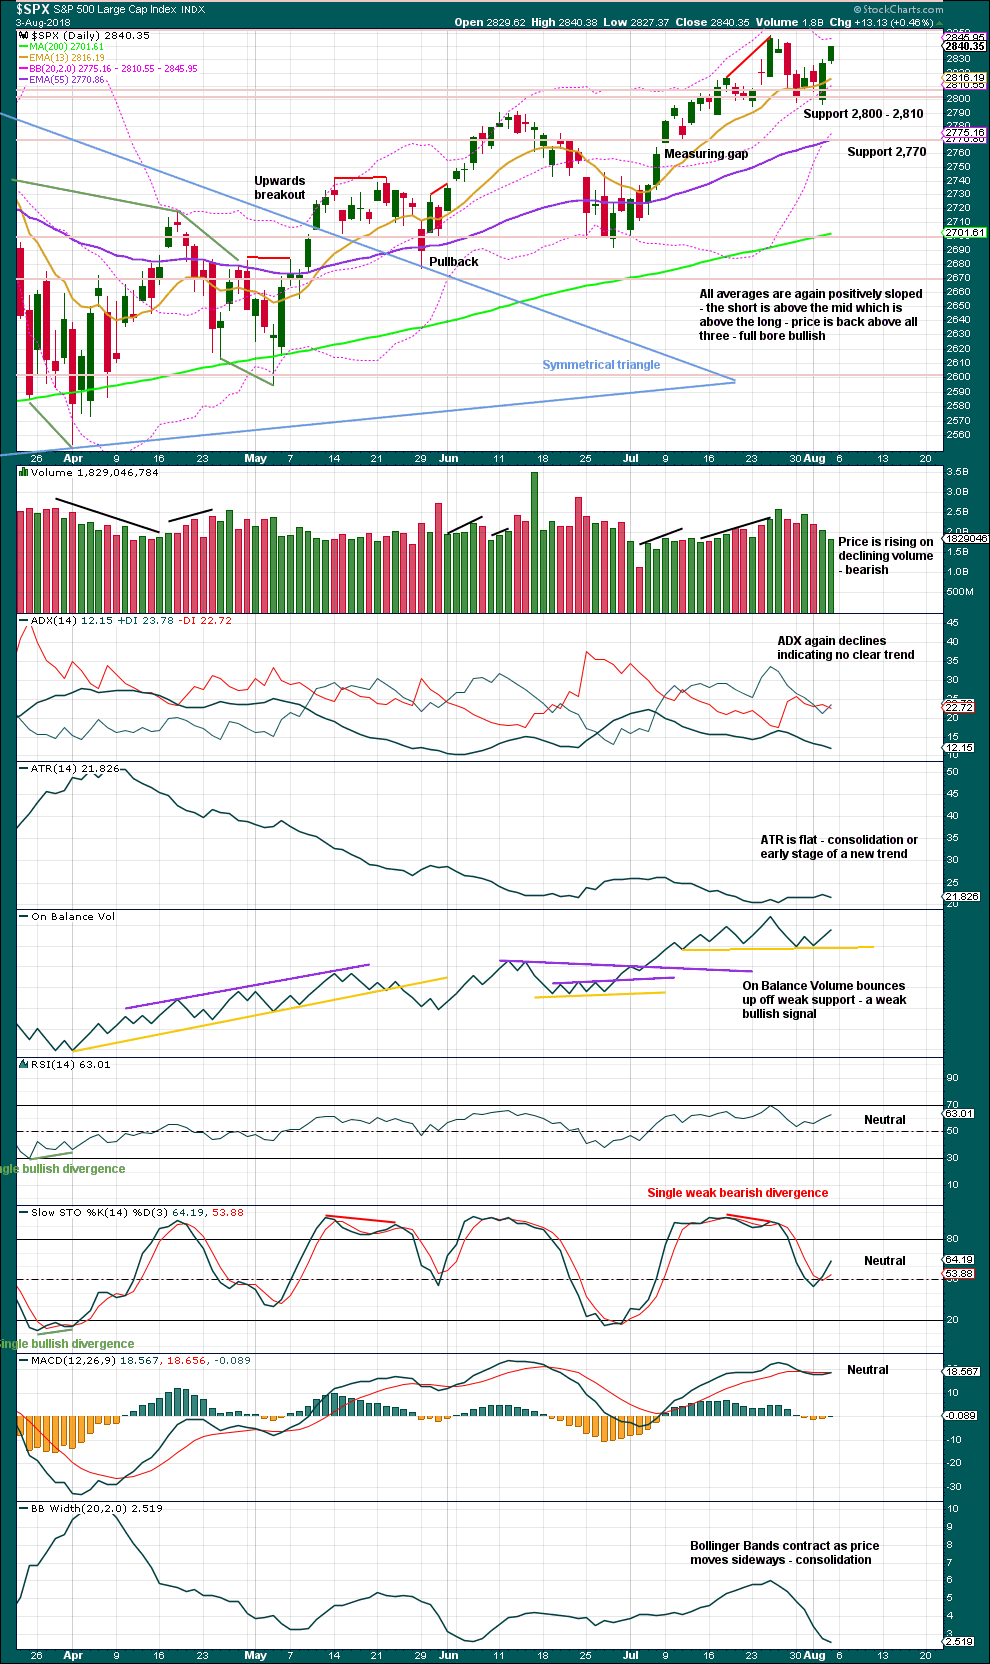
Click chart to enlarge. Chart courtesy of StockCharts.com.
The symmetrical triangle may now be complete. The base distance is 340.18. Added to the breakout point of 2,704.54 this gives a target at 3,044.72. This is above the Elliott wave target at 2,922, so the Elliott wave target may be inadequate.
Since the low on the 2nd of April, 2018, price has made a series of higher highs and higher lows. This is the definition of an upwards trend. But trends do not move in perfectly straight lines; there are pullbacks and bounces along the way.
This bull run now has some support from volume and strong support from On Balance Volume making new all time highs.
Upwards movement of the last two days looks weak. On Balance Volume at the daily chart level has not made a new all time high, and volume does not support upwards movement. However, a close at highs for Friday strongly suggests at least a little upwards movement to begin next week.
VOLATILITY – INVERTED VIX CHART
WEEKLY CHART
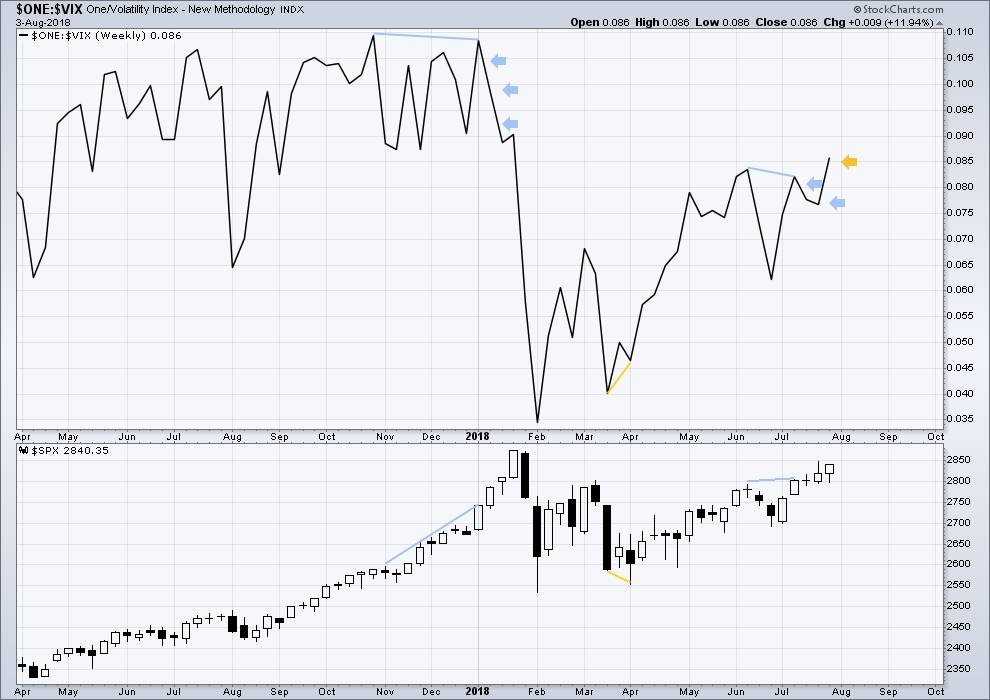
Click chart to enlarge. Chart courtesy of StockCharts.com. So that colour blind members are included, bearish signals
will be noted with blue and bullish signals with yellow.
To keep an eye on the all time high for inverted VIX a weekly chart is required at this time.
Notice how inverted VIX has very strong bearish signals four weeks in a row just before the start of the last large fall in price. At the weekly chart level, this indicator may be useful again in warning of the end of primary wave 3.
This week completes an inside week that closed green, and the balance of volume was upwards.
Upwards movement this week has support from declining market volatility. Inverted VIX has made a new short term high, but price has not yet; this short term divergence is bullish.
Inverted VIX is still some way off from making a new all time high.
DAILY CHART
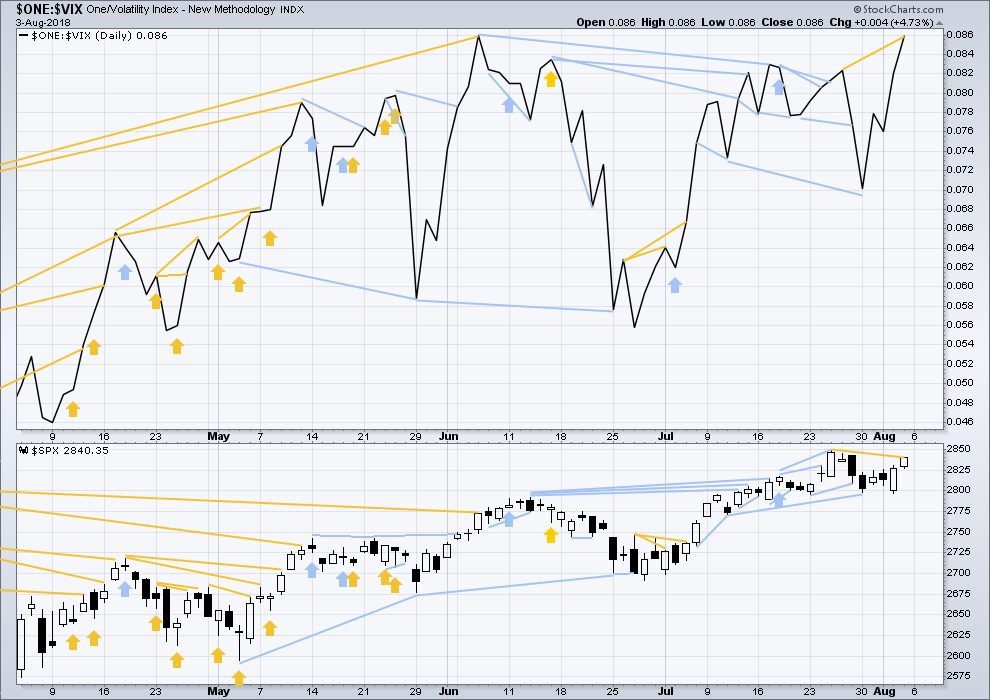
Click chart to enlarge. Chart courtesy of StockCharts.com. So that colour blind members are included, bearish signals
will be noted with blue and bullish signals with yellow.
Normally, volatility should decline as price moves higher and increase as price moves lower. This means that normally inverted VIX should move in the same direction as price.
Last noted mid term bearish divergence has not been followed yet by more downwards movement. It may still indicate downwards movement ahead as there is now a cluster of bearish signals from inverted VIX.
There is new bullish divergence at the weekly chart level for the short term. Inverted VIX moved strongly higher this week to make a new high above the prior swing high of seven sessions ago, but price has not yet quite made a new high above the equivalent point.
BREADTH – AD LINE
WEEKLY CHART
Click chart to enlarge. Chart courtesy of StockCharts.com.
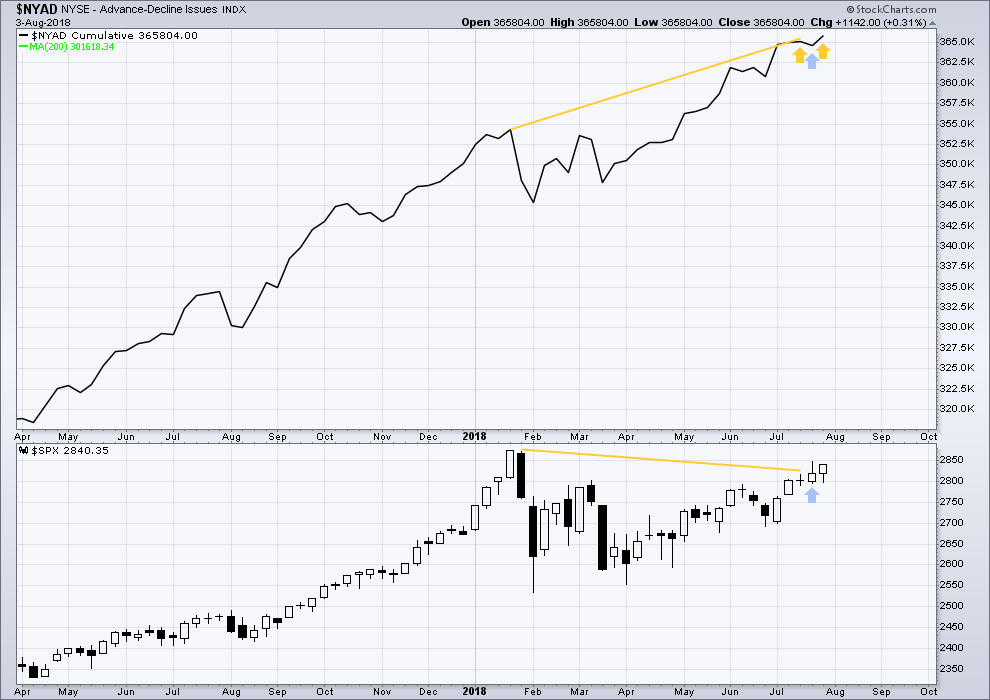
When primary wave 3 comes to an end, it may be valuable to watch the AD line at the weekly time frame as well as the daily.
At this stage, there is very strong bullish divergence between price and the AD line at the weekly time frame. With the AD line making new all time highs, expect price to follow through with new all time highs in coming weeks.
Price this week completed an inside week with the balance of volume upwards. Upwards movement has support from rising market breadth. Another new all time high this week from the AD line is bullish.
DAILY CHART
Click chart to enlarge. Chart courtesy of StockCharts.com.
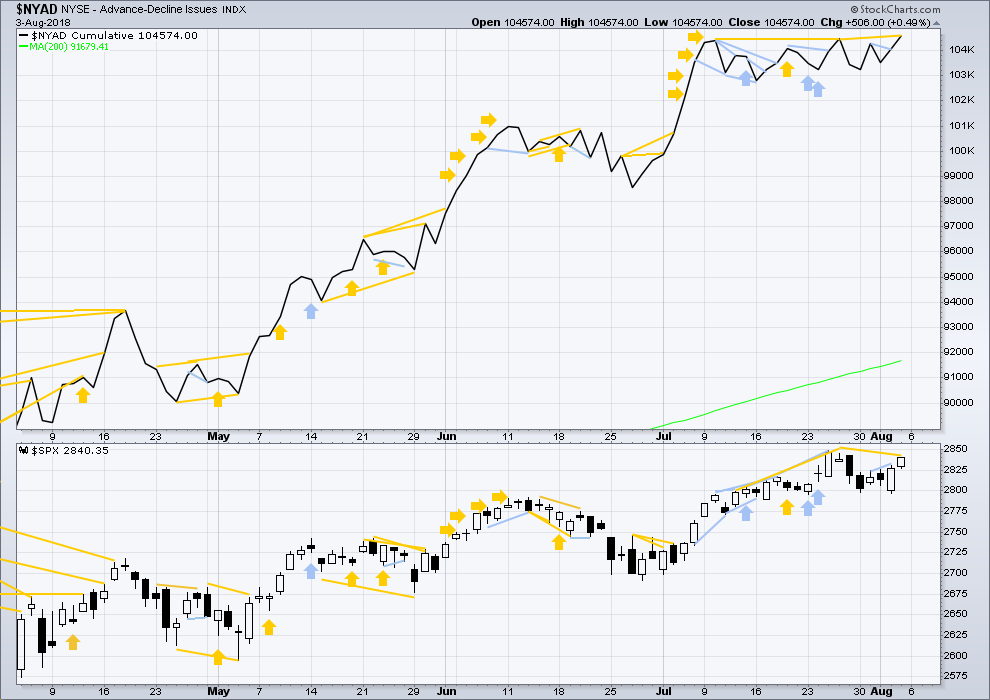
There is normally 4-6 months divergence between price and market breadth prior to a full fledged bear market. This has been so for all major bear markets within the last 90 odd years. With no longer term divergence yet at this point, any decline in price should be expected to be a pullback within an ongoing bull market and not necessarily the start of a bear market. New all time highs from the AD line means that any bear market may now be an absolute minimum of 4 months away. It may of course be a lot longer than that. My next expectation for the end of this bull market may now be October 2019.
Breadth should be read as a leading indicator.
The last signal from the AD line was very bullish, with another new all time high last Thursday.
The AD line has made a new high above the prior high seven sessions ago, but price has not yet made an equivalent new high. This divergence is bullish.
Another new all time high from the AD line on the daily chart is very bullish.
Small caps have made another slight new all time on Friday. Mid caps made a new all time high on the 10th of July. Only large caps have to follow through; they do usually lag in the latter stages of a bull market.
DOW THEORY
The following lows need to be exceeded for Dow Theory to confirm the end of the bull market and a change to a bear market:
DJIA: 23,360.29.
DJT: 9,806.79.
S&P500: 2,532.69.
Nasdaq: 6,630.67.
Only Nasdaq at this stage is making new all time highs, with another new all time high on Friday of last week. DJIA and DJT need to make new all time highs for the ongoing bull market to be confirmed.
Charts showing each prior major swing low used for Dow Theory may be seen at the end of this analysis here.
Published @ 07:14 p.m. EST on 4th August, 2018.

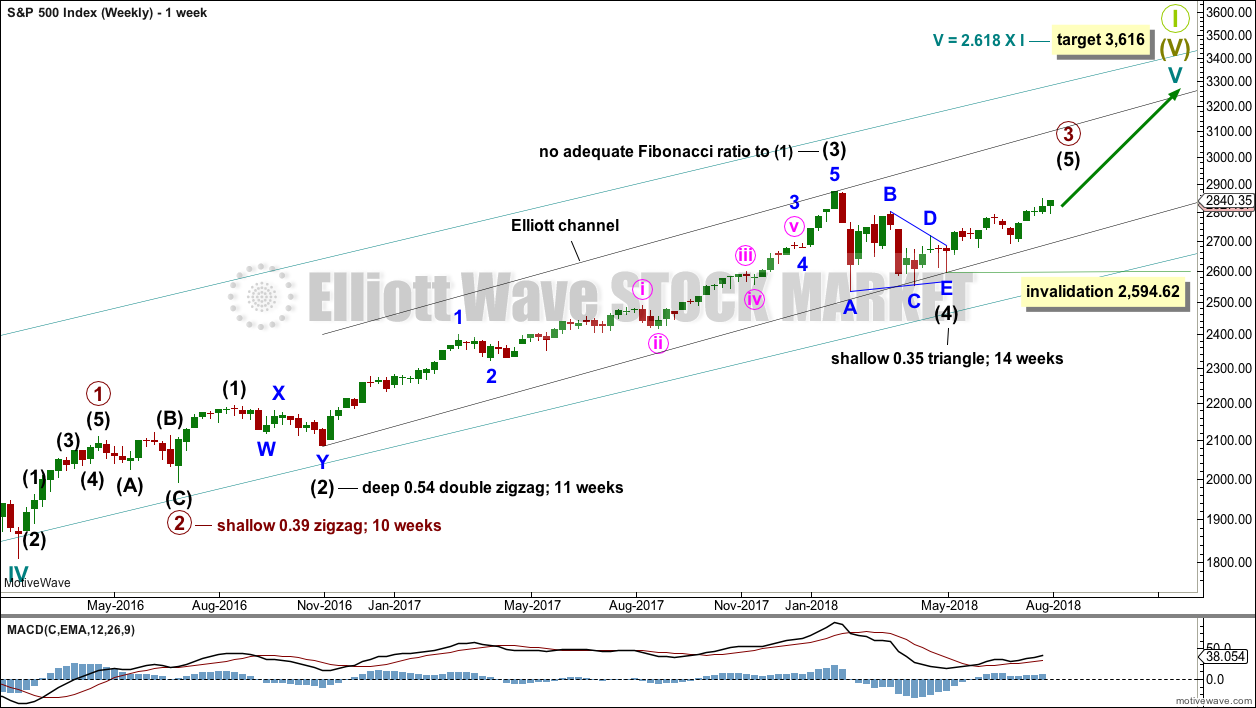

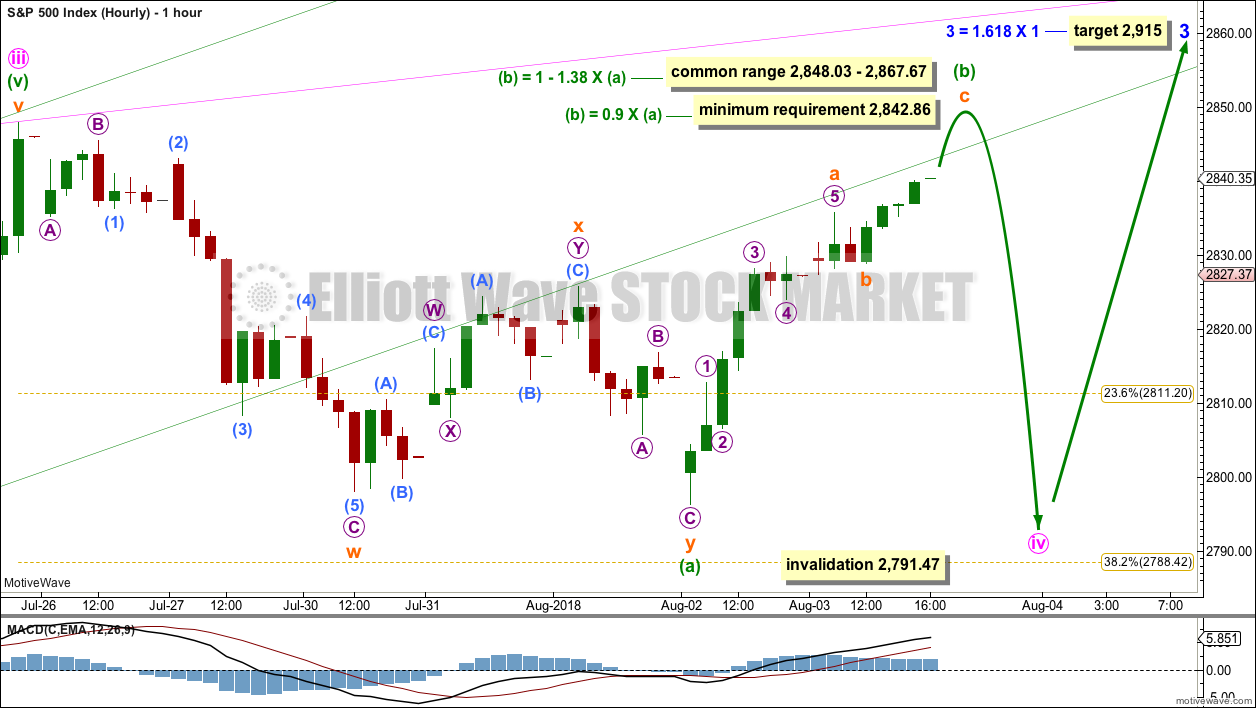
when this session is over I’ll be looking very carefully at strength or weakness within this new high. if there is any weakness then I’ll expect it’s a B wave and this would be the main wave count.
if there is strength then this will be the main wave count
Yep! Yep! Yep!
One more push up out of this triangle methinks.
I am expecting VIX spreads to get crazy real soon so backed up the truck for 13.00 strike Aug 22 calls for under a buck. Looking for a bit lower move to lower cost basis to around 0.80 the next day or two. Just take a look at those beautiful charts will ya?
Have a great evening everyone! 🙂
Just my thoughts.
Surpassed SPX 2848 this morning up to 2853+. Now the first pullback in this move up back down to retest 2848 successfully. If we now finish the day above 2853+ at the high of the day, it would indicate some staying power in this up move. A new ATH becomes very possible and perhaps probable to be exceeded soon. MACD daily has crossed positively so it is now bullish with plenty of room to move to the upside.
The concern I have for the period upcoming is the likelihood of a lot of backing and filling under the ATH price of 2873, which COULD degenerate into a significant sell off and a double top look (but we know a full double top structure with a measured move sell off is NOT in the card here per Lara’s EW count).
On the other side…once over the ATH and the closest fibo extension just above it at 2879…there’s an air pocket, and price may take off like a rocket through it, up to the 2959 area where the next set of (overlapped) extensions are.
AMTD again, breaking another hourly down trend line and doing so in a six hour (so far) squeeze. Could pop pretty hard and fast.
Will SPX finally push above 2848 today? It’s a bullish day…but a very slow grinding day. Perhaps after lunch on the east coast…or maybe a little later in the week.
Well, we can pretty much kiss that C wave down model goodbye. Much more bullish than that and the key level of 2848 is now surpassed. “Everything is proceeding as Lara has foreseen…”
2854.8 is a 1.618 extension fibo that could provide resistance.
the first C or the alt C… or both?
I don’t know. All I “know” (believe) is that the minute iv is long dead, and price is now in a motive wave up, a minute v I guess. No way IMO that this is a B wave of a minute iv!
I strongly suspect that this initial thrust is now going to execute some kind of a ii wave back down, turning off of (very close to) that 1.618 extension at 7854. We’ll see!
My view, hourly.
would be nice!
Everyone on Vacation? Really quiet today.
I just got back from two wonderful weeks on the Pacific Coast of Oregon, USA.
Welcome back Rod!
Hopefully you kept your distance from those torrid CA wild fires.
Although from what I have been reading, some of them don’t seem to be “wild” at all! Very strange goings on indeed! 🙂
Human activity is increasing CA fire risk, unquestionably.
However, environmental laws and rules are NOT contributing. Contrary to public statements made by those who are clueless about such things.
What do you think about the houses literally cut in half by the burn path, with nearby shrubbery unscathed? Pretty discriminating wild fire it would seem! 🙂
On the coast of Oregon, at least central to northern, the fire danger is very low. Rain forest sort of terrain. Move 100 miles inland past the Inter-coastal Mountains and it is another picture indeed. Fires galore on dry crops and wild lands. High temps in the high 100’s this week and low humidity (15% to 20%) means lots of human activity can cause fires. If we start getting August lightning storms things could get a lot worse.
There was no mention of radioactivity anywhere I looked. They are not speaking about it one way or the other. Tourism is the coast’s great economic engine after logging. If they spoke about radiation, it would certainly undermine millions and millions of revenue. We visited the Oregon Pacific Aquarium. There were no exhibits speaking to the issue of Japan’s nuclear radiation leaks and their effect, if any, on the USA western states. I would have like to see that. Too controversial I think.
We really enjoyed the Pacific waters though. Not too cold this time of year and plenty of small wave action. Enough for many surfers here and there. Beautiful beaches on which we drive our four wheel drive vehicles. Awesome fun.
Yeah! Japan is pretty quite too!
That Pacific plume is truly terrifying!
AMAT on the monthly chart never got to a down trend, only neutral. Now, it’s very close to finally breaking it’s weekly/daily downtrend line. It’s already polarity inverted. I’m already long via a spread or synthetic long anticipating it will go, but waiting for more confirmation isn’t a bad play. Once it’s at 50 I I may want to be on board for more. Not trading advice, your profits/losses may vary, use defined risk mgt (some form of stops), etc.
AMAT has busted that down trend line.
SPX weekly, daily, hourly. Time for swing extensions to provide likely target/turn price areas. I’ve got 4 such swing in play from the last 6 months, and they give me the fibo structure “overhead” shown. Note that once price busts above the ATH and the 161.8 just slightly above it…it’s AIR POCKET time. Price could start moving with much higher momentum once there. But first there’s 5 fibo’s overhead to work through. The up channel isn’t anything certain…but expect trends to continue until they don’t, and this one is arguably just getting started. A break of the up channel (eventually!) will be a huge alert to me to realign myself with a potentially higher TF trend change initiating.
Daily.
Hourly. Overlapped fibos from different price swings give us powerful insight to the fact that swing lengths are NOT random!! They are at lengths that “interlock” fractally.
Sorry here’s a better daily chart. Comparing price swings on this tf with what’s starting now indicates to me it’s a fine time to be strongly bullish biased!