A small upwards day remains below the short term Elliott wave invalidation point. Three short term Elliott wave counts are presented today.
Summary: Assume that while price remains above 2,791.47 either a shallow consolidation may continue sideways for a few days or a brief pullback was over at yesterday’s low. A new high above 2,848.03 with support from volume would indicate the correction is over.
A new low below 2,791.47 would indicate a deeper pullback may continue. The target for it to end would then be about 2,752.
The bigger picture remains extremely bullish.
The next target is about 2,915, where another consolidation to last about two weeks may be expected.
The invalidation point remains at 2,743.26.
The mid to longer term target is at 2,922 (Elliott wave) or 3,045 (classic analysis). Another multi week to multi month correction is expected at one of these targets.
The final target for this bull market to end remains at 3,616.
Always practice good risk management. Always trade with stops and invest only 1-5% of equity on any one trade.
New updates to this analysis are in bold.
The biggest picture, Grand Super Cycle analysis, is here.
Last historic analysis with monthly charts is here, video is here.
ELLIOTT WAVE COUNT
WEEKLY CHART
Cycle wave V must complete as a five structure, which should look clear at the weekly chart level and also now at the monthly chart level. It may only be an impulse or ending diagonal. At this stage, it is clear it is an impulse.
Within cycle wave V, the third waves at all degrees may only subdivide as impulses.
Intermediate wave (4) has breached an Elliott channel drawn using Elliott’s first technique. The channel is redrawn using Elliott’s second technique: the first trend line from the ends of intermediate waves (2) to (4), then a parallel copy on the end of intermediate wave (3). Intermediate wave (5) may end either midway within the channel, or about the upper edge.
Intermediate wave (4) may now be a complete regular contracting triangle lasting fourteen weeks, one longer than a Fibonacci thirteen. There is perfect alternation and excellent proportion between intermediate waves (2) and (4).
Within intermediate wave (5), no second wave correction may move beyond the start of its first wave below 2,594.62. However, the lower edge of the black Elliott channel drawn across the ends of intermediate degree waves should provide very strong support for any deeper pullbacks, holding price well above the invalidation point while intermediate wave (5) unfolds.
At this stage, the expectation is for the final target to me met in October 2019.
A multi week to multi month consolidation for primary wave 4 is expected on the way up to the final target.
The last bullish fifth wave of minor wave 5 to end intermediate wave (3) exhibited commodity like behaviour. It was strong and sustained. It is possible that the upcoming wave of minor wave 5 to end intermediate wave (5) to end primary wave 3 may exhibit similar behaviour, so we should be on the lookout for this possibility.
DAILY CHART
Intermediate wave (5) would be very likely to make at least a slight new high above the end of intermediate wave (3) at 2,872.87 to avoid a truncation.
Intermediate wave (3) exhibits no Fibonacci ratio to intermediate wave (1). It is more likely then that intermediate wave (5) may exhibit a Fibonacci ratio to either of intermediate waves (1) or (3). The most common Fibonacci ratio would be equality in length with intermediate wave (1), but in this instance that would expect a truncation. The next common Fibonacci ratio is used to calculate a target for intermediate wave (5) to end.
It is possible that minute wave iii could be over at last week’s high; if it is complete here, it would not exhibit a Fibonacci ratio to minute wave i. If minute wave iv unfolds here, then it must be very shallow to remain above minute wave i price territory at 2,791.47.
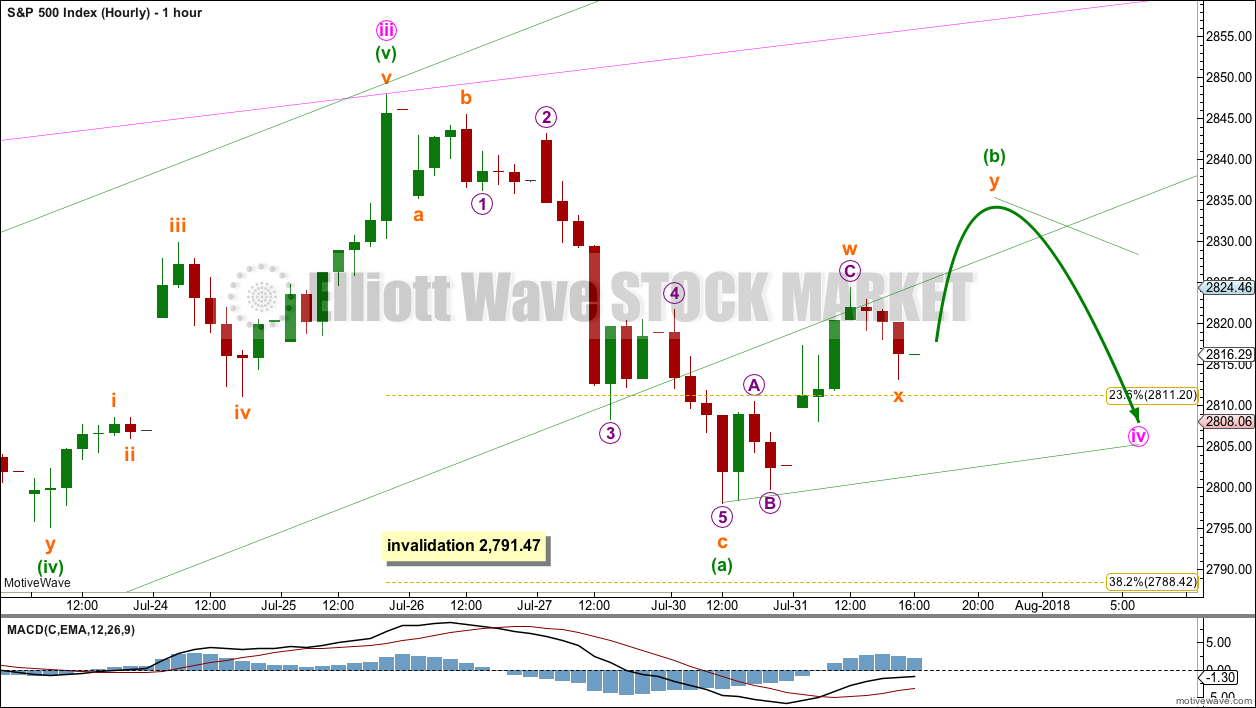
At this stage, it is possible that minute wave iv was over as a relatively brief zigzag at yesterday’s low, or that it may continue sideways for a few days as a flat, combination or triangle. Both ideas are outlined in hourly charts below.
If downwards movement continues below 2,791.47, then the best alternate idea would be to move the degree of labelling within minute wave iii all down one degree and see only minuette wave (i) within minute wave iii complete at the last high. Downwards movement would then be labelled minuette wave (ii), which may not move beyond the start of minuette wave (i) below 2,691.99. However, downwards movement should find support reasonably above the invalidation point at support about the lower edge of the best fit channel.
A target is calculated for minor wave 3 to end, which expects to see the most common Fibonacci ratio to minor wave 1. Minor wave 3 may last several weeks in total and should look like an impulse at the daily chart level. When it is complete, then minor wave 4 may last about one to two weeks in order for it to exhibit reasonable proportion to minor wave 2. Minor wave 4 must remain above minor wave 1 price territory.
A best fit channel is added in taupe to this chart. It contains all of intermediate wave (5) so far. The lower edge may provide support for any deeper pullbacks. The upper edge may provide resistance.
FIRST HOURLY CHART
If minute wave iii was over at the last high, then there are reasonable Fibonacci ratios within it.
Minute wave ii was a very deep 0.87 single zigzag lasting 11 sessions. Minute wave iv would most likely be shallow, and most likely exhibit alternation in structure with minute wave ii as a flat, combination or triangle.
If minute wave iv is a triangle as labelled, then within it minuette wave (b) may be an incomplete double zigzag. Minuette wave (b) may make a new high above the start of minuette wave (a) at 2,848.03 as in a running triangle. There can be no upper invalidation point for this wave count for this reason. However, minuette wave (b) should exhibit weakness; it should have weak volume and momentum. If price makes a new high with strength, then this wave count would be discarded.
If minute wave iv is a flat correction, then within it minuette wave (a) may be a complete zigzag. Minuette wave (b) may now be unfolding higher as a double zigzag, which may make a new high above the start of minuette wave (a) as in an expanded flat correction. Minuette wave (b) must retrace a minimum 0.9 length of minuette wave (a) at 2,843.03. The most common length for minuette wave (b) within a flat would be from 1 to 1.38 the length of minuette wave (a), giving a range from 2,848.03 to 2,867. Minuette wave (b) should exhibit weakness in either or both of volume and momentum.
If minute wave iv is a double combination, then the first structure in a double may be a complete single zigzag labelled minuette wave (w). The double may now be joined by an incomplete three in the opposite direction labelled minuette wave (x). Minuette wave (x) may subdivide as any corrective structure that may make a new high above 2,848.03 but should exhibit weakness. When minuette wave (x) could be complete, then the second structure in the double would most likely be a flat correction and would be labelled minuette wave (y). Minuette wave (y) would most likely end about the same level as minutte wave (w) at 2,798.11, so that the whole structure takes up time and moves price sideways.
For all of these structural ideas minute wave iv may continue overall sideways for a few more sessions.
Minute wave iv may not move into minute wave i price territory below 2,791.47.
SECOND HOURLY CHART
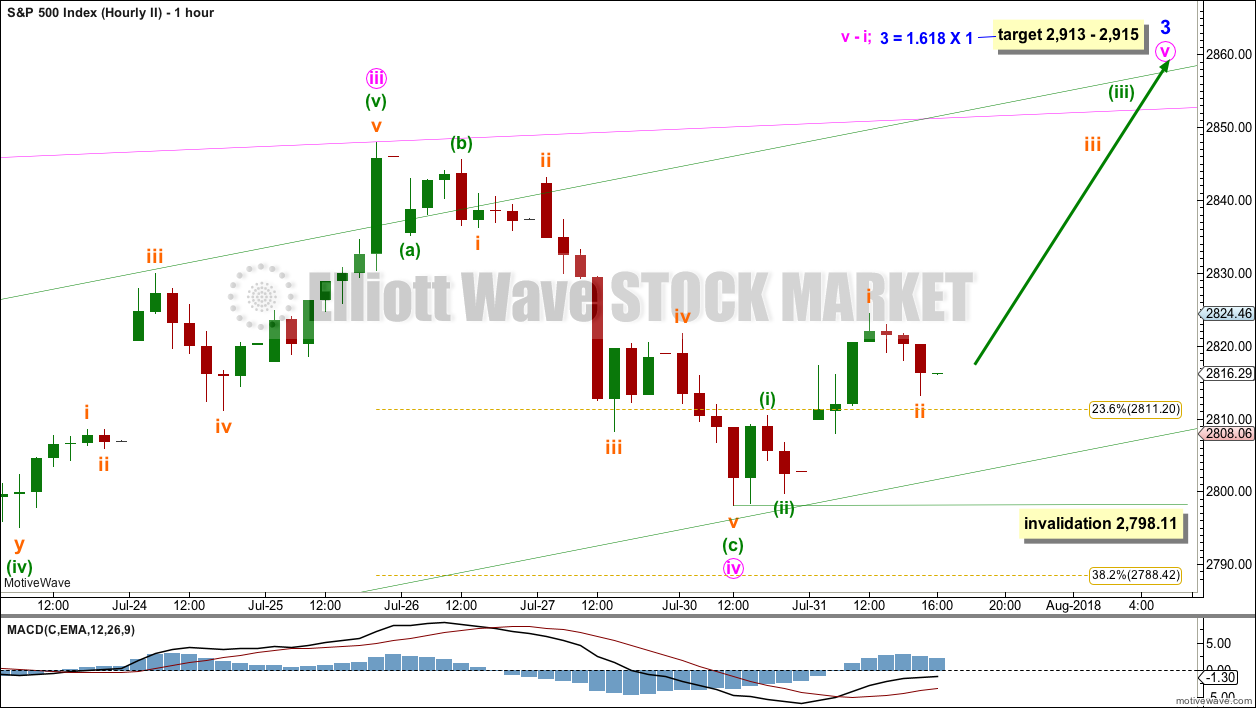
It is also possible that minute wave iv was over at yesterday’s low as a single zigzag.
However, it would be very brief and so disproportionate to minute wave ii. Minute wave ii lasted 11 sessions. Minute wave iv would have lasted only 3 sessions.
There would be no alternation in structure as both minute waves ii and iv would be zigzags. Alternation is a guideline, not a rule, and alternation in structure does not always occur.
There would be excellent alternation in depth: minute wave ii was very deep and minute wave iv would be very shallow.
Within minute wave v, no second wave correction may move beyond the start of its first wave below 2,798.11.
If price makes a new high above 2,848.03 and meets one or more of the following conditions, then this would be the main wave count:
– support from volume
– a new high from On Balance Volume
– a new high from the AD line
ALTERNATE HOURLY CHART
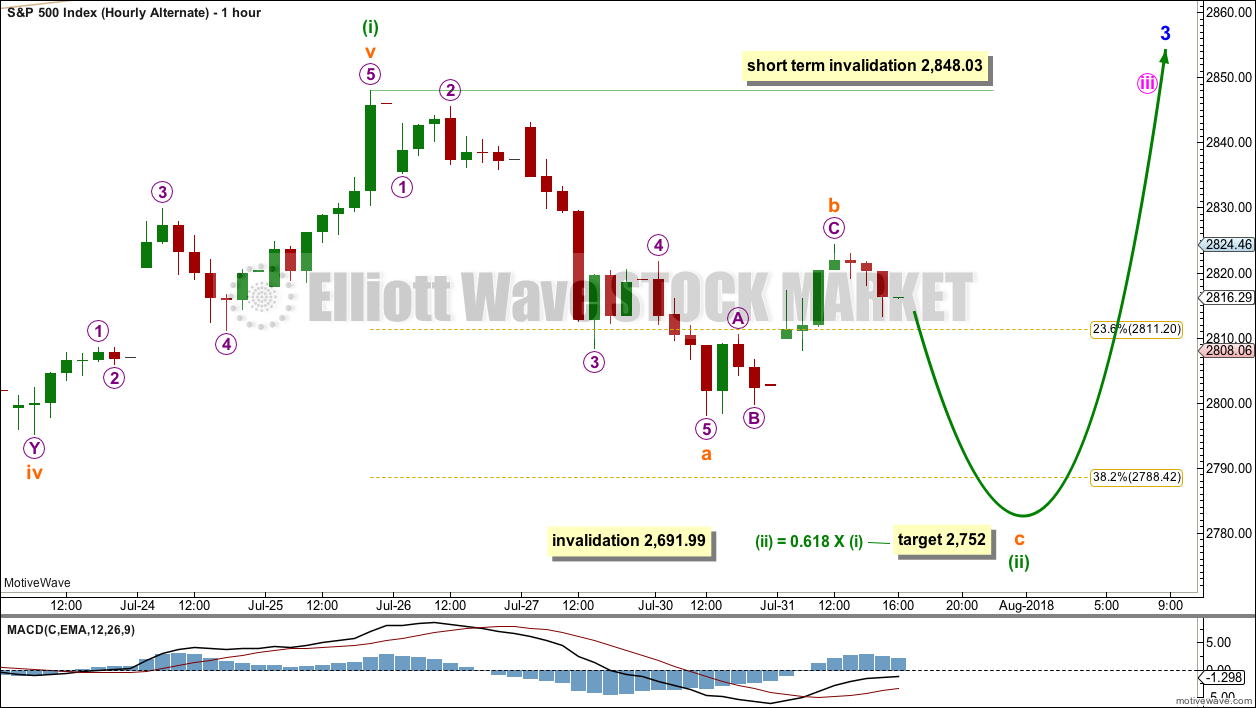
This alternate hourly wave count is the same as yesterday.
This alternate wave count moves the degree of labelling within minute wave iii all down one degree.
If minuette wave (i) was over at the last high, then downwards movement of the last two sessions may be the start of minuette wave (ii). A target for minuette wave (ii) would reasonably be the 0.618 Fibonacci ratio of minuette wave (i) about 2,752. However, if this target is wrong, it may be a little too low. There may be support just above this point at the lower edge of the best fit channel, which is seen on the daily chart.
Minuette wave (ii) may not move beyond the start of minuette wave (i) below 2,691.99.
TECHNICAL ANALYSIS
WEEKLY CHART
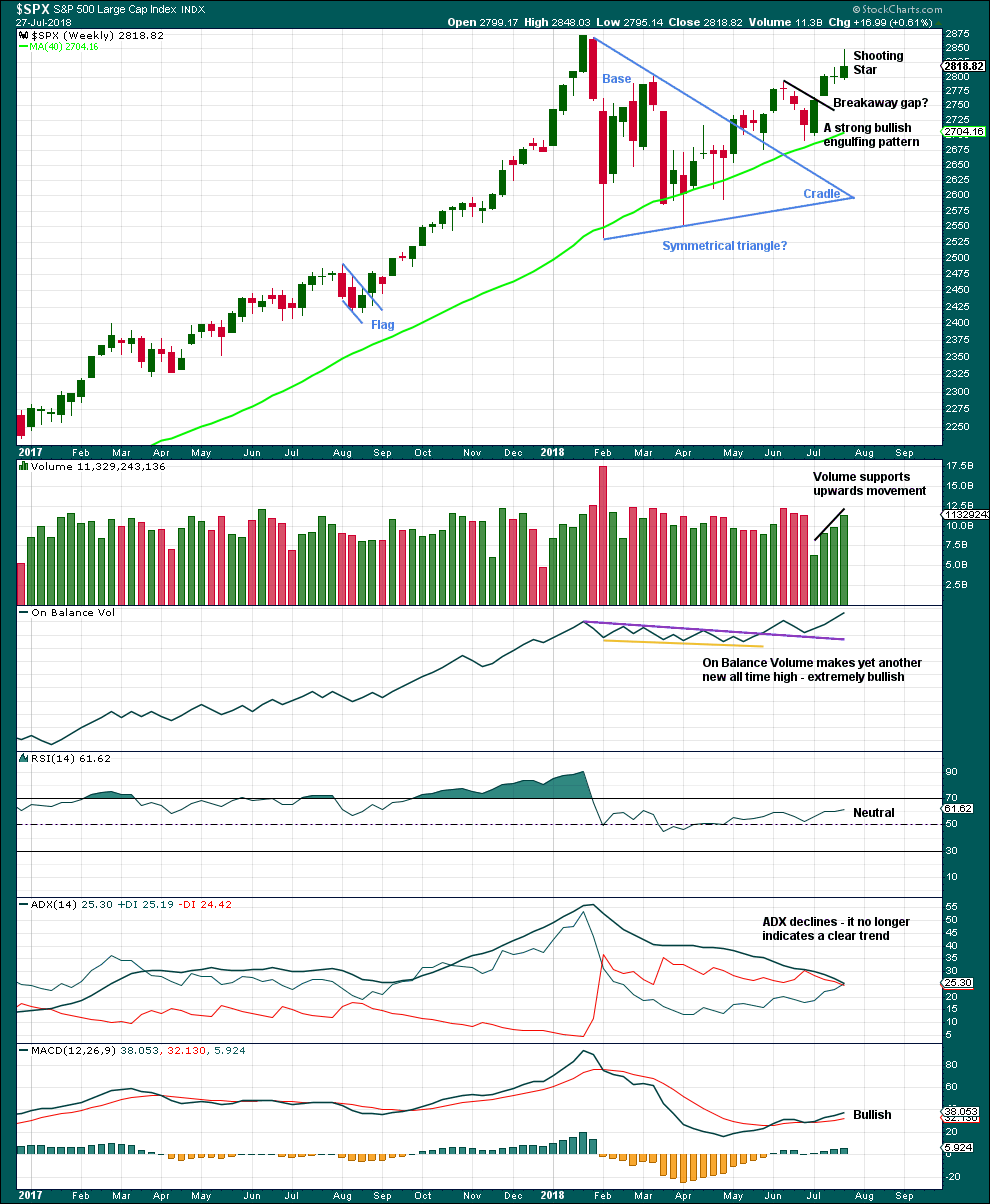
Click chart to enlarge. Chart courtesy of StockCharts.com.
Recent new highs for On Balance Volume remains very bullish indeed, but that does not preclude another reasonable pullback within this developing upwards trend. It is still expected that price is very likely to make new all time highs, but it will not move in a straight line.
A Doji candlestick followed now by a Shooting Star, which did not gap higher, is reasonably bearish for the short term. A pullback or small consolidation may result.
Bullish volume and another new all time high from On Balance Volume are very strong bullish signals.
DAILY CHART
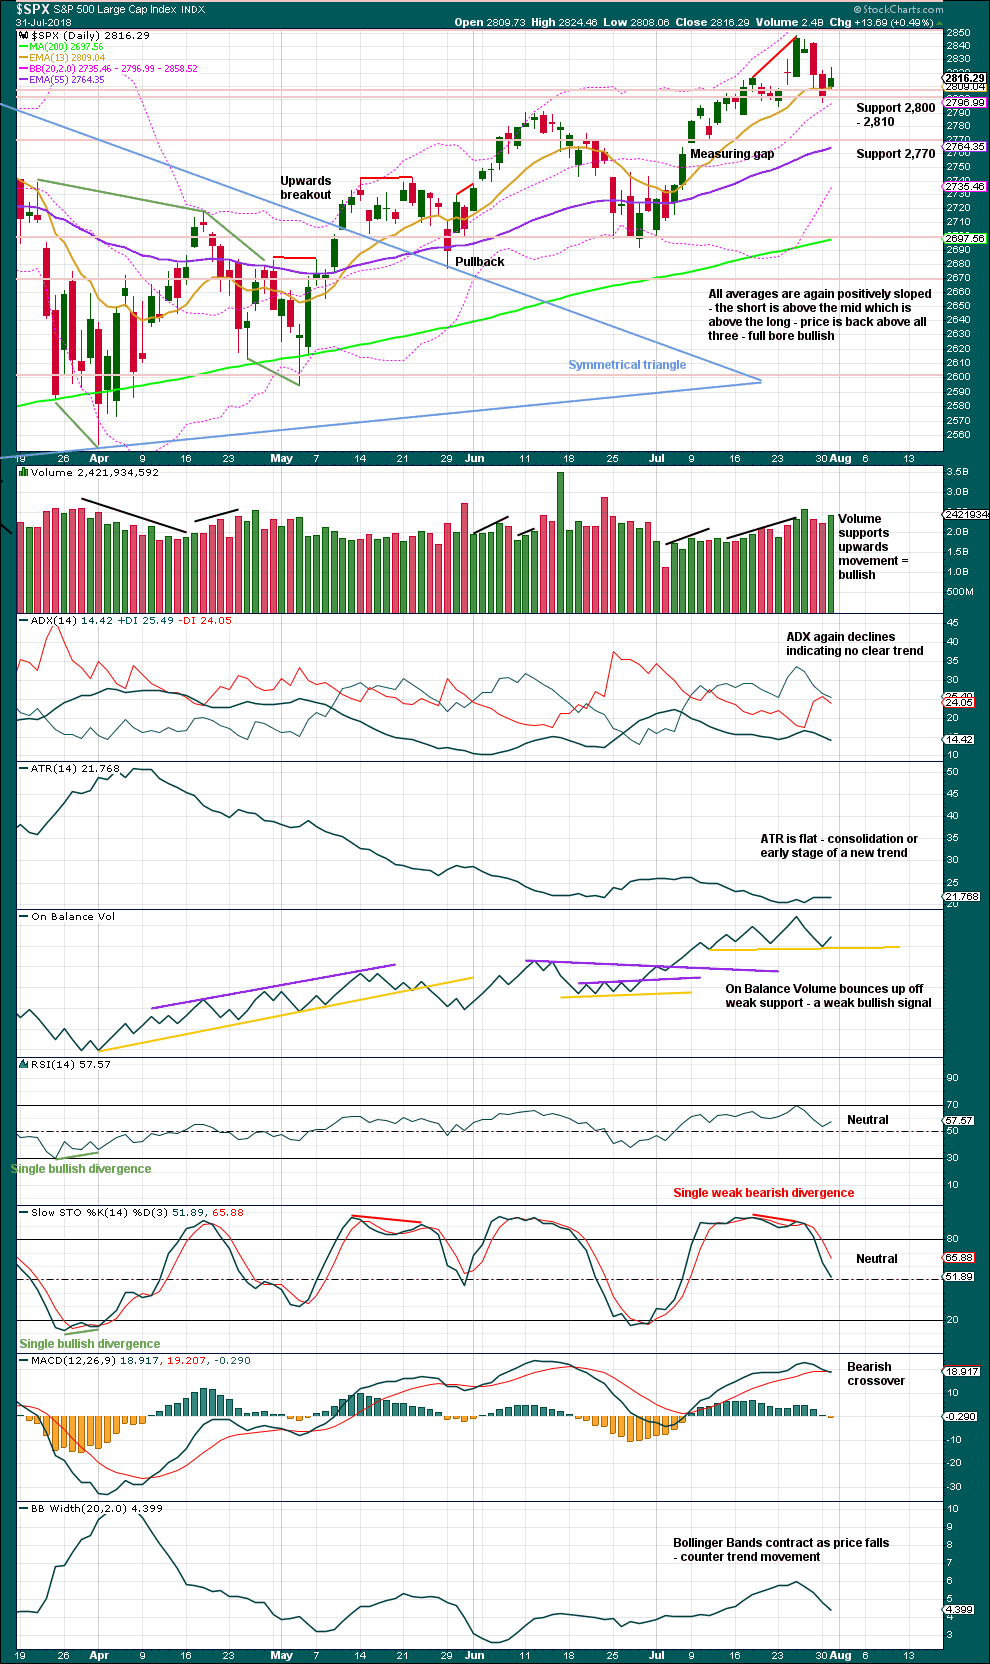
Click chart to enlarge. Chart courtesy of StockCharts.com.
The symmetrical triangle may now be complete. The base distance is 340.18. Added to the breakout point of 2,704.54 this gives a target at 3,044.72. This is above the Elliott wave target at 2,922, so the Elliott wave target may be inadequate.
Since the low on the 2nd of April, 2018, price has made a series of higher highs and higher lows. This is the definition of an upwards trend. But trends do not move in perfectly straight lines; there are pullbacks and bounces along the way.
Stochastics may remain overbought for reasonable periods of time when this market has a strong bull run.
This bull run now has some support from volume and strong support from On Balance Volume making new all time highs.
There is some strength to today’s upwards movement. It has good support from volume, but the candlestick has a slightly longer upper wick. Support about 2,800 remains strong.
The support line for On Balance Volume is redrawn; it was not showing where support and resistance were. A bounce up here is a weak signal because the line has only 2-3 anchor points.
This small consolidation has bought RSI down from almost overbought and Stochastics down from overbought. While there is room for price to fall further, there is also room again for the next upwards wave to develop here.
VOLATILITY – INVERTED VIX CHART
WEEKLY CHART
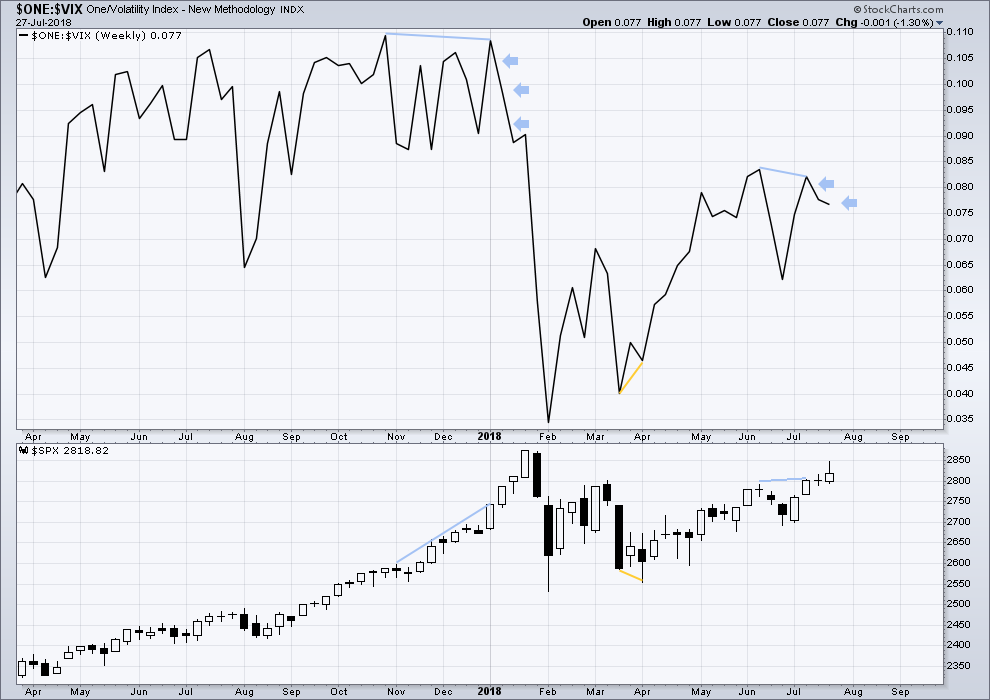
Click chart to enlarge. Chart courtesy of StockCharts.com. So that colour blind members are included, bearish signals
will be noted with blue and bullish signals with yellow.
To keep an eye on the all time high for inverted VIX a weekly chart is required at this time.
Notice how inverted VIX has very strong bearish signals four weeks in a row just before the start of the last large fall in price. At the weekly chart level, this indicator may be useful again in warning of the end of primary wave 3.
There is bearish divergence at this time between swing highs of inverted VIX and price, and now two weeks in a row of upwards movement from price and downwards movement from inverted VIX. This is now a reasonable warning of a possible pullback or consolidation, but it is not as strong a warning as that back in January. The last two weeks of upwards movement in price is not particularly strong (completing a Doji and a Shooting Star, not strong upwards candlesticks), so this divergence is not as significant.
DAILY CHART
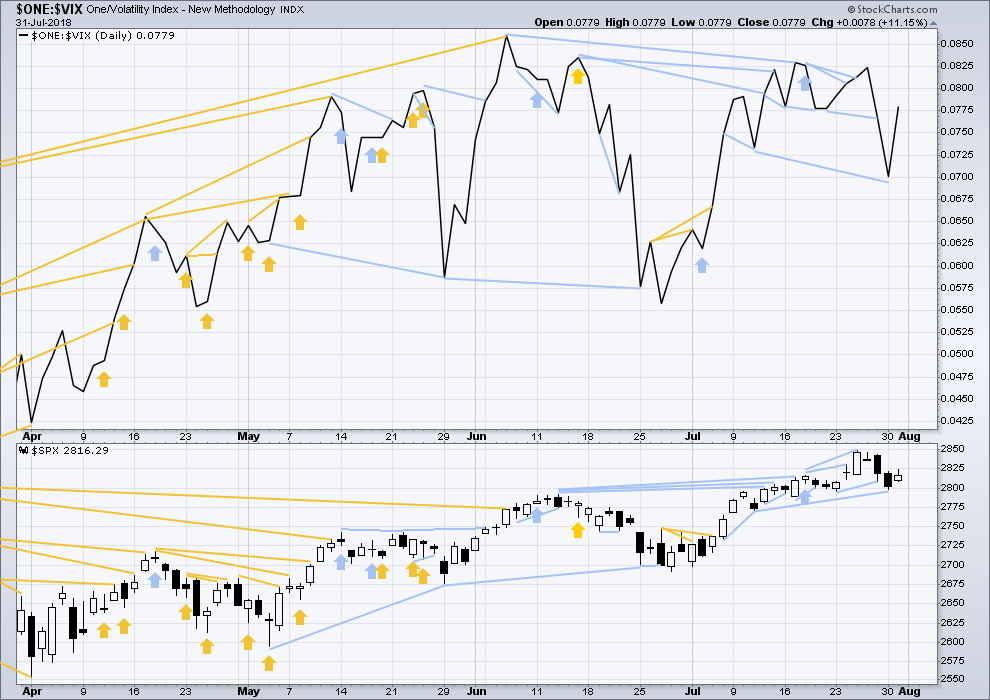
Click chart to enlarge. Chart courtesy of StockCharts.com. So that colour blind members are included, bearish signals
will be noted with blue and bullish signals with yellow.
Normally, volatility should decline as price moves higher and increase as price moves lower. This means that normally inverted VIX should move in the same direction as price.
Last noted mid term bearish divergence has not been followed yet by more downwards movement. It may still indicate downwards movement ahead as there is now a cluster of bearish signals from inverted VIX.
BREADTH – AD LINE
WEEKLY CHART
Click chart to enlarge. Chart courtesy of StockCharts.com.
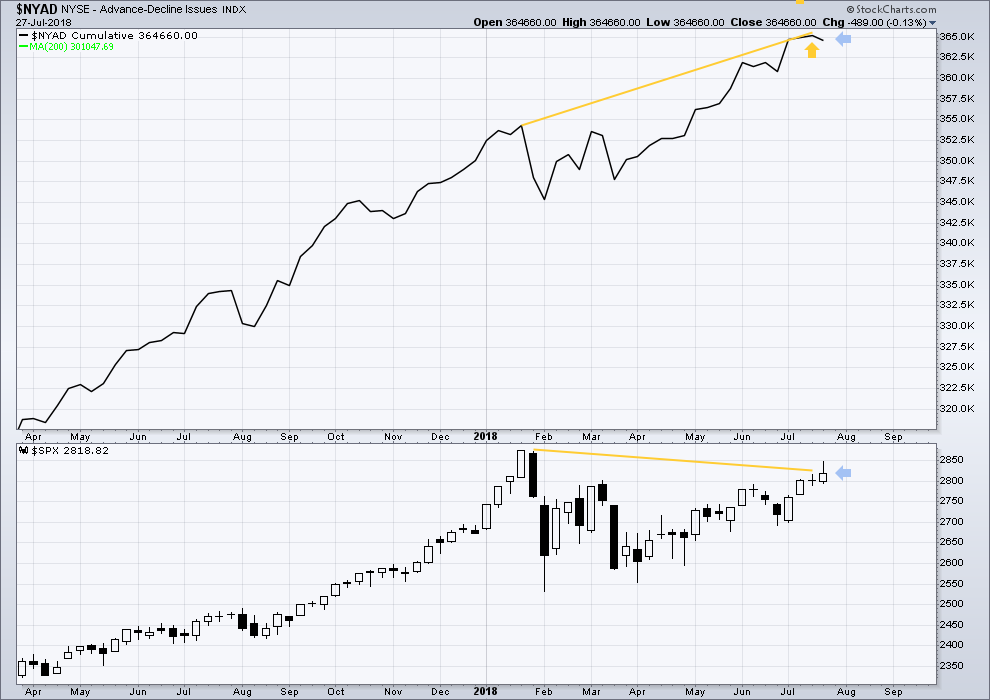
When primary wave 3 comes to an end, it may be valuable to watch the AD line at the weekly time frame as well as the daily.
At this stage, there is very strong bullish divergence between price and the AD line at the weekly time frame. With the AD line making new all time highs, expect price to follow through with new all time highs in coming weeks.
Price moved higher last week, but the AD line moved lower. This single week divergence is bearish for the short term.
DAILY CHART
Click chart to enlarge. Chart courtesy of StockCharts.com.
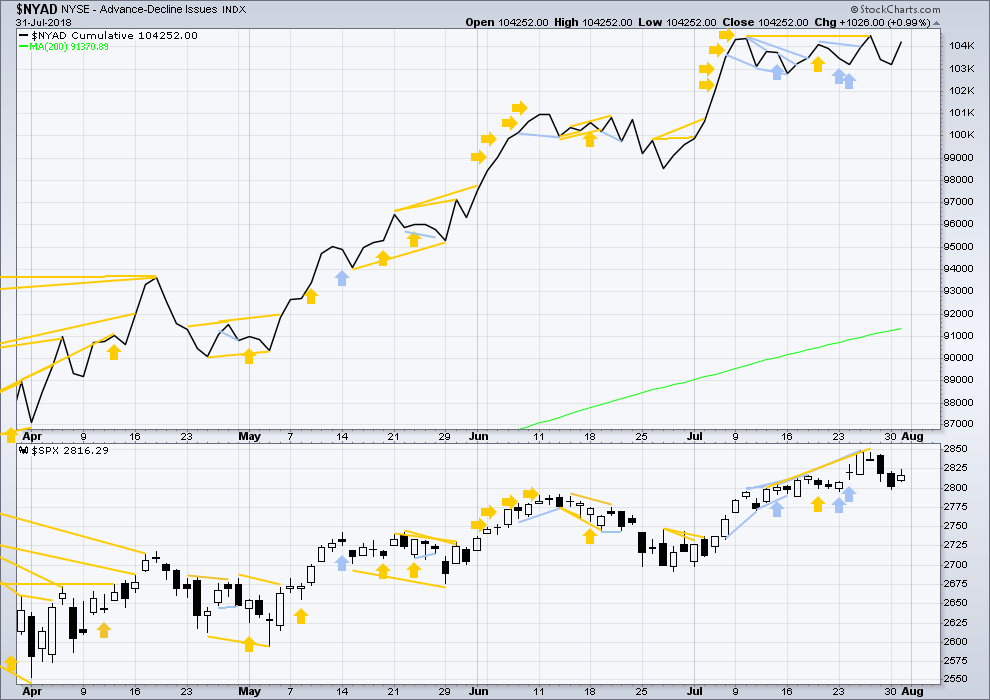
There is normally 4-6 months divergence between price and market breadth prior to a full fledged bear market. This has been so for all major bear markets within the last 90 odd years. With no longer term divergence yet at this point, any decline in price should be expected to be a pullback within an ongoing bull market and not necessarily the start of a bear market. New all time highs from the AD line means that any bear market may now be an absolute minimum of 4 months away. It may of course be a lot longer than that. My next expectation for the end of this bull market may now be October 2019.
Breadth should be read as a leading indicator.
Upwards movement today has good support from rising market breadth. There is no new divergence here between price and the AD line, and the last signal from the AD line was very bullish, with another new all time high last Thursday.
Small caps have made another slight new all time on Friday. Mid caps made a new all time high on the 10th of July. Only large caps have to follow through; they do usually lag in the latter stages of a bull market.
DOW THEORY
The following lows need to be exceeded for Dow Theory to confirm the end of the bull market and a change to a bear market:
DJIA: 23,360.29.
DJT: 9,806.79.
S&P500: 2,532.69.
Nasdaq: 6,630.67.
Only Nasdaq at this stage is making new all time highs, with another new all time high on Friday of last week. DJIA and DJT need to make new all time highs for the ongoing bull market to be confirmed.
Charts showing each prior major swing low used for Dow Theory may be seen at the end of this analysis here.
Published @ 08:40 p.m. EST.

Gold at long term trendline. I expect them to smash it below…just for you-know-what and giggles…. 🙂
hourly chart updated:
if minute iv is a triangle, then minuette (b) is most likely incomplete. it would be too shallow at today’s high
I think we could see a deeper pullback in tech. Layering into Triple Q 176 strike puts for August 17. Target 166.00 or thereabouts…
First batch for 1.94.
hard to see how a retest of 2800 isn’t going to be required here…at least. 2789-91 quite possible. All tomorrow.
Yep!
2791 is the very important pivot. Kevin, again I’m impressed with your analysis and comments. Good on ya!
Hi Verne, what are you doing with your GDX call options here… looks like it’s going down further. There seems to be no end to the gold/silver downward spiral…
I rolled em out and added to my position with November expiration. We are getting close to capitulation I think. I expect a final brutal downside slam. Look for a reversal hammer the next few days. 🙂
GORO down huge today on earnings report!
Miners bottoming in capitulation sales methinks!
Looking for a move below this morning’s low with a sharp reversal into the close for the all- clear…
Ringing the register on CAKE Aug 17 50 puts for a nice triple, one of Bryan’s (along with NFLX) favorites. We believe that there are a number of other names that are going to see massive gaps down as tech unravels….
It seems market waiting for Fed at 2PM ET… Why for this meeting? I have no idea!
Should be a well known boring release.
Is anyone else getting option trades filled in a bunch of different batches?
That is not a good sign. It shows how poor liquidity has become and/or market maker risk aversion to filling large orders.
I only have 1/4 long SPY position but I think I am going to hedge with a few SPY puts expiring this Friday in case we get a knee-jerk reaction to FEDSPEAK.
Buying Friday’s 280 strike puts for 0.70….
That could be a bull flag in VIX….
Verne,
With AAPL earning, majority folks are perhaps looking for a BULL run post fed meeting. I suspect Mr. market might not want to comply with their wishes for ramp higher. Month of August has been brutal for markets and this one might shake a few investors out of their comfort zones JMHO.
I think you’re onto something there!
I was thinking the Apple Euphoria would last a day or two but maybe not! 🙂
It has to obvious to all that the banksters are determined to defend that 2800 pivot. The bears ALWAYS loose protracted battles around contested pivots, and by protracted I mean anything that goes on for more than two or three days. You gotta respect these guys. If you don’t get a move past them with authority it has to be viewed as consolidation ahead of a move higher…just my two rials!
What are THOSE worth these days??!! 🙂
Yikes!! 60K rials to the dollar on Monday.
Back in 1979 it was 70!!!
I’m suspicious that the market rips higher on the fed minutes.
We are probably going to get a big move. Not certain which direction…..
Exiting Apple 190 calls at 201 target. Not bad for a few days’ work!
Steep divergences on these new highs so a trend change coming up!
I am looking at a few interesting developments here that bear (no pun intended) watching. If we gap past 2800 it’s all bets off….that level has to hold for the bullish case….
Buying August 10 282.50 SPY calls for 0.99. Nice fill!
If we get a new moon high around August 11, those call are gonna pop!
Let’s go lunatics!! 🙂
Once yesterday’s gap is filled and we move just a bit below it that should be it folks…but we will see….
Taking the money and running on VIX 12.50 strike calls.
Spreads are again starting to look awful so you will have to ignore the bid if you are trying to sell calls.
Looks like they are expecting some more trouble.
The bears have already lost the 2800 SPX pivot battle, they just don’t know it yet. Look for them to make another attempt and perhaps even drive price briefly beneath the pivot but we should be heading higher shortly, perhaps as high as 2875 the next week. I am looking for a new moon high for you lunatic fans, and then the next correction down SHOULD cleanly take out 2800 pivot on the first wave down to let us know we have the real deal. A few carefully selected SPY 280 strike calls could easily return a five bagger, and possibly even a ten, the next week or two…assuming those expectations are correct! 🙂
COST looks very toppy to me. I’ve taken a short there.
Same with M. Way extended in general, turning down off top of channel. Shorting.
Shares? Or Options? 🙂
Looking like a very slow small range day…so far. But isn’t there a Fed meeting? That’ll liven things up a bit in the 2pm hour.
TLT continued it’s sharp movement down today, after a few days sitting just above a 62% retrace. 116 area should be in it’s near future. I took profits and will reload here as it bounces back higher.
XLE and XOM, after being in serious squeezes and appearing like they would break upward…appear to be breaking out downward. I may be putting on an XOM short here at some point.
XLF/finance looking good with the continued rising rates, and that’s bullish for SPX.
It will likely tag 115 before reversal…
Did anyone else take a pre-earnings bite of the Apple? 🙂
Verne,
Wanted to but late afternoon got pulled into another fire so missed it 🙁 . However, holding shorts on SHOP for now and with some market Cooperation, they will get me some change to work the next trade.
no aapl , straddles bidu , grmn ,akam , soda
Nice hit on SODA!!!
You know what they say…”An Apple a day…” hehe! 🙂
Nope, but I just shorted it (not trading advice)
Haha! Right. The folks that got slaughtered in FB and NFLX will be selling Apple to meet margin calls…
Can’t help it, I’m now setting up the intermediate duration trades in my PA. Gotta stop overtrading and I’ve made enough for the year. Shorting SPY and DIA here as well 50% allocation. (Not Trading advice)