The week has begun with a green daily candlestick, but it has a slightly lower low and a lower high than Friday’s session.
Price remains above the short term invalidation point and within the small channel on the hourly chart.
Summary: The bigger picture is that this bull market is ageing, but there is not yet enough technical evidence that it is fully mature. The Elliott wave count is also incomplete.
On Balance Volume and the AD line last week both made new all time highs. This is extremely bullish. Expect upwards movement as very likely this week.
Use the new best fit channel on the daily chart for possible support for any deeper pullbacks. Pullbacks are an opportunity to join the trend.
The next short term target is about 2,878; a consolidation lasting about one to two weeks may be expected at about this target. Following that, another consolidation lasting about two weeks may be expected about 2,915.
The invalidation point may now be moved up to 2,743.26.
The mid to longer term target is at 2,922 (Elliott wave) or 3,045 (classic analysis). Another multi week to multi month correction is expected at one of these targets.
The final target for this bull market to end remains at 3,616.
Always practice good risk management. Always trade with stops and invest only 1-5% of equity on any one trade.
New updates to this analysis are in bold.
The biggest picture, Grand Super Cycle analysis, is here.
Last historic analysis with monthly charts is here, video is here.
ELLIOTT WAVE COUNT
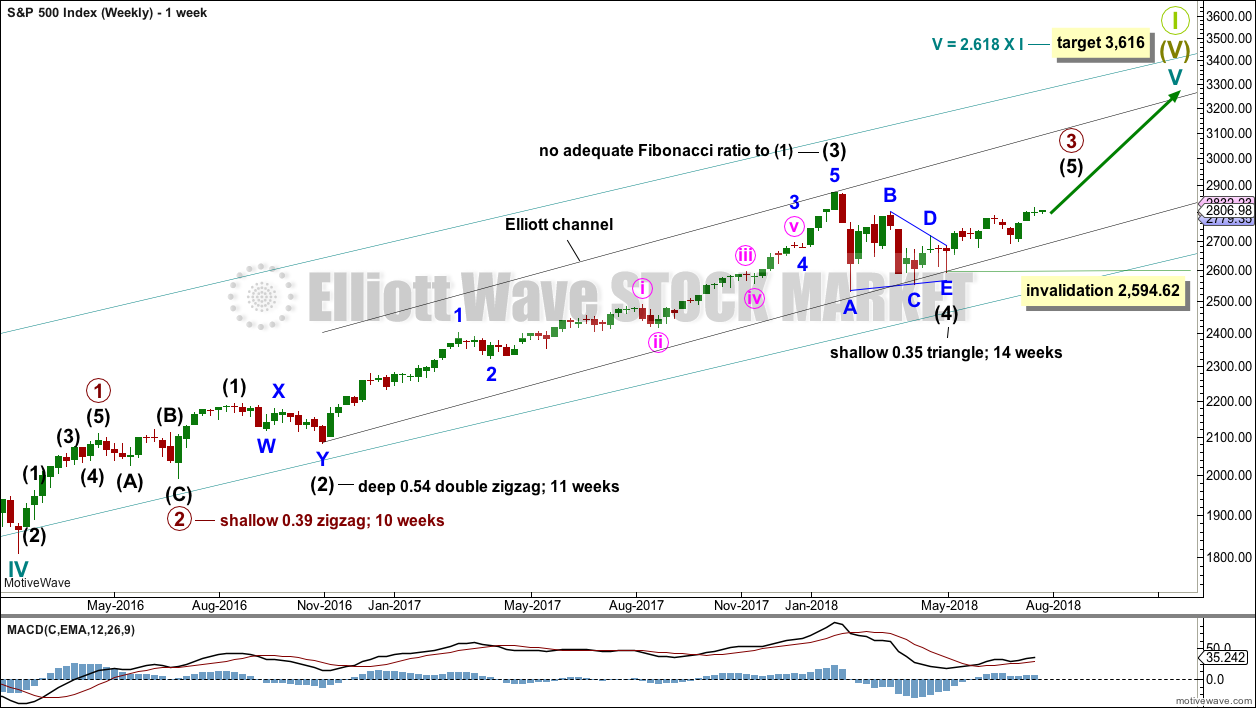
WEEKLY CHART
Cycle wave V must complete as a five structure, which should look clear at the weekly chart level and also now at the monthly chart level. It may only be an impulse or ending diagonal. At this stage, it is clear it is an impulse.
Within cycle wave V, the third waves at all degrees may only subdivide as impulses.
Intermediate wave (4) has breached an Elliott channel drawn using Elliott’s first technique. The channel is redrawn using Elliott’s second technique: the first trend line from the ends of intermediate waves (2) to (4), then a parallel copy on the end of intermediate wave (3). Intermediate wave (5) may end either midway within the channel, or about the upper edge.
Intermediate wave (4) may now be a complete regular contracting triangle lasting fourteen weeks, one longer than a Fibonacci thirteen. There is perfect alternation and excellent proportion between intermediate waves (2) and (4).
Within intermediate wave (5), no second wave correction may move beyond the start of its first wave below 2,594.62. However, the lower edge of the black Elliott channel drawn across the ends of intermediate degree waves should provide very strong support for any deeper pullbacks, holding price well above the invalidation point while intermediate wave (5) unfolds.
At this stage, the expectation is for the final target to me met in October 2019.
A multi week to multi month consolidation for primary wave 4 is expected on the way up to the final target.
The last bullish fifth wave of minor wave 5 to end intermediate wave (3) exhibited commodity like behaviour. It was strong and sustained. It is possible that the upcoming wave of minor wave 5 to end intermediate wave (5) to end primary wave 3 may exhibit similar behaviour, so we should be on the lookout for this possibility.
DAILY CHART
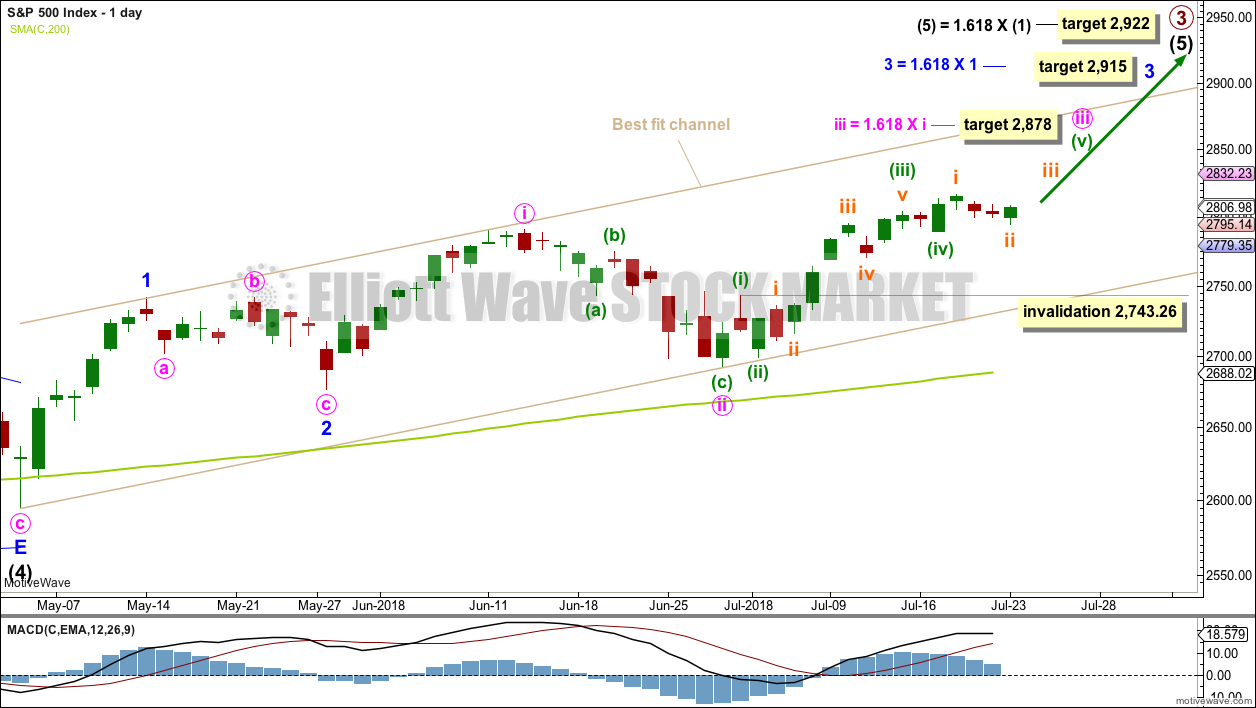
Intermediate wave (5) would be very likely to make at least a slight new high above the end of intermediate wave (3) at 2,872.87 to avoid a truncation.
Intermediate wave (3) exhibits no Fibonacci ratio to intermediate wave (1). It is more likely then that intermediate wave (5) may exhibit a Fibonacci ratio to either of intermediate waves (1) or (3). The most common Fibonacci ratio would be equality in length with intermediate wave (1), but in this instance that would expect a truncation. The next common Fibonacci ratio is used to calculate a target for intermediate wave (5) to end.
A target is now calculated for minute wave iii to end, which expects to see the most common Fibonacci ratio to minute wave i. Minute wave iii may last a few weeks. When it is complete, then minute wave iv may last about one to two weeks in order for it to exhibit reasonable proportion to minute wave ii. Minute wave iv must remain above minute wave i price territory.
Minute wave iii may have passed its middle strongest portion. Although the structure could possibly be seen as complete at last week’s high, it has still not moved far enough above the end of minute wave i yet to allow room for minute wave iv to unfold and remain above minute wave i price territory. For that to happen it looks like minuette wave (v) may be a relatively long extension, so that minute wave iii moves higher.
A target is calculated for minor wave 3 to end, which expects to see the most common Fibonacci ratio to minor wave 1. Minor wave 3 may last several weeks in total and should look like an impulse at the daily chart level. When it is complete, then minor wave 4 may last about one to two weeks in order for it to exhibit reasonable proportion to minor wave 2. Minor wave 4 must remain above minor wave 1 price territory.
Within minute wave iii, minuette wave (i) is complete as labelled. Minuette wave (iv), if it continues lower, may not move into minuette wave (i) price territory below 2,743.26. With the AD line today moving lower, it is possible that minuette wave (iv) could continue tomorrow. A new hourly alternate wave count looks at this possibility.
A best fit channel is added in taupe to this chart. It contains all of intermediate wave (5) so far. The lower edge may provide support for any deeper pullbacks. The upper edge may provide resistance.
HOURLY CHART
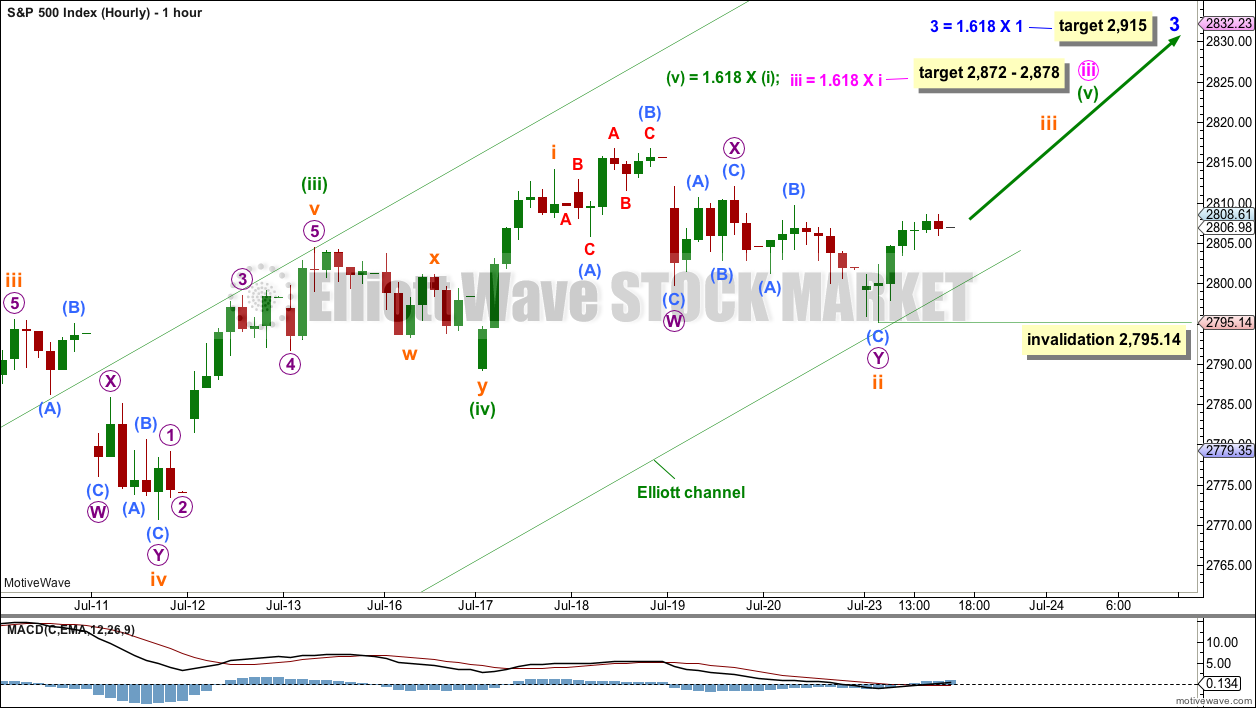
The target for minute wave iii to end is now widened to a rather large 6 point zone, now calculated at two degrees. Favour the lower edge of the target zone as it is calculated at a lower degree.
When subminuette waves i, ii, iii and iv within minuette wave (v) are complete, then the target may be calculated at a third degree. At that stage, it may be refined to a smaller range.
The target for minute wave iii to end would see it move far enough above the end of minute wave i to allow room for minute wave iv to unfold and remain above minute wave i price territory.
Minuette wave (v) may end about the upper edge of the green Elliott channel. If it behaves like a commodity, then it is possible it could overshoot the upper edge of the channel.
Within minuette wave (v), subminuette wave ii may not move beyond the start subminuette wave i below 2,789.24.
Subminuette wave ii now fits as a double combination: expanded flat – X – zigzag. It should now be over at today’s low. Within subminuette wave iii, no second wave correction may move beyond the start of its first wave below 2,795.14.
This wave count so far still fits with MACD: the strongest middle portion as the third wave within a third wave has the strongest momentum.
ALTERNATE HOURLY CHART
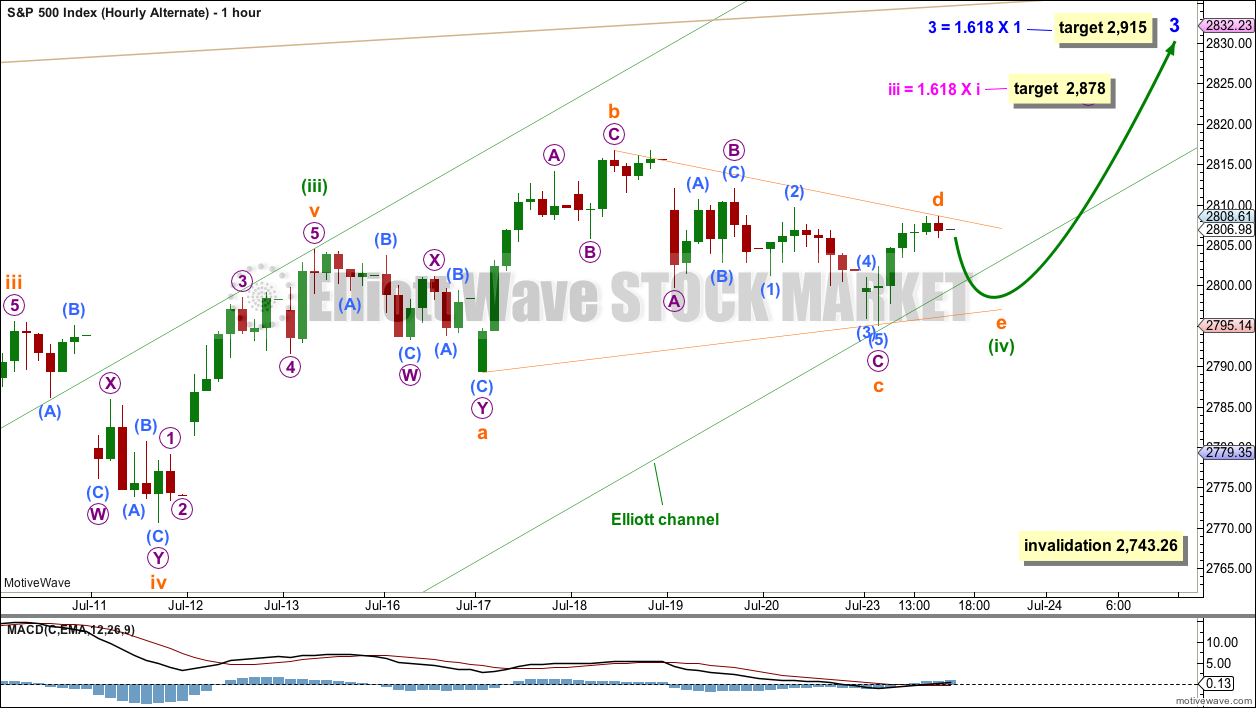
It is possible that minuette wave (iv) is not over and may continue sideways or lower this week.
Minuette wave (iv) may be any one of a triangle, flat or combination. At this stage, a triangle has a better look as one possible structure. If minuette wave (iv) continues further tomorrow, then it may overshoot the green Elliott channel. Fourth waves are not always contained within channels. If it overshoots the channel, then the channel must be redrawn using Elliott’s second technique: the first trend line from the ends of 2 to 4, then a parallel copy on the end of 3.
If minuette wave (iv) does continue as a triangle, then within the triangle subminuette wave e should be a single zigzag and may not move beyond the end of subminuette wave c below 2,795.14. Subminuette wave e would be most likely to fall short of the a-c trend line.
Minuette wave (iv) may not move into minuette wave (i) price territory below 2,743.27. This invalidation point allows for other structural possibilities to unfold for minuette wave (iv) in the next couple of days.
TECHNICAL ANALYSIS
WEEKLY CHART
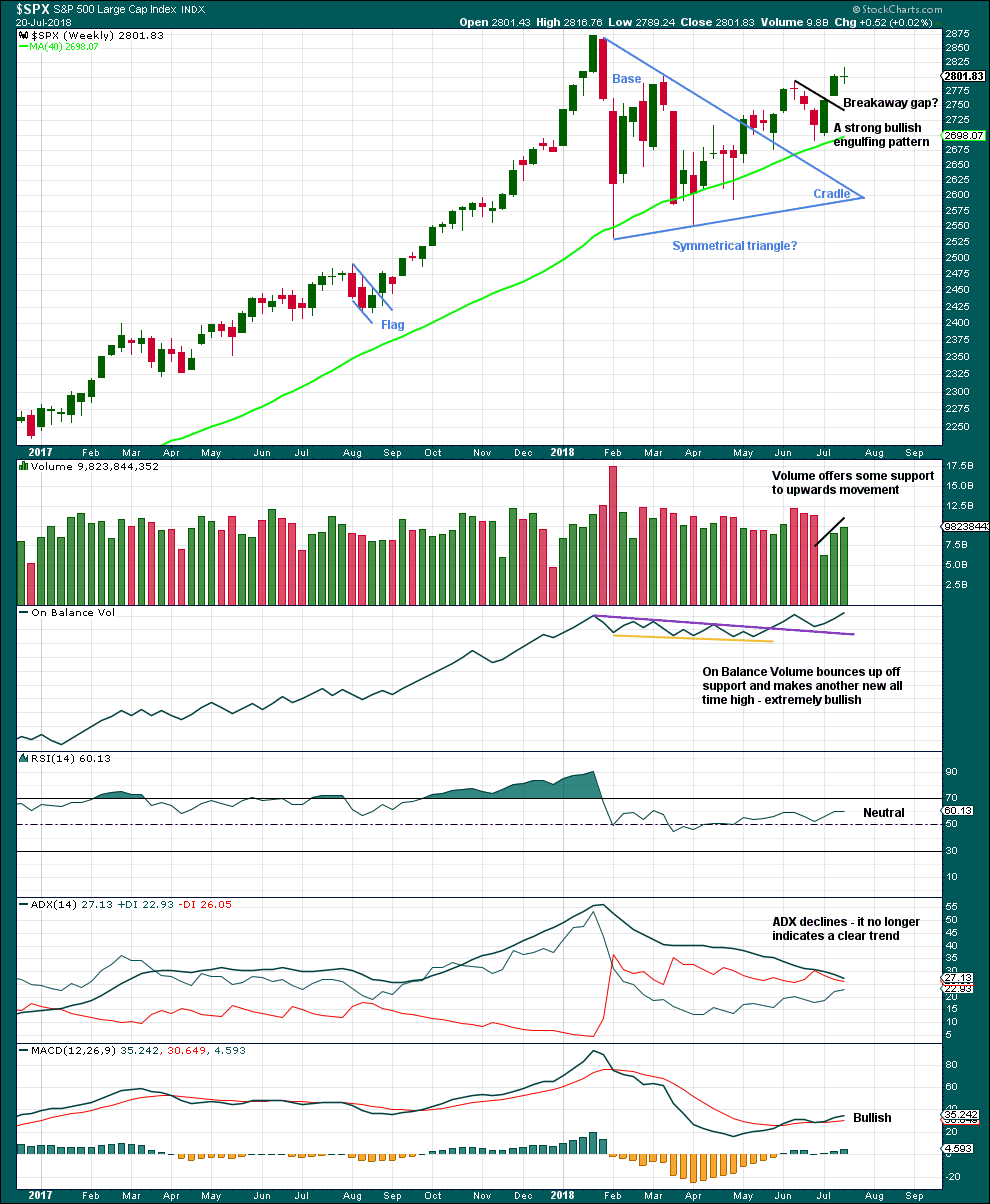
Click chart to enlarge. Chart courtesy of StockCharts.com.
Much weight will be given in this analysis to the new all time high from On Balance Volume. Price usually follows where On Balance Volume leads. It is very reasonable here to expect a new all time high from price in coming weeks.
With volume also supporting another upwards week, this chart is very bullish.
The doji candlestick this week on its own is not a reversal signal. Doji represent a pause and can occur within a trend. There are a few examples in the prior bull run of doji on the weekly chart which were followed by more upwards movement and no reasonable pullback.
DAILY CHART
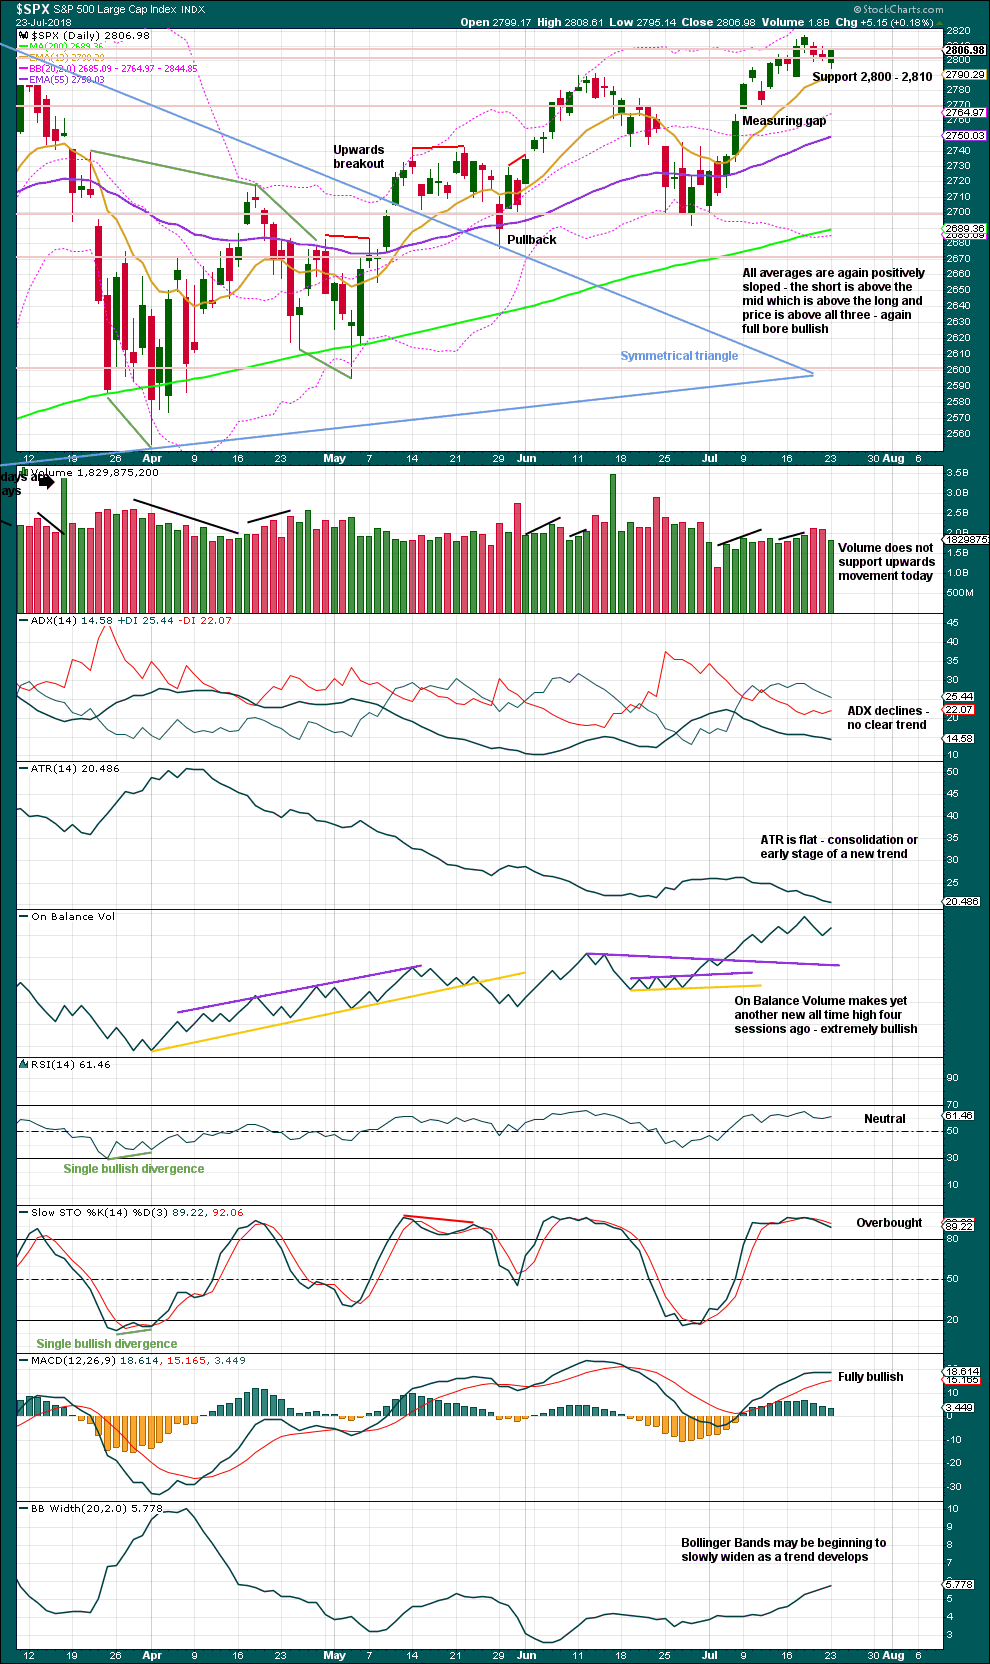
Click chart to enlarge. Chart courtesy of StockCharts.com.
The symmetrical triangle may now be complete. The base distance is 340.18. Added to the breakout point of 2,704.54 this gives a target at 3,044.72. This is above the Elliott wave target at 2,922, so the Elliott wave target may be inadequate.
Since the low on the 2nd of April, 2018, price has made a series of higher highs and higher lows. This is the definition of an upwards trend. But trends do not move in perfectly straight lines; there are pullbacks and bounces along the way. A higher high last week adds some confidence to this trend.
The measuring gap gives a short term target at 2,838. The gap has offered support. It remains open, and the target remains valid.
There is room still for price to continue higher: On Balance Volume remains extremely bullish, and RSI is not yet overbought.
Stochastics may remain overbought for long periods of time when this market has a strong bullish trend. Only when it reaches overbought and then exhibits clear divergence with price, then it may be useful as an indicator of a possible high in place. That is not the case yet.
Lighter volume for this last session, which has a balance of volume upwards, is of very little concern in current market conditions. Rising price on low ATR with light and declining volume was a feature of the last bull run up to January 2018, and it may again be a returning feature of this market.
Monday’s candlestick is fairly bullish, with a slightly long lower wick and a close very close to highs for the session.
VOLATILITY – INVERTED VIX CHART
WEEKLY CHART
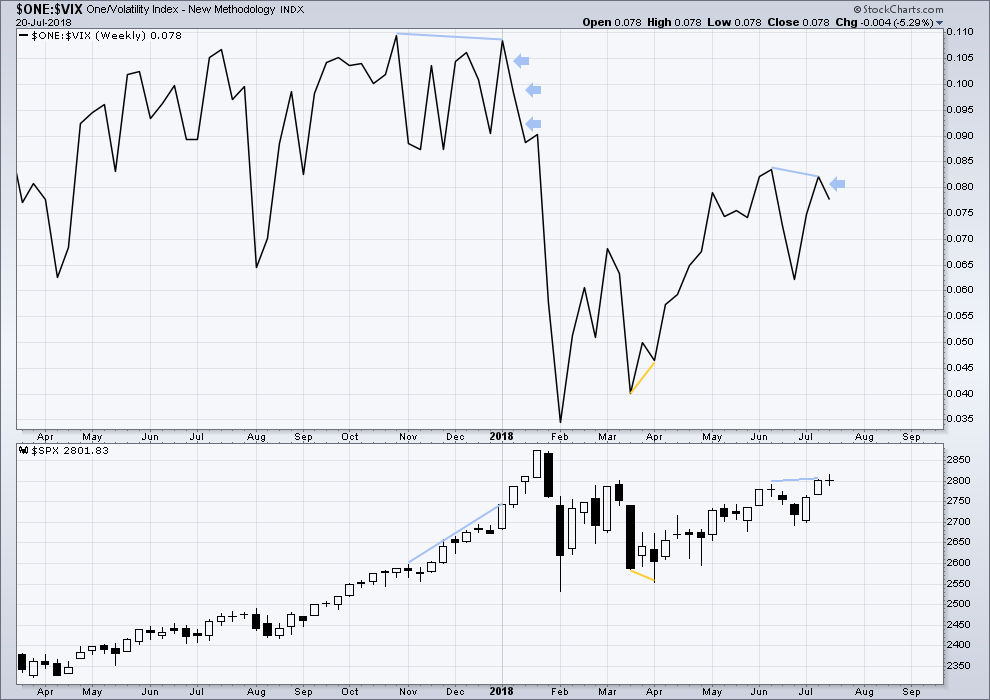
Click chart to enlarge. Chart courtesy of StockCharts.com. So that colour blind members are included, bearish signals
will be noted with blue and bullish signals with yellow.
To keep an eye on the all time high for inverted VIX a weekly chart is required at this time.
Notice how inverted VIX has very strong bearish signals four weeks in a row just before the start of the last large fall in price. At the weekly chart level, this indicator may be useful again in warning of the end of primary wave 3.
Price moved higher last week, but inverted VIX moved lower. This divergence is bearish. A single week of this bearish divergence is not a very loud warning though.
DAILY CHART
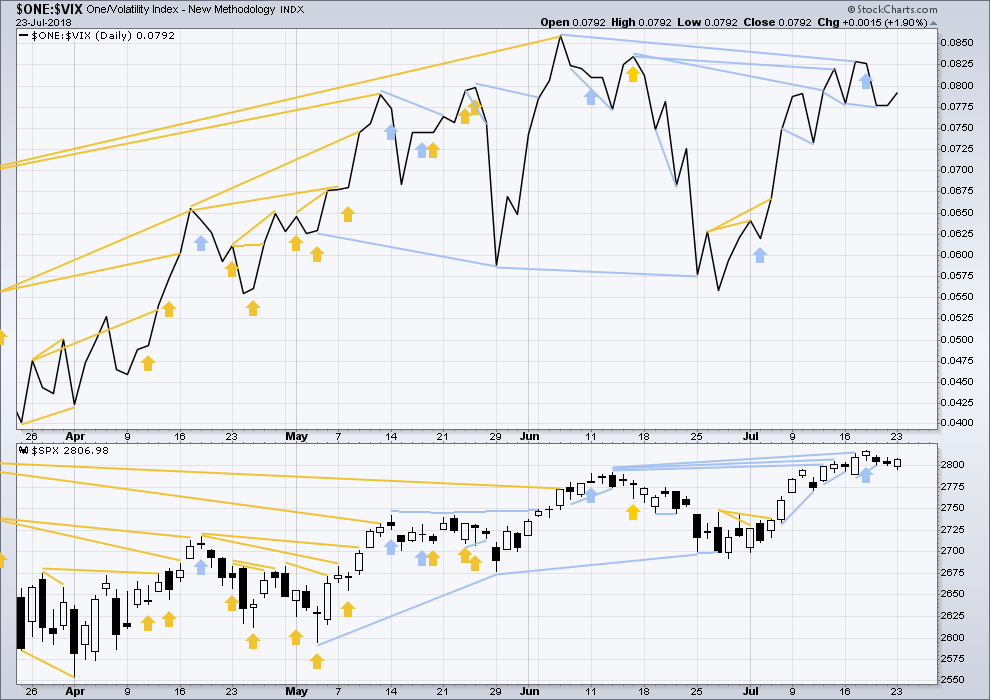
Click chart to enlarge. Chart courtesy of StockCharts.com. So that colour blind members are included, bearish signals
will be noted with blue and bullish signals with yellow.
Normally, volatility should decline as price moves higher and increase as price moves lower. This means that normally inverted VIX should move in the same direction as price.
Monday’s session moved price lower, but the candlestick was green and the balance of volume was upwards. Upwards movement within the session has support from rising inverted VIX and declining market volatility.
BREADTH – AD LINE
WEEKLY CHART
Click chart to enlarge. Chart courtesy of StockCharts.com.
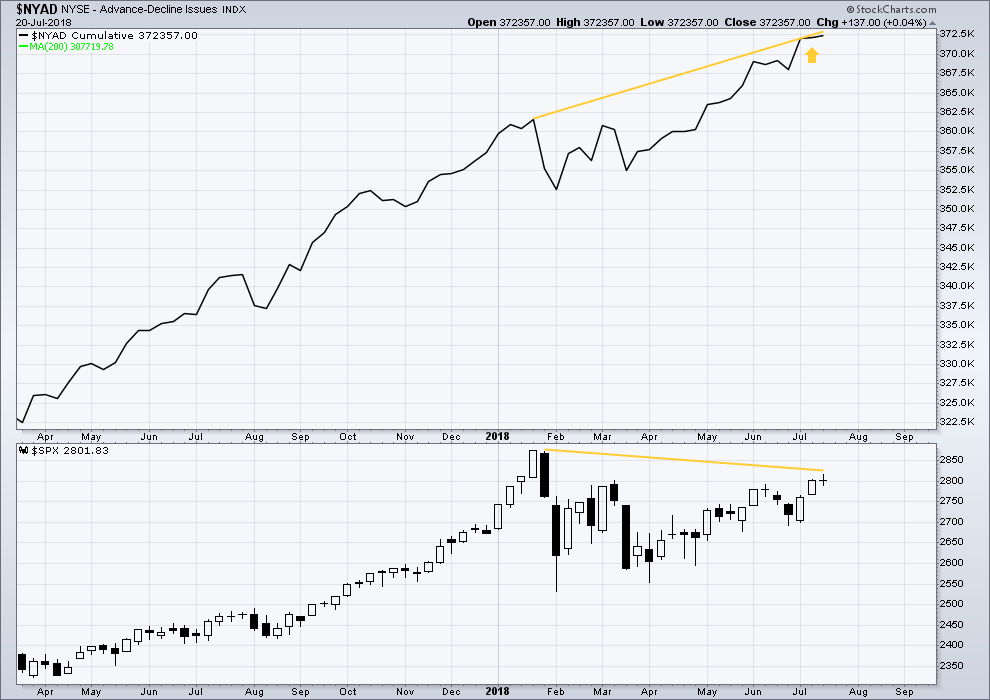
When primary wave 3 comes to an end, it may be valuable to watch the AD line at the weekly time frame as well as the daily.
At this stage, there is very strong bullish divergence between price and the AD line at the weekly time frame. With the AD line making new all time highs, expect price to follow through with new all time highs in coming weeks.
Yet another new all time high last week from the AD line is again extremely bullish.
DAILY CHART
Click chart to enlarge. Chart courtesy of StockCharts.com.
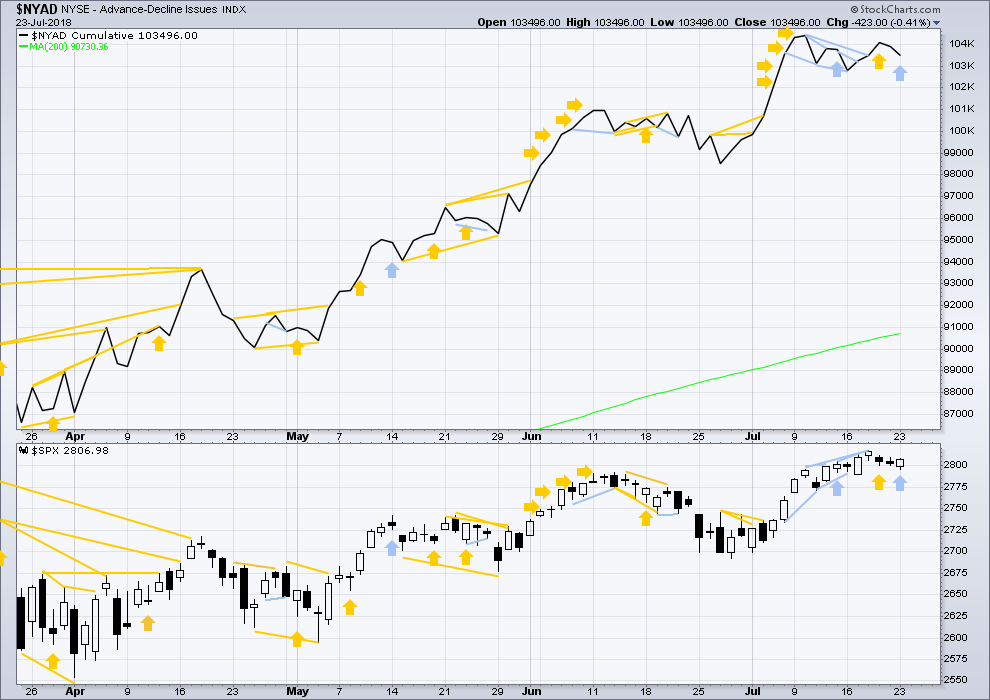
There is normally 4-6 months divergence between price and market breadth prior to a full fledged bear market. This has been so for all major bear markets within the last 90 odd years. With no longer term divergence yet at this point, any decline in price should be expected to be a pullback within an ongoing bull market and not necessarily the start of a bear market. New all time highs from the AD line means that any bear market may now be an absolute minimum of 4 months away. It may of course be a lot longer than that. My next expectation for the end of this bull market may now be October 2019.
Breadth should be read as a leading indicator.
Overall, recent new all time highs from the AD line remain extremely bullish for the longer term trend.
Price may reasonably be expected to follow through in coming weeks.
Monday saw price move lower and the AD line decline. However, the candlestick was green and the balance of volume was upwards. Upwards movement during Monday’s session does not have support from rising market breadth. This divergence is considered bearish, but it is very weak as the direction for Monday is not clear.
Small caps have made another new all time high. Mid caps made a new all time high. Only large caps have to follow through; they do usually lag in the latter stages of a bull market.
DOW THEORY
The following lows need to be exceeded for Dow Theory to confirm the end of the bull market and a change to a bear market:
DJIA: 23,360.29.
DJT: 9,806.79.
S&P500: 2,532.69.
Nasdaq: 6,630.67.
Only Nasdaq at this stage is making new all time highs, with another new all time high on Friday of last week. DJIA and DJT need to make new all time highs for the ongoing bull market to be confirmed.
Charts showing each prior major swing low used for Dow Theory may be seen at the end of this analysis here.
Published @ 07:28 p.m. EST.

main hourly chart updated:
minute iii is still not over.
the long lower wick on the last completed hourly candlestick is bullish, the gap up and away today looks like a breakaway gap and this pullback looks like a back test of support. if it is a breakaway gap then it should remain open and provide support.
XLE and XOM popping up out of their squeezes.
XLF is still in a weekly level squeeze, and came close to it’s downtrend line and the top of the large trading range. Cusp time for XLF here.
NFLX is in one of the great bull runs in market history. And is in a nice multi-week pullback at this very moment. While I will consider taking a clear turn and buy triggers off the 50% fibo at 347, I’d MUCH prefer to see price tag the 61.8% at 329, then trigger me in. That would be an excellent set up.
Anyone thinking minuette (iii) ended on July 18th and was followed by (iv) ending on July 23 and today’s high represented subminuette i of (v).
One of the reasons that it is important to have your own system of market metrics is that it helps you to take responsibility for your trades, and not assign blame to someone else when, and if the market moves against you. Remember EW is only one of several analytical methods, and the advantage of have other ways of trying to gauge what is going on is that every now and then all approaches are going to line up in the same direction, giving you very high probability executions. Contrariwise, it makes you cautious and patient when you see conflicting signals, so reducing your chance of entering a loosing trade. Just my two cents folks. Gotta go. We are looking at some big futures trades and need to crunch some numbers. Have a great rest of the day!
Have fun buddy!
Counter-trend bounce in oil under way. You know what to do…! 🙂
Buying TZA August 3, 8.50 strike calls for 0.30, 200 contracts.
I think these are going to double today…
Keep an eye on VIX, a green print and that’s all she wrote for this wave up.
If anyone is looking for some decent shorts to balance out their risk profile against broader market moves…Iet me suggest LULU. You explain to me why a manufacturer of yoga pants is worth 50% more today than five months ago. Maybe they aren’t. The daily is in a multi-week range and very close to blowing out to the downside (and out of a LONG squeeze), possible igniting a profit taking/stop stampede. Also, now that the market is healthier, money may be starting to rotate back out of these retail “safe” stocks that have been overblown in price. I’m watch COST very close for example for a possible short, same reasons.
Not trading advice. Your returns may vary!!
New highs in Nasdaq coming on some of the steepest negative divergences I have seen in quite some time. Huge reversal in futures. Any correction here could be quite significant. Buying triple Q August 10 176.50 puts for 0.98, one half full load. Will add on fill of open gap.
Looks like RUT leading the way. Classic reversal after thrust. 🙂
Out of remaining calls. Things starting to look like a classic thrust out of a fourth wave triangle…we know what those do!
Exhaustion gap on 5 min?
Are you going off the hourly alternate? You think minuette (v) is over?
Not sure, but the price action to me has been looking like a penultimate wave. A sharp thrust up out of the sideways coil followed by a swift reversal is classic. If correct, we will give back this morning’s gain and get a VIX green print today. RUT has also reversed.
I exited my long trades.
We now have an excellent marker for the end of this wave up and that is of course today’s gap. A fill probably means an interim top. The sneaky banksters are probably going to do it overnight so watch ’em! 🙂
The alternate hourly is toast because there was no e wave down.
Price is moving according to the hourly main, and it’s in a subminuette iii up. It’s got a long way to go (up) before completing. As Lara points out, “there needs to be room for the iv wave”.
A partial fill of the gap would be an excellent buying opportunity IMO.
I agree. I find it unlikely we get a major turn before a new ATH, but we’ll see. The 0.78 Fib for the entire move down was around 2800, which saw resistance but has now been decisively broken. Strength from breadth and OBV bodes well for the bull. There is weakness in small caps today, but that is to be expected going forward and does not preclude a jump to new ATHs.
FB earnings tomorrow PM and AMZN on Thursday could provide more momentum. I read that something like 90% of companies reporting so far have beaten guidance. Of course, we could certainly see the opposite and get a large swing downward, but I’ll defer to Lara’s call–which for the moment is for more upwards movement.
Good luck with that…! 🙂
If you drink California wine you may want to purchase a Geiger counter. Levels of Cesium 137 in grapes are through the roof.
Yep….Fukushima. It is the most important, yet ignored by MSM, story of our lifetime…the seafood is probably far worse so why is no one talking about this?!
That is both correct and incorrect. Yes, levels are “high”, relatively. And the radiation signature says “from Fukushima”. But the incremental radiation is (so I’ve read) less than the background radiation. Not in any way dangerous. At this point. That said…I’m not a fan of nuclear power. A thimbleful of plutonium is what, enough to kill off the entire human race? It is baaaaaad ju ju. And dumping that radiation into the Pacific Ocean is a serious crime. IMO.
I like your addition of ” So I have read…”Any millicurie numbers to put our wine palates at ease perhaps? 🙂
Don’t read MSM propaganda. Of course they are going to get out ahead of the story to keep the wine flowing. No surprise there. Read the scientific literature. PNAS is very digestible for general readers.
http://www.pnas.org/content/112/5/1310
Sorry Verne but that’s simply incorrect information. There is NO radiation risk in CA wines, period.
The extremely low background levels of cesium doubled. From next to nothing to next to nothing. Zero risk. You are going to get 10,000x more radiation in your next dental visit.
Search for “Dating of wines with cesium-137: Fukushima’s imprint” and you’ll find the scientific paper on the actual wine measurements.
Okey-Dokey! Enjoy! 🙂
BTW, ingesting radio nuclides is NOT the same as an X-ray exposure, and is exactly the kind of comparison that would be made by a person without a science background, or someone deliberately trying to mislead an uninformed public. I am done with this.
2x an extremely low background level is still extremely low. This is a level that’s in ALL our food and produce. Suggesting we are going to get “too much” from wine is nonsense.
Your humorous attempt to belittle me is noted. I won’t be so vain or petty as to start pulling out my creds in response though.
Our wines are safe. You have no data except your own opinion that says otherwise. Sorry, but I’m going to stand up for one of my state’s major agricultural products here.
Rodney, have a bottle or two. You won’t glow…except from the alcohol buzz!
Please be more respectful in replies here to members. Let’s keep all our communications here ultra polite.
Thank you.
I am headed to the Pacific coast. Thanks for the heads up. I’ll see if I can get some local info.
Don’t forget about the 0.035mSv of cosmic radiation on a transcontinental flight!
AG bounced off the 62% at 6.29, has polarity inverted to “up”, and broken the sharpest downtrend line.
I’m in. Very very small but just to join in the fun, ya know? Let ‘er rip.
By my count AG is just beginning a wave 3 up on the weekly from it’s Feb low. So it will be Fun… if my count is right.
OK. Time to Ka-Ching on half of calls for nice doubles all around and then some…more to come?
The 1.272 extension proved to be resistance as expected.
The next extension is 1.618 at 2853, and I expect it to provide significant resistance as well, probably “even more” (larger iv off that level perhaps).
Not quite a double on SPY 279.50 calls of straddle but we are unloading half as we are already at zero cost basis. Hard to keep in mind that hedges are for protection, not profit, but we have a master at the helm! 🙂
Ka-CHING!!!!
I am not Ka-Chinging quite yet. I used to leave way too much moolah on the table by not minding Lara’s price targets….come on SPY…keep chugging…! Gimme a 284 will ya? 🙂
Oh I got some new stuff for the next move (and a bunch of old stuff too; can’t cash the spreads, gotta let those mature), and if there’s pullbacks (there will be), I’ll add to my outright calls.
Niiiiiiiiiiice morning for me. over 4x daily profit target in the can.
Nice!
We hedged long calls with a SPY Feb 30 279.50 straddle. The potential for positive return on the straddle meant we could hedge with a somewhat larger % of our long position. The straddle will go well in the money today and we will exit the calls on any move above SPY 283 (when they will more than double) and hold the the hedging puts courtesy of the house.
I think I am seeing a pattern in ES that could result in a very sharp reversal and if that is correct, it looks like it would be around the 2840-2845 area. We do have a full moon this Friday. I will be lightening up calls on any move above 2840. Have a great trading day everyone!
“When the moon’s in the sky
Like a big pzza pie…” 🙂
Verne,
Any thoughts on Bitcoin and Riot targets given the trend reversal this week?
I think Bitcoin is now in a fifth wave up, or will be soon. If so, we are going to new ATH. I am long futures and RIOT calls in my long term account and plan on rolling positions.
/ES 2719 and rising. Glad I loaded up on more SPY calls late in the day.
oops…make that 2819 and rising…what’s a 100 pts between friends.
Set me free why doncha babe…!
Impulse confirmation ( or negation) tomorrow? 🙂
https://m.youtube.com/watch?v=KKQbcJyVKR0
Gotta love that Jamerson Jam!!
LMAO nice one Verne
good tunes
🙂
3am buy cohort remaining, gonna sit on hands for most of the session here.
Yep! They are up to somethin’….
Backing up the truck on VIX, thank you very much!! 🙂
No Choice, adding to UVXY put spread as well.
I keep thinking we are going to wake up one of these days and UVXY is going to be trading for 250K.
I got 0.32 for the UVXY Aug 10 7.50/8.50 vertical put spread…. 🙂
Double on VIX! That was fast!! 🙂
(looks like a premium pop…)
One of the best ever! I saw Diana and the girls with my wife in the late 80’s. Fabulous concert. I am from Chi Town. I gotta love The Supremes. By the way, today is the 42nd wedding anniversary of being wed to my best friend, my lover, and my rock. Thinking about all that kind of makes me have “Reflections”
https://www.youtube.com/watch?v=2uwSVDOWh4Y
OT: The way the premarket futures are behaving, is making me think the hourly and daily momentum gains for a 3rd wave are starting today.
Have a great week.