Upwards movement continues as expected.
The Elliott wave and classic analysis targets remain the same.
Summary: Overall, expect the upwards trend to continue. Some support from volume today and a new all time high again from On Balance Volume on the daily chart support this view.
There remains bearish divergence between price and the AD line though. If my analysis is wrong for the short term, there may be a pullback to last a very few days coming up sooner than expected.
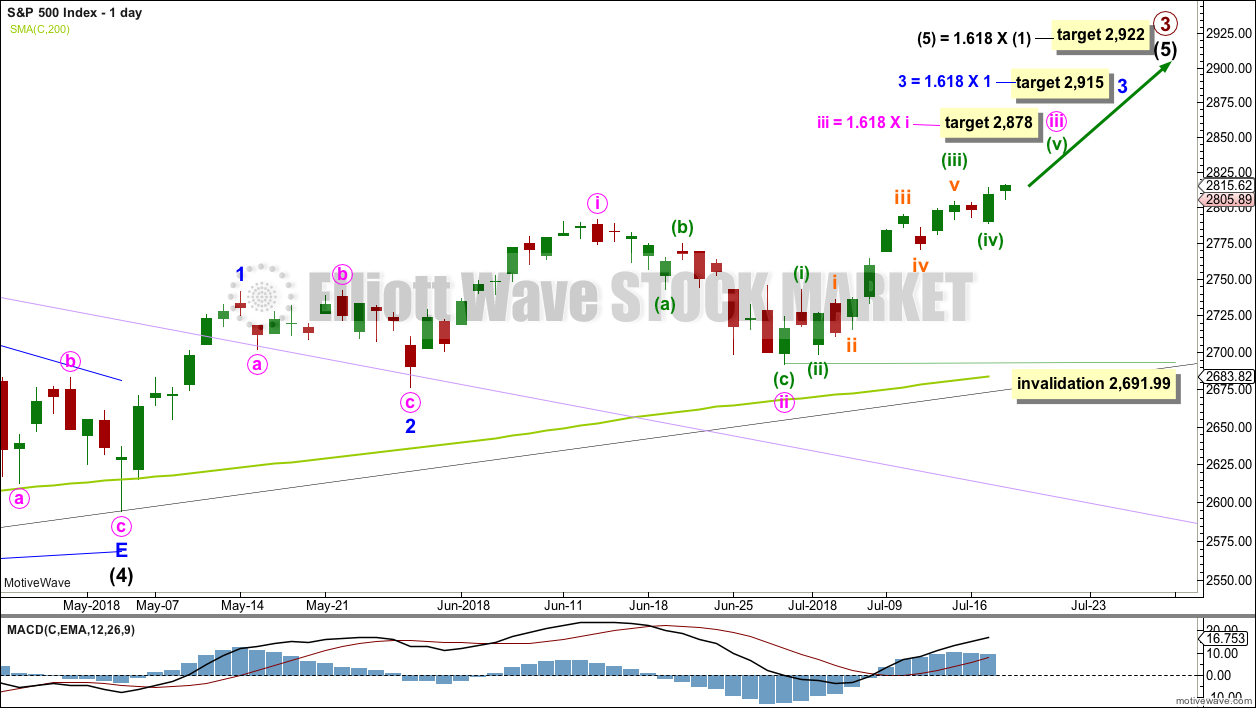
The next short term target is about 2,878; a consolidation lasting about one to two weeks may be expected at about this target. Following that, another consolidation lasting about two weeks may be expected about 2,915.
The invalidation point may now be moved up to the last swing low at 2,691.99.
The mid to longer term target is at 2,922 (Elliott wave) or 3,045 (classic analysis). Another multi week to multi month correction is expected at one of these targets.
The final target for this bull market to end remains at 3,616.
Pullbacks are an opportunity to join the trend.
Always practice good risk management. Always trade with stops and invest only 1-5% of equity on any one trade.
New updates to this analysis are in bold.
The biggest picture, Grand Super Cycle analysis, is here.
Last historic analysis with monthly charts is here, video is here.
ELLIOTT WAVE COUNT
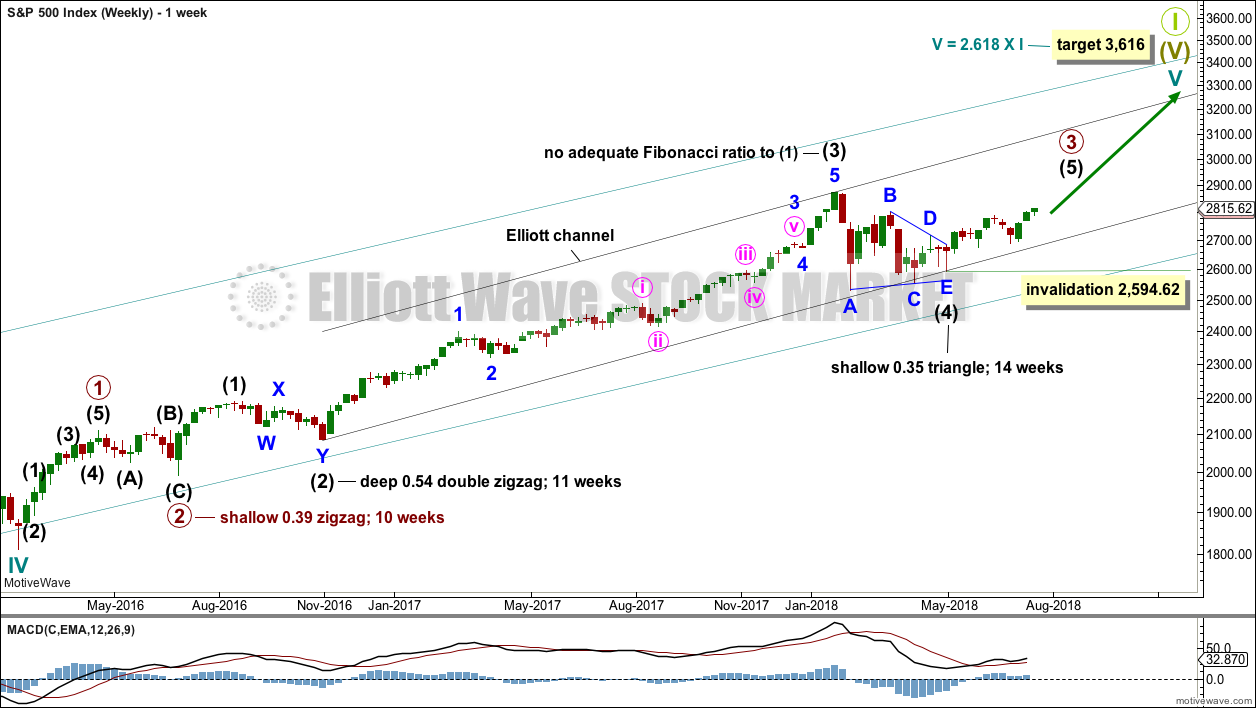
WEEKLY CHART
Cycle wave V must complete as a five structure, which should look clear at the weekly chart level and also now at the monthly chart level. It may only be an impulse or ending diagonal. At this stage, it is clear it is an impulse.
Within cycle wave V, the third waves at all degrees may only subdivide as impulses.
Intermediate wave (4) has breached an Elliott channel drawn using Elliott’s first technique. The channel is redrawn using Elliott’s second technique: the first trend line from the ends of intermediate waves (2) to (4), then a parallel copy on the end of intermediate wave (3). Intermediate wave (5) may end either midway within the channel, or about the upper edge.
Intermediate wave (4) may now be a complete regular contracting triangle lasting fourteen weeks, one longer than a Fibonacci thirteen. There is perfect alternation and excellent proportion between intermediate waves (2) and (4).
Within intermediate wave (5), no second wave correction may move beyond the start of its first wave below 2,594.62.
At this stage, the expectation is for the final target to me met in October 2019.
A multi week to multi month consolidation for primary wave 4 is expected on the way up to the final target.
DAILY CHART
It is possible that intermediate wave (4) is a complete regular contracting triangle, the most common type of triangle. Minor wave E may have found support just below the 200 day moving average and ending reasonably short of the A-C trend line. This is the most common look for E waves of triangles.
Intermediate wave (3) exhibits no Fibonacci ratio to intermediate wave (1). It is more likely then that intermediate wave (5) may exhibit a Fibonacci ratio to either of intermediate waves (1) or (3). The most common Fibonacci ratio would be equality in length with intermediate wave (1), but in this instance that would expect a truncation. The next common Fibonacci ratio is used to calculate a target for intermediate wave (5) to end.
Price has clearly broken out above the upper triangle B-D trend line. This indicates that it should now be over if the triangle is correctly labelled.
A trend line in lilac is added to this chart. It is the same line as the upper edge of the symmetrical triangle on the daily technical analysis chart. Price found support about this line.
A target is now calculated for minute wave iii to end, which expects to see the most common Fibonacci ratio to minute wave i. Minute wave iii may last a few weeks. When it is complete, then minute wave iv may last about one to two weeks in order for it to exhibit reasonable proportion to minute wave ii. Minute wave iv must remain above minute wave i price territory.
Minute wave iii may have passed its middle strongest portion a few days ago. Although the structure could possibly be seen as complete at today’s high, it has still not moved far enough above the end of minute wave i yet to allow room for minute wave iv to unfold and remain above minute wave i price territory. For that to happen it looks like minuette wave (v) may be a relatively long extension, so that minute wave iii moves higher.
A target is calculated for minor wave 3 to end, which expects to see the most common Fibonacci ratio to minor wave 1. Minor wave 3 may last several weeks in total and should look like an impulse at the daily chart level. When it is complete, then minor wave 4 may last about one to two weeks in order for it to exhibit reasonable proportion to minor wave 2. Minor wave 4 must remain above minor wave 1 price territory.
The last bullish fifth wave of minor wave 5 to end intermediate wave (3) (this can be seen on the weekly chart now) exhibited commodity like behaviour. It was strong and sustained. It is possible that the upcoming wave of minor wave 5 to end intermediate wave (5) to end primary wave 3 may exhibit similar behaviour, so we should be on the lookout for this possibility.
HOURLY CHART
The target for minute wave iii to end is now widened to a rather large 6 point zone, now calculated at two degrees. Favour the lower edge of the target zone as it is calculated at a lower degree.
The target for minute wave iii to end would see it move far enough above the end of minute wave i to allow room for minute wave iv to unfold and remain above minute wave i price territory.
Minuette wave (v) may end about the upper edge of the green Elliott channel. If it behaves like a commodity, then it is possible it could overshoot the upper edge of the channel.
Within minuette wave (v), no second wave correction may move beyond the start of its first wave below 2,789.24.
Within minuette wave (v), there may now be two overlapping first and second waves for subminuette waves i and ii, and micro waves 1 and 2. There may be some increase in momentum in the next day or so as the middle of a third wave unfolds higher.
This wave count so far still fits with MACD: the strongest middle portion has the strongest momentum.
TECHNICAL ANALYSIS
WEEKLY CHART
Click chart to enlarge. Chart courtesy of StockCharts.com.
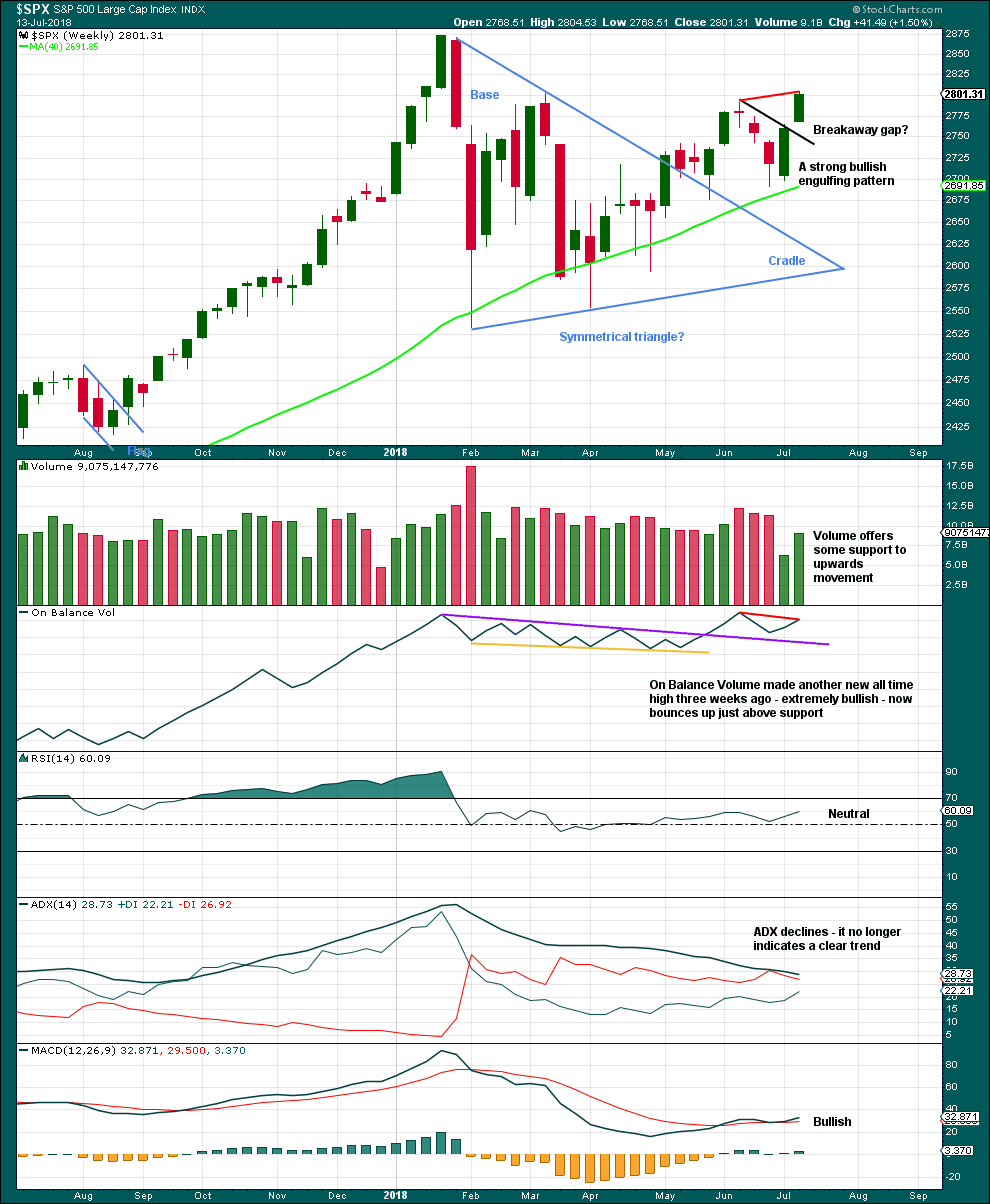
Because the week before last moved price higher but had lighter volume due to the 4th of July holiday, this may affect On Balance Volume. The short term bearish divergence between price and On Balance Volume noted on the chart may not be very significant for this reason.
What may be more significant is another strong upwards week and a gap that may be a breakaway gap. This gap may offer support; breakaway gaps remain open.
DAILY CHART
Click chart to enlarge. Chart courtesy of StockCharts.com.
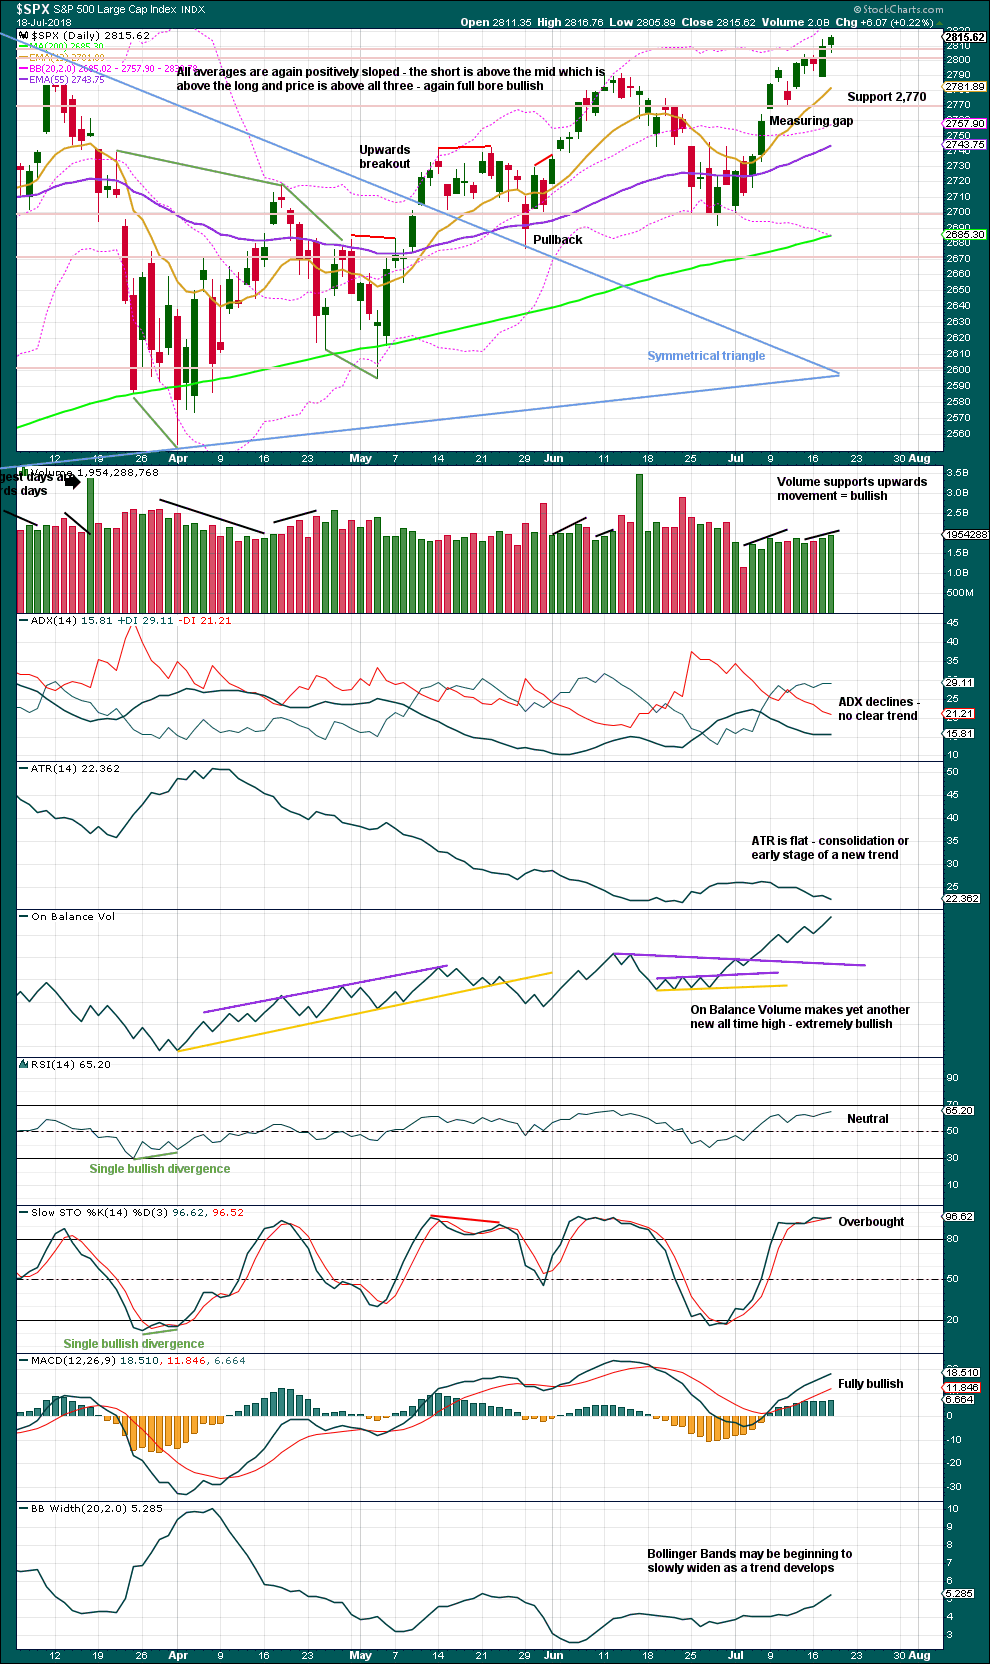
The symmetrical triangle may now be complete. The base distance is 340.18. Added to the breakout point of 2,704.54 this gives a target at 3,044.72. This is above the Elliott wave target at 2,922, so the Elliott wave target may be inadequate.
Since the low on the 2nd of April, 2018, price has made a series of higher highs and higher lows. This is the definition of an upwards trend. But trends do not move in perfectly straight lines; there are pullbacks and bounces along the way. A higher high at the end of last week adds some confidence to this trend.
The measuring gap gives a short term target at 2,838. The gap has offered support. It remains open, and the target remains valid.
There is room still for price to continue higher: On Balance Volume remains extremely bullish, volume supports upwards movement, and RSI is not yet oversold. When On Balance Volume makes new all time highs before price, expect it is very likely that price shall follow through.
Stochastics may remain overbought for long periods of time when this market has a strong bullish trend. Only when it reaches overbought and then exhibits clear divergence with price, then it may be useful as an indicator of a possible high in place. That is not the case yet.
VOLATILITY – INVERTED VIX CHART
WEEKLY CHART
Click chart to enlarge. Chart courtesy of StockCharts.com. So that colour blind members are included, bearish signals
will be noted with blue and bullish signals with yellow.
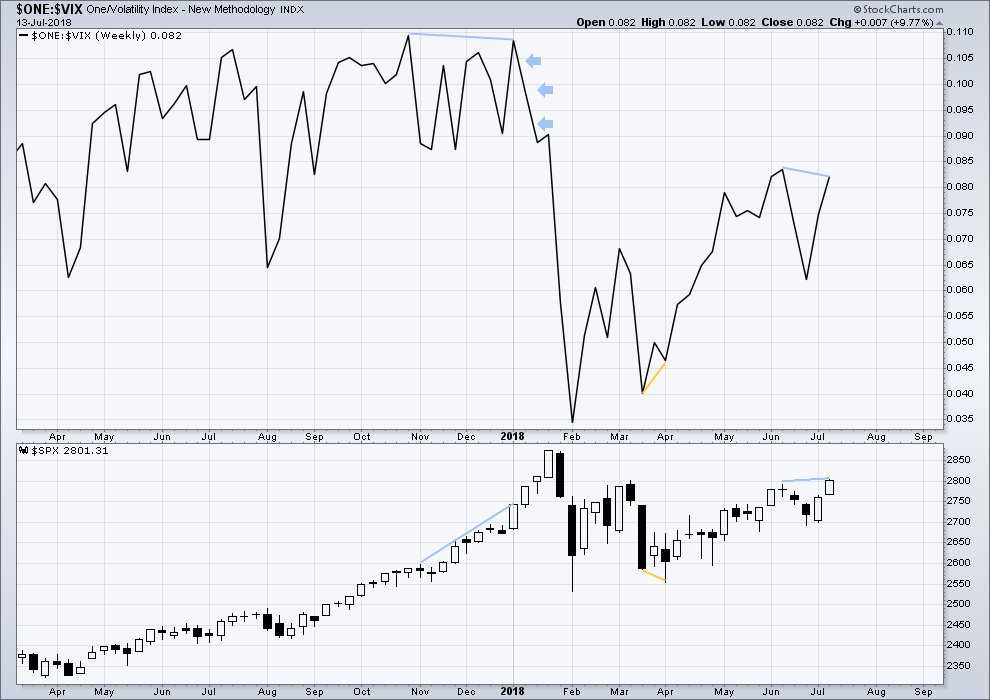
To keep an eye on the all time high for inverted VIX a weekly chart is required at this time.
Notice how inverted VIX has very strong bearish signals four weeks in a row just before the start of the last large fall in price. At the weekly chart level, this indicator may be useful again in timing the end of primary wave 3.
There is now short term bearish divergence between price and inverted VIX. This divergence is seen on both weekly and daily time frames. It is not very strong.
DAILY CHART
Click chart to enlarge. Chart courtesy of StockCharts.com. So that colour blind members are included, bearish signals
will be noted with blue and bullish signals with yellow.
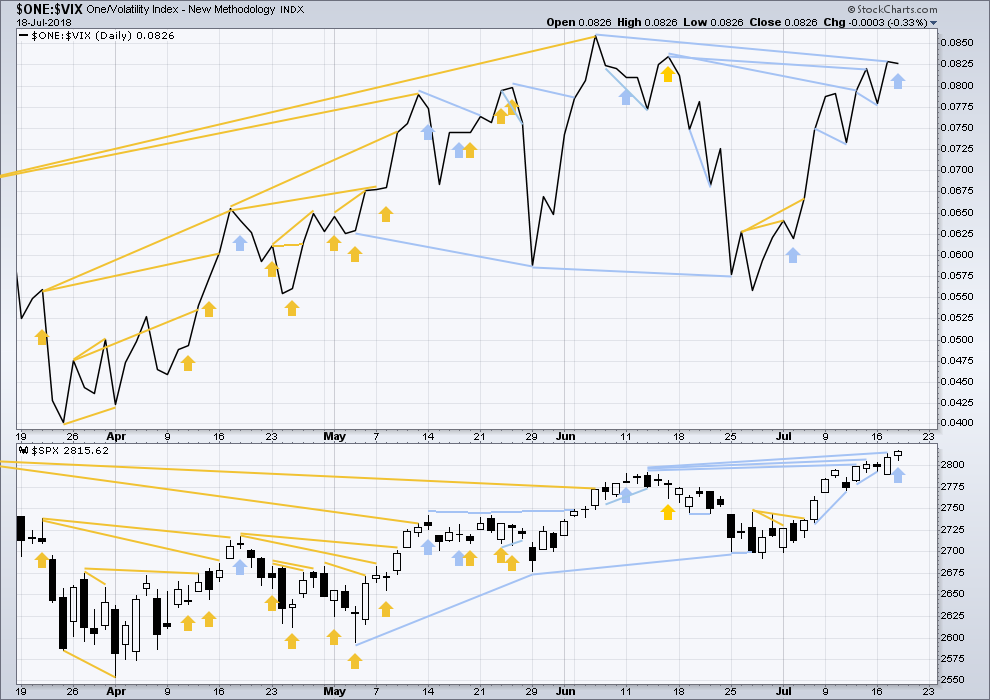
Normally, volatility should decline as price moves higher and increase as price moves lower. This means that normally inverted VIX should move in the same direction as price.
Price moved higher today, but inverted VIX moved lower. The rise in price did not come with a corresponding decline in market volatility; volatility has increased. This divergence is bearish.
BREADTH – AD LINE
WEEKLY CHART
Click chart to enlarge. Chart courtesy of StockCharts.com.
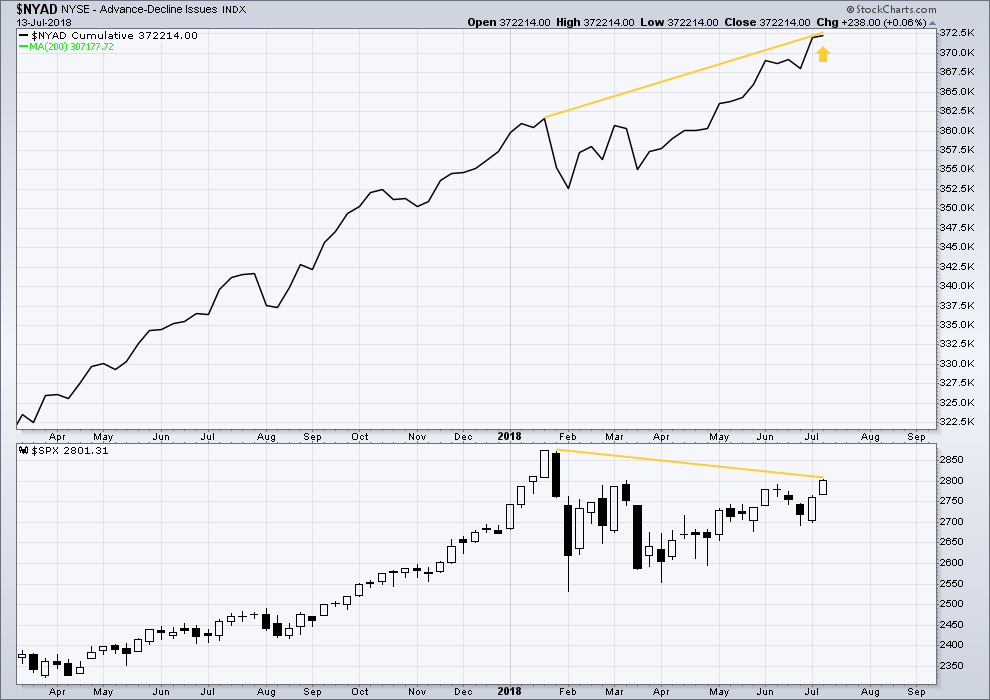
When primary wave 3 comes to an end, it may be valuable to watch the AD line at the weekly time frame as well as the daily.
At this stage, there is very strong bullish divergence between price and the AD line at the weekly time frame. With the AD line making new all time highs, expect price to follow through with new all time highs in coming weeks.
DAILY CHART
Click chart to enlarge. Chart courtesy of StockCharts.com.
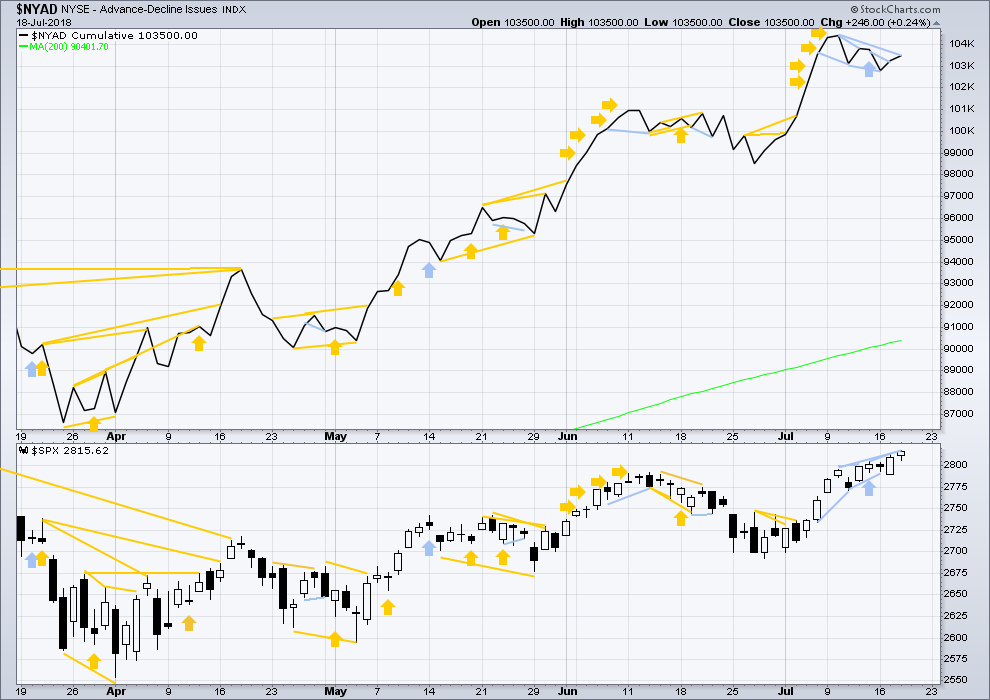
There is normally 4-6 months divergence between price and market breadth prior to a full fledged bear market. This has been so for all major bear markets within the last 90 odd years. With no longer term divergence yet at this point, any decline in price should be expected to be a pullback within an ongoing bull market and not necessarily the start of a bear market. New all time highs from the AD line means that any bear market may now be an absolute minimum of 4 months away. It may of course be a lot longer than that. My next expectation for the end of this bull market may now be October 2019.
Breadth should be read as a leading indicator.
Overall, recent new all time highs from the AD line remain extremely bullish for the longer term trend.
Price may reasonably be expected to follow through in coming weeks.
There is still short term bearish divergence between price and the AD line: price made a new high above the prior high seven sessions ago, but the AD line has not made a corresponding new high. This short term divergence may be resolved by one or two days of downwards movement.
DOW THEORY
The following lows need to be exceeded for Dow Theory to confirm the end of the bull market and a change to a bear market:
DJIA: 23,360.29.
DJT: 9,806.79.
S&P500: 2,532.69.
Nasdaq: 6,630.67.
Only Nasdaq at this stage is making new all time highs. DJIA and DJT need to make new all time highs for the ongoing bull market to be confirmed.
Charts showing each prior major swing low used for Dow Theory may be seen at the end of this analysis here.
Published @ 09:36 p.m. EST.

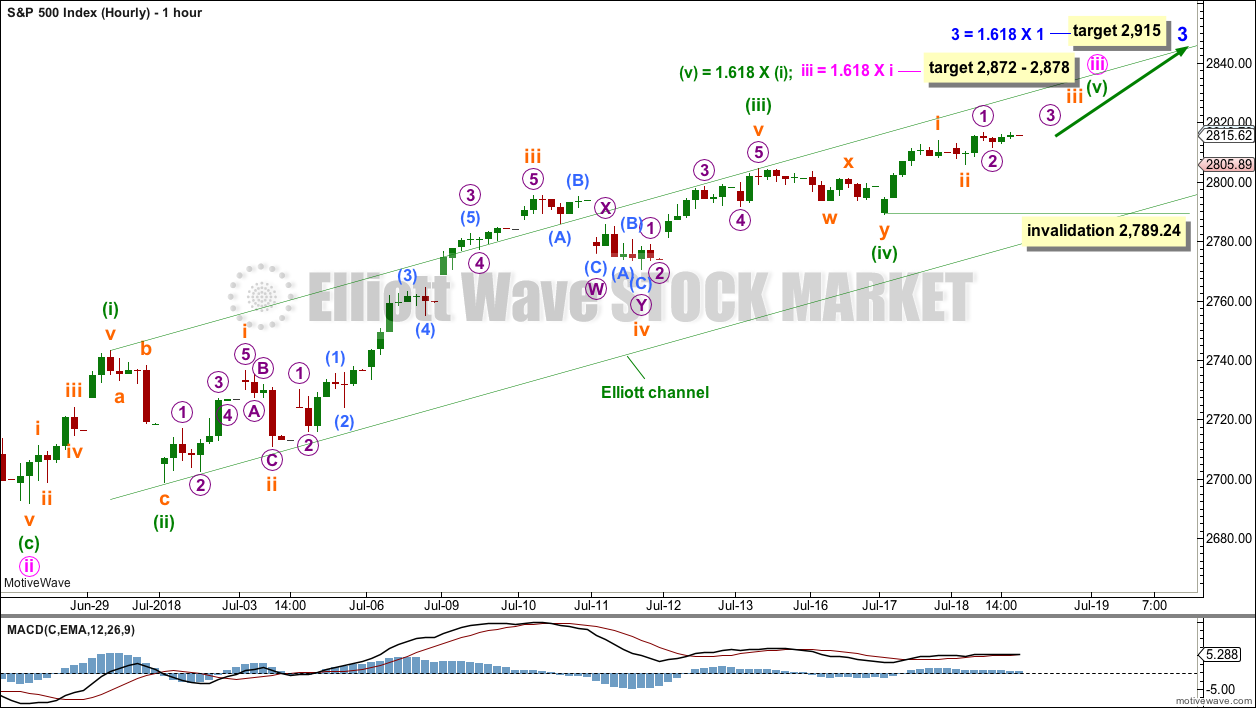
Updated hourly chart:
An expanded flat for subminuette ii looks possible, it has a good look.
Price remains within the channel, targets remain the same.
Awesome move down in gold and no sign yet it’s over. But it’s time to watch for the turn. It could be “right here” as price has massaged a key 62% retrace fibo. But just below are two significant pivot lows (mar and jul ’17) and the 128% extension of the move up from Dec-Apr. The gray box shows what I think a likely turn zone is then. Should be an opportunity soon.
XLE may be close to popping to the upside (or down….). 11 or so days of squeeze on the daily chart (shown), and yesterday a reversal-ish type of candle. Now there’s 8 hours of squeeze on the hourly chart, with a Darvas box resistance line at 75.5 (today’s high). I will be getting long XLE on a break up through that resistance and start of a fresh swing up, looking for a quick move to 77 minimum, 80+ ideally.
In my trading experience, important changes of trend announce their arrival by demolishing prior contested pivots on the first impulse down. It is one of the most powerful of evidences that you indeed have a genuine change of trend. On the contrary, when there is hesitation or meandering around such previously contested pivots, that is almost always a dead give away the the move down is merely corrective, and that the uptrend is destined to continue. The line in the sand for me were the twin pivots of DJI 25K and SPX 2800, and in my humble opinion, the failure of the move down to take out those levels strongly suggests to me that we do not have a major trend change here. If those pivots remain intact into the close, I think it severely weakens the near term bearish case.
It is also true that we are at the top of a trading range going back to the beginning of February so we could see some more downside; I think it will be limited. Just my two cents. Have a great evening everyone!
BTW, unloaded remaining VIX 12 strike calls for 1.30 on 1.10/1.50 spread…not too bad…
I’ll agree with that observation.
And I’ve ignored it to my detriment too many times.
Further, a small range day closing barely into the real body of the last strong upwards candlestick, does look very much corrective. Not at all like the start of a deeper and longer lasting pullback let alone a trend change.
So far.
What in Gods green earth are those last two candles….?…..
Astonishing levels of manipulation
“We have control of the vertical…
We have control of the horizontal…
You are about the enter the world of…the Outer Limits!”
I think it was a PPT member accidentally leaning on the “buy” key.
haha, accidentally lol 🙂
There’s significant potential of a daily tf swing down starting up here. I know the EW count indicates “not likely”, but that’s just a map and a probability indicator, not a prediction.
I’ll say it once again: 1.282 extensions (sqrt(1.618)) are SIGNIFICANT. Price very often turns and forms a pivot high at the 1.28 (and the 1.62). SPX has for all intents and purposes tagged it, and has immediately started consolidating under it.
The daily tf chart here show my critical watchpoints: if there’s a complete bar break below the 5 period ema (white EMA line), and/or the steepest trend line here gets broken, I will be loading up on some shorts pronto.
‘Nuff said! Not trading advice, YMMV, and best of luck. Most likely…price pushes up tomorrow. But not necessarily.
Gotta run!
Back at the close to take a peek… 🙂
The one thing the bulls DO NOT want to see is a gap below those pivots…that would be un-good (for them), equivalent of a first round TKO!
O.K. Bears getting ready for assault on the pivots. If price bounces there, I think we resume the march higher. If we slice through it like a hot knife through budda…
“Farewell and adieu, to you Spanish ladies…!”
Exhaustion gap in RUT. It should play catch up.
From Lara’s analysis above:
“There remains bearish divergence between price and the AD line though. If my analysis is wrong for the short term, there may be a pullback to last a very few days coming up sooner than expected.”
Might that be what’s up today?
could be
that short term divergence can be resolved by one or two red daily candlesticks
Bull flag in VIX…sold calls too soon…RATS!!! 🙂
Moves down impressive but I remain agnostic. We know the banksters all too well, now don’t we?
No way I’m backing up the truck until those pivots fall on high volume, and that is by no means a foregone conclusion…
Second DJI gap down closed, SPX still a ways away (see what I did there?!) 😀
Remember…second waves are intended to get you to voluntarily stick your head under the guillotine…! 😉
What degree second wave are you referring to Verne?
Not sure about SPX, but DJI and Nasdaq look like initial impulses down. That would need confirmation by a new low…
Nasdaq and DJI look like impulses down, 3,3,5 flat correction for a second wave underway. A new low needed to confirm. Not sure about SPX..looks more like a three down to me…
I am not sure why these kinds of market pricing anomalies sometimes show up. The theory of efficient markets should preclude this ever happening, like contango, backwardation, and of course, the infamous carry trade.
Apparently RUT did not get memo and is currently bucking the trend. Free money! 🙂
RUT has been bucking the trend and hitting ATHs all throughout this correction. How does that constitute free money? Sure the divergence might work this time, but I don’t see any high percentage swing trades here based on the last few months. Unless you think it’s finally going to collapse, but I don’t know how to reliably predict that and I am terrible at timing dips.
You cannot swing trade this market. You have to scalp it.
The bearish rising wedge in RUT looks pretty obvious to me…..
I find the RUT to be an excellent market for swing trading at the hourly and daily tf’s. Here’s the recent action at the hourly level: what’s the problem? I just took profit myself on a 2 day swing trade long using IWM calls. I won’t say it’s easy money, but as markets go, I view it as VERY well behaved.
AND (I almost forget) I’ve got a nice little IWM bull call spread I bought a day or two ago, expiring tomorrow, wholly in the money at the moment, sure hope we don’t get a hard sell off tomorrow! No problem swinging this market at all IMO. Only long of course, because the weekly and monthly are quite strongly up trending. Why swim up stream?
Bull spread on a bearish rising wedge??!! You are a brave man! 🙂
I do not personally consider a trade lasting less than one week to be a swing trade per se. Exits executed in hours for me is day trading, hours to days, scalping. Just my own take mind you.
While the declines across several indices are impulsive, of late that has meant little. You cannot trade these markets without a healthy respect for you-know-who! Rhymes with gangstas! 🙂
Yep… the Rhymes with gangstas folks are playing with the Gold and Silver prices this morning! Both will turn up Big soon to new 52 week highs… and that will provide the fuel for AG’s burst swing to $9.75+++ In the face of that the miners are holding strong and is a sector to look at for a swing trade for one to 2 months.
AG will provide the most bang for the buck in this swing up!
I’m keeping an eye on AG, watching for polarity inversion on the hourly. Not there yet, still in a down trend at weekly, daily, and hourly tf’s. I still suspect the bottom here is going to be at 6.29, the 62% fibo.
RSI & other way oversold for that! 200 Day Moving Average at $6.75 and 100 Day Moving Average at $6.82.
Plus 50DMA already crossed over 200 DMA and 100DMA already crossed over 200 DMA!
Metrics derived off of recent price action are not predictive, and only sometimes indicative. I don’t jump under falling knives; I need to see evidence of the market headed the way I’m going to trade (most times), before I trade it. Because RSI can stay “over sold” (a misnomer) for a very, very long time, and moving averages can recross, etc.
Now there’s 2 hours of squeeze on AG. And price has fallen below the 50% fibo. This should be interesting.
I think you are correct. The futures move off the low while strong, is only three waves so it will likely be fully retraced.
Joe, have you been selling covered calls against your long AG position?
No… every time I touch an option I lose money!
I know the strategy well… I don’t want to be locked into any position!
Too many things to be right on to make any money! Never again!
I have been doing it with GORO for a long time. Six months out you can buy back calls at a tidy profit 90% of the time. Rinse and repeat. If it looks like I will get called away, I go long deep in the money calls or sell in the money puts to maintain long position. In five years called away only four times!
But you are right. Options are definitely not for everyone; they can exact some serious dudes before one learns how to trade them profitably.
They always seem to be on the winning side….wish I had a Control P
Yep… I guess when you can control all with a Bazooka on any given day + the “fake news” it would seem that way!
HaHa! Me too! 🙂
The bears are very clever. Do you see what they have done?
They are forcing the banksters to both try to fill the open gap (two in the case of DJI!) AND defend the pivots…sneaky!! 😀
( I would not be surprised if the let them come right up to the gap area and then, WHAM!!)
Sold half VIX calls for 1.50….yeah…I know…I’m a WUS! 🙂
ABB looked awfully attractive to me late in yesterday’s session, but I got distracted and didn’t enter. Popped up 3% on a big gap this morning. I think there’s a lot left; it appears to be a break away gap. I bought some Aug calls (the spread prices were way too skewed).
Dual gaps down in DJI but not SPX. A new low and it’s time to strap in….
Predictably, here comes the PPT! Let’s see what they’ve got left in the tank. A closure of both gaps and successful defence of the pivots would be very impressive indeed!
OIH is on 8 periods of squeeze at the daily tf, 4 periods of squeeze at the hourly tf, and 12 periods of squeeze at the 5 minute tf. I’m interested because price is at the bottom edge of a butterfly spread I have on it expiring tomorrow. Sadly, my first order guess is the squeeze resolves downward, but probably it doesn’t resolve starting tomorrow anyway. Just 30 cents up in OIH by EOD tomorrow would float my boat there….
Multiple gaps down in a cash session is a very rare event indeed! VERY rare!
OK. Now at 12.92. “Glitches!”…. But of course!!! HeHe!
Now they have stopped streaming data on VIX price….you CANNOT make this up….!
Charts on several screens stuck at 12.33! Yikes!
Where is everyone? Why so quiet? 🙂
it’s quiet in here when the market is in a slow grinding upwards trend.
it’ll get real busy eventually when Primary 4 arrives, and then when Super Cycle (V) is over and a bear market arrives…. I may need to employ someone to help me with comments!
I’m in. Will take a leave from Bryan’s posse! What fun! 🙂 🙂
( No charge! As you know, I owe you!)
Watch the aforementioned pivots. I still think that right now they provide the best clues. I keep seeing my regular indicators get busted but the battles around these levels provide real price discovery insight. If the bears close the market below them, bulls are in for some serious mauling. The bulls expended a frightful amount of capital reclaiming them.
If we close above them, its off to the races…big time!
It is quite remarkable that so few traders have been paying even scant attention to the price action in volatility and its implications. Why is that?
Take a long hard look at those candles folk. In the coming crisis they are going to be twice as long….only GREEN! 🙂
Stink bids to capture those spikes down not working. They are refusing to fill….no surprise!
VIX candles??!!!
Stark, raving, lunacy…!!!
Can you believe it?!!!! 🙂
par for the course until it’s not
VIX 12.00 strike calls now seeing “improvement” in spread….0.75/2.20…
Glad I bought earlier…. 🙂
I think they will bite at 2.00 even.
What to do…?!
Moved limit to 2.50…
The volatility insanity continues…look at those candles on the 5 min chart!
So interesting that they drove VIX back below 12 but have been unable, so far, to push DJI and SPX to new ATH. What does that suggest? Hmmmnnnnn…. !
At some point in the not-too-distant future, traders everywhere are going to figure out what has been going on with volatility suppression. Not too long after that the hetd is going to also catch on. What do you think is going to happen then?
I think long vol has the potential to be the most obscenely profitable trade of a trading lifetime. I say “potential” because, for any number of reasons, you could end up not being paid! Caveat Emptor!
The volatility explosion in February was already the trade of a lifetime (biggest one day VIX pop ever). There can only be so many trades of a lifetime in one lifetime, right? You’d think it would have to be 1 by definition. But it seems like there is always a VIX trade of a lifetime around the corner…
Nope! That was definitely NOT it. Stick around….
Bid/ask spread on VIX calls now a theatre of the absurd…always a sign of turbulence ahead. So, what do you do with a laughable 0.55/1.95 spread for 12 strike calls? Simple.
You open a STC at a limit price of at least 2.00. This is generally a good sign that market makers think price is headed higher. We had another hint with the collapse of price on SPY near dated call options9 into the close yesterday. Here is hoping I get filled at the open.
You have to be wary of signals in this market!
DJI 25K and SPX 2800 remain my lines in the sand…
Stepping back and looking at the big picture, something I like to occasionally do in trying to spot patterns, you cannot help but notice since the year began every month begins with an uptrend, but ends with a downtrend. Will the pattern continue? 🙂
Thanks Lara for such a detailed analysis! Anyone happen to know where i can get AD line for RUT? Doesn’t look like TOS has it.
You’re welcome Jules.
StockCharts doesn’t appear to have it either. They have only the NYSE AD line.
A cheater’s “look ahead” at the weekly with this week’s bar so far in place. FInally since mid March my weekly trend indicator shifts from “down” (always mild, never “strong down”) to neutral. And for 3 weeks, the momentum of the market per the almost straight up trend line is sky high, on average. Note this is the 4th in a row of increasing slope trend lines under the weekly market action. That can’t continue forever…but it can go for quite awhile!
I continue to see the 127% as a possible turn area (2719), then the 161% (2853), and right around there are a couple of symmetric projections of earlier up swings (white lines), then there’s the ATH pivot high and Lara’s targets are right there.
Note the action in the 3 weeks since blowing out of the 4 week squeeze (red dots on top indicator; shows where a 21 period bollinger is inside a 15 period keltner). A classic example of why higher tf squeezes are opportunities and why I always try to mention them on any chart I see them on.
I cast my vote on 2853! The only thing that’s bothering me right now is that bond yields berely move today! Feels like investors are not sold on the bull case yet!
Yep. I am thinking at least 2840 based on what looked like a bull flag yesterday. 🙂