Sideways movement for Monday’s session remains within the Elliott wave channel on the hourly chart.
Four signals in a row from the AD line prompt a new hourly Elliott wave count.
Summary: Overall, expect the upwards trend to continue. For the short term, look out for a possible pullback to last a very few days, which may end about 2,764 or about the lower edge of the Elliott channel on the new hourly wave count.
The next short term target is about 2,878; a consolidation lasting about one to two weeks may be expected at about this target. Following that, another consolidation lasting about two weeks may be expected about 2,915.
The invalidation point may now be moved up to the last swing low at 2,691.99.
The mid to longer term target is at 2,922 (Elliott wave) or 3,045 (classic analysis). Another multi week to multi month correction is expected at one of these targets.
The final target for this bull market to end remains at 3,616.
Pullbacks are an opportunity to join the trend.
Always practice good risk management. Always trade with stops and invest only 1-5% of equity on any one trade.
New updates to this analysis are in bold.
The biggest picture, Grand Super Cycle analysis, is here.
Last historic analysis with monthly charts is here, video is here.
ELLIOTT WAVE COUNT
WEEKLY CHART
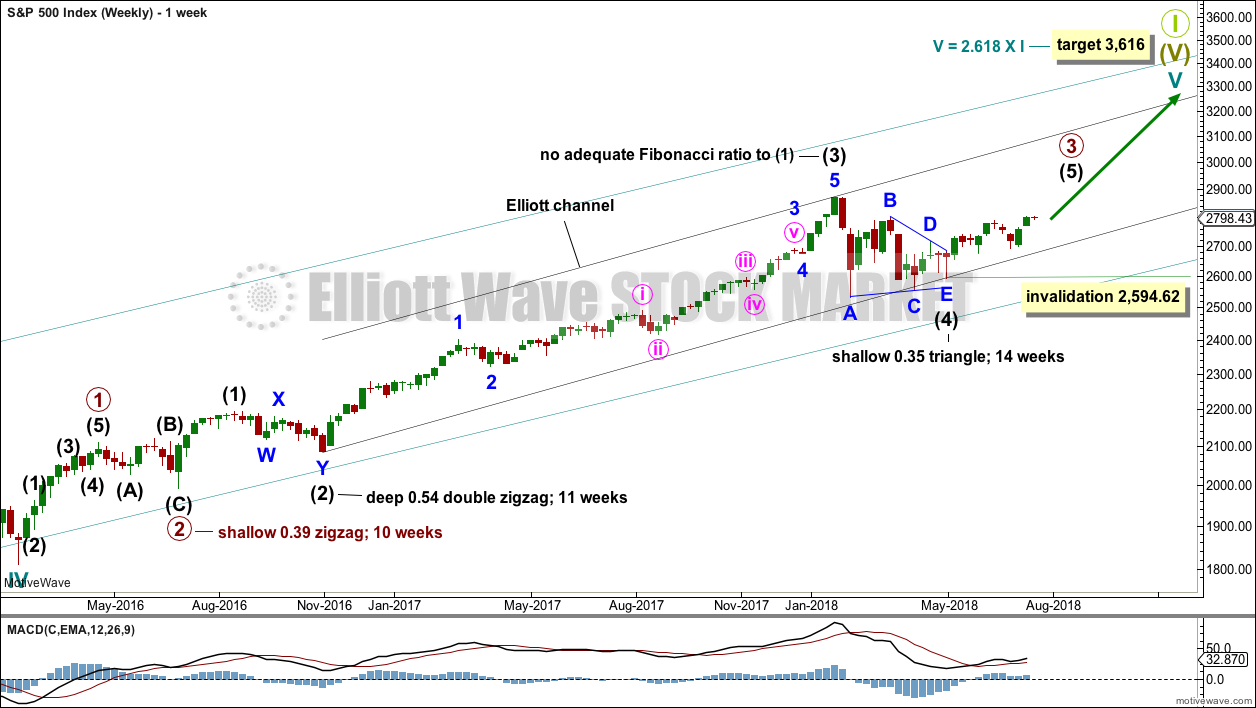
Cycle wave V must complete as a five structure, which should look clear at the weekly chart level and also now at the monthly chart level. It may only be an impulse or ending diagonal. At this stage, it is clear it is an impulse.
Within cycle wave V, the third waves at all degrees may only subdivide as impulses.
Intermediate wave (4) has breached an Elliott channel drawn using Elliott’s first technique. The channel is redrawn using Elliott’s second technique: the first trend line from the ends of intermediate waves (2) to (4), then a parallel copy on the end of intermediate wave (3). Intermediate wave (5) may end either midway within the channel, or about the upper edge.
Intermediate wave (4) may now be a complete regular contracting triangle lasting fourteen weeks, one longer than a Fibonacci thirteen. There is perfect alternation and excellent proportion between intermediate waves (2) and (4).
Within intermediate wave (5), no second wave correction may move beyond the start of its first wave below 2,594.62.
At this stage, the expectation is for the final target to me met in October 2019.
A multi week to multi month consolidation for primary wave 4 is expected on the way up to the final target.
DAILY CHART
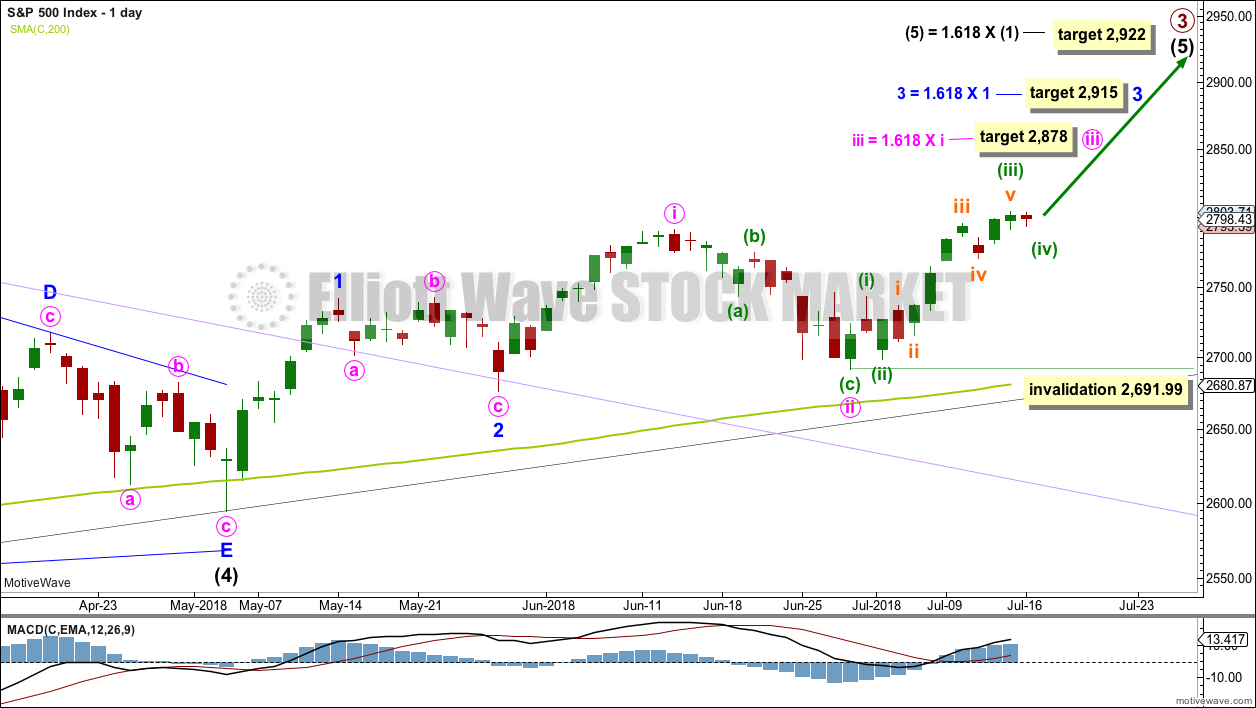
It is possible that intermediate wave (4) is a complete regular contracting triangle, the most common type of triangle. Minor wave E may have found support just below the 200 day moving average and ending reasonably short of the A-C trend line. This is the most common look for E waves of triangles.
Intermediate wave (3) exhibits no Fibonacci ratio to intermediate wave (1). It is more likely then that intermediate wave (5) may exhibit a Fibonacci ratio to either of intermediate waves (1) or (3). The most common Fibonacci ratio would be equality in length with intermediate wave (1), but in this instance that would expect a truncation. The next common Fibonacci ratio is used to calculate a target for intermediate wave (5) to end.
Price has clearly broken out above the upper triangle B-D trend line. This indicates that it should now be over if the triangle is correctly labelled.
A trend line in lilac is added to this chart. It is the same line as the upper edge of the symmetrical triangle on the daily technical analysis chart. Price found support about this line.
A target is now calculated for minute wave iii to end, which expects to see the most common Fibonacci ratio to minute wave i. Minute wave iii may last a few weeks. When it is complete, then minute wave iv may last about one to two weeks in order for it to exhibit reasonable proportion to minute wave ii. Minute wave iv must remain above minute wave i price territory.
Minute wave iii may have passed its middle strongest portion a few days ago. Although the structure could possibly be seen as complete at today’s high, it has not moved far enough above the end of minute wave i yet to allow room for minute wave iv to unfold and remain above minute wave i price territory. For that to happen it looks like minuette wave (v) may be a relatively long extension, so that minute wave iii moves higher.
A target is calculated for minor wave 3 to end, which expects to see the most common Fibonacci ratio to minor wave 1. Minor wave 3 may last several weeks in total and should look like an impulse at the daily chart level. When it is complete, then minor wave 4 may last about one to two weeks in order for it to exhibit reasonable proportion to minor wave 2. Minor wave 4 must remain above minor wave 1 price territory.
The last bullish fifth wave of minor wave 5 to end intermediate wave (3) (this can be seen on the weekly chart now) exhibited commodity like behaviour. It was strong and sustained. It is possible that the upcoming wave of minor wave 5 to end intermediate wave (5) to end primary wave 3 may exhibit similar behaviour, so we should be on the lookout for this possibility.
HOURLY CHART
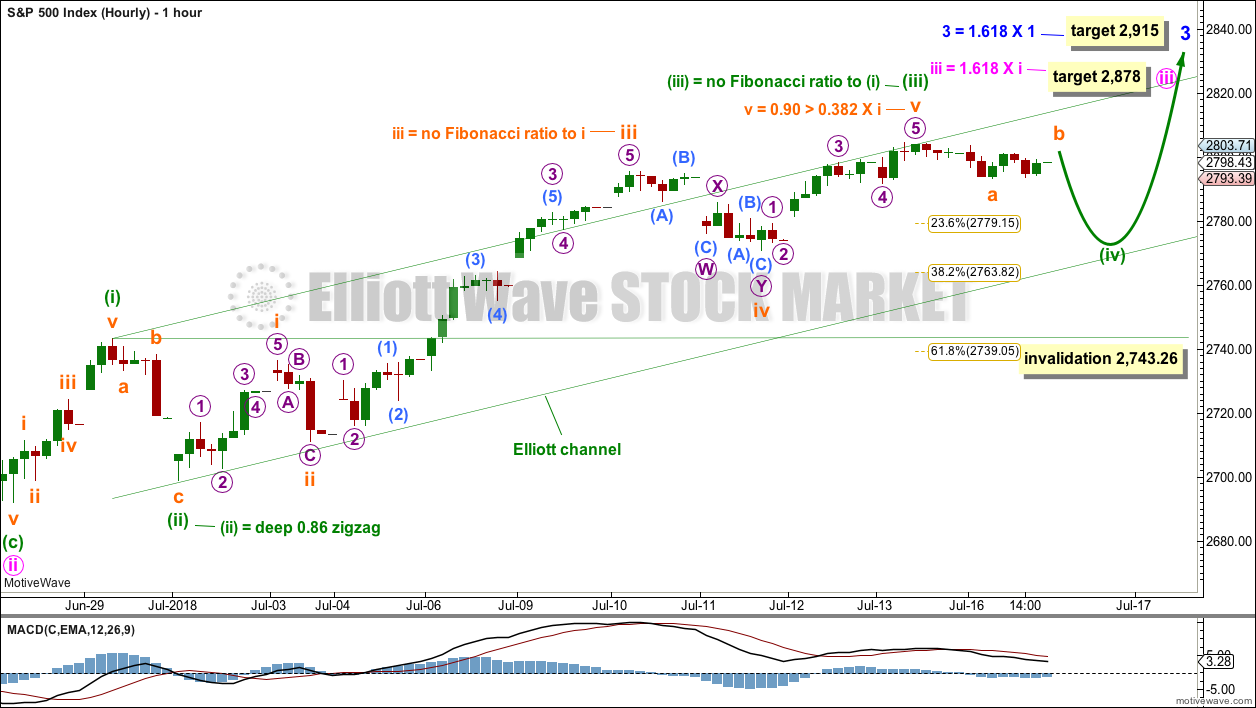
This wave count is new today. It expects another one to very few days of sideways or downwards movement for minuette wave (iv).
The Fibonacci ratios for this new hourly wave count are slightly better than the Fibonacci ratios for the alternate hourly wave count.
Minuette wave (ii) was a deep double zigzag and lasted one day on the daily chart. Minuette wave (iv) may be expected to most likely be a flat, combination or triangle. It may last one to a few days; these types of sideways corrections tend to be a little longer lasting than single or multiple zigzags.
Minuette wave (iv) may end about the lower edge of the green Elliott channel. It may not move into minuette wave (i) price territory below 2,743.26.
ALTERNATE HOURLY CHART
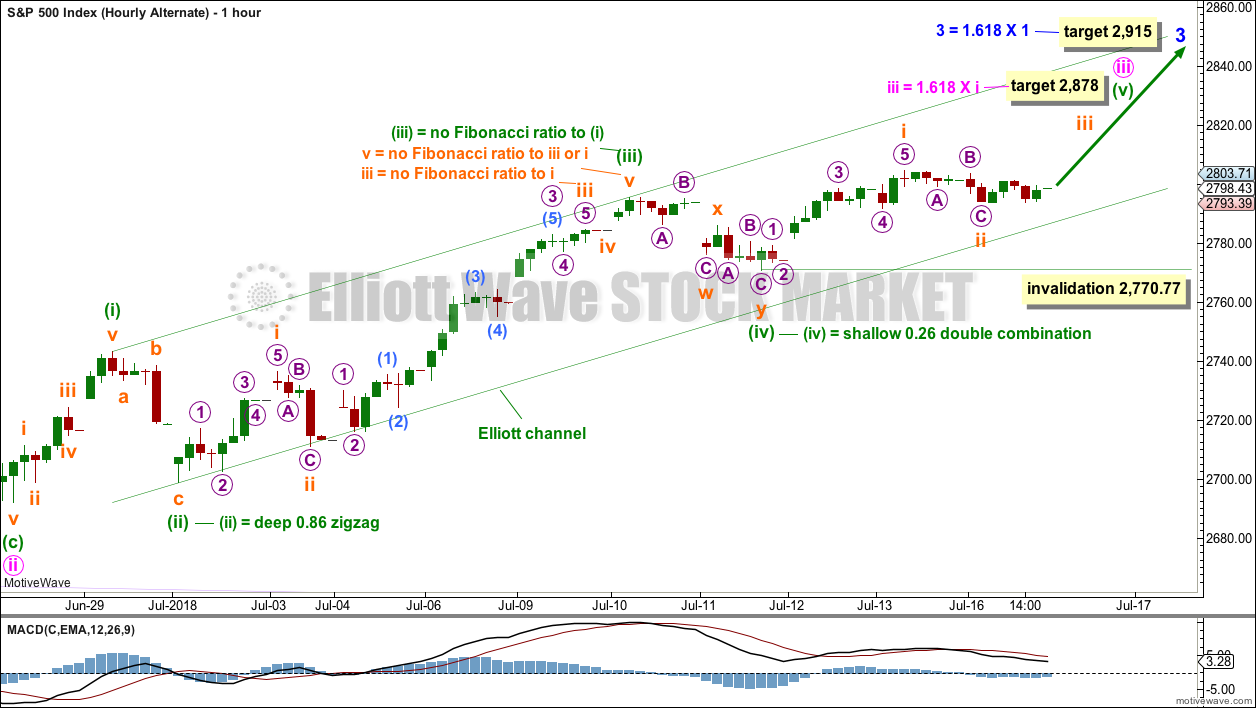
This wave count is swapped over to an alternate today.
The target for minute wave iii remains the same. At the daily chart level, minute wave iii still needs to move reasonably higher in order for minute wave iv to have room to unfold and remain above minute wave i price territory.
There is perfect alternation now between minuette waves (ii) and (iv).
Minuette wave (v) may end about the upper edge of the green Elliott channel. It is also possible that if minuette wave (v) exhibits commodity like behaviour, that it may break above the upper edge of the Elliott channel.
Within minuette wave (v), the correction for subminuette wave ii may not move beyond the start of subminuette wave i below 2,770.77.
TECHNICAL ANALYSIS
WEEKLY CHART
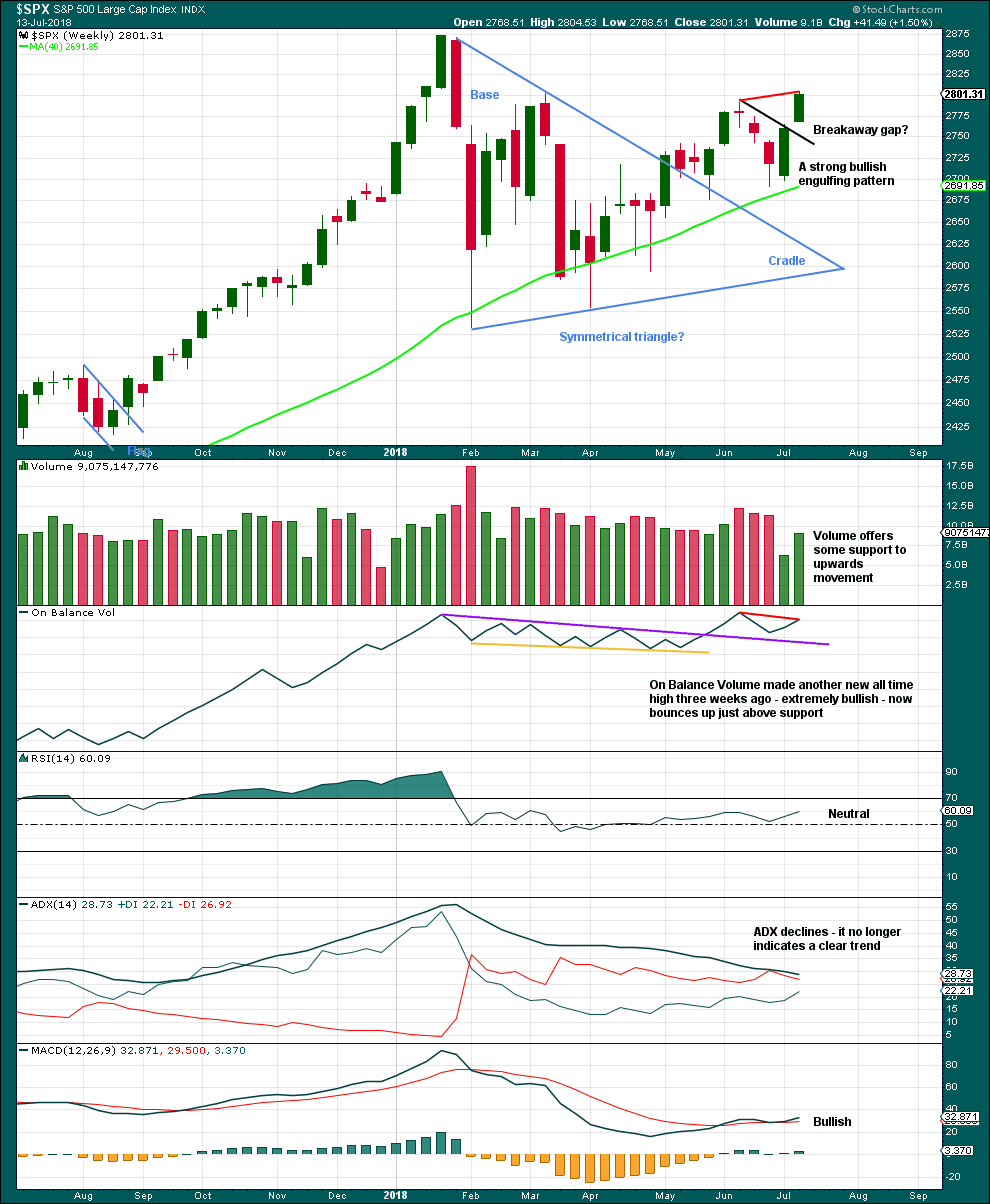
Click chart to enlarge. Chart courtesy of StockCharts.com.
Because the week before last moved price higher but had lighter volume due to the 4th of July holiday, this may affect On Balance Volume. The short term bearish divergence between price and On Balance Volume noted on the chart may not be very significant for this reason.
What may be more significant is another strong upwards week and a gap that may be a breakaway gap. This gap may offer support; breakaway gaps remain open.
DAILY CHART
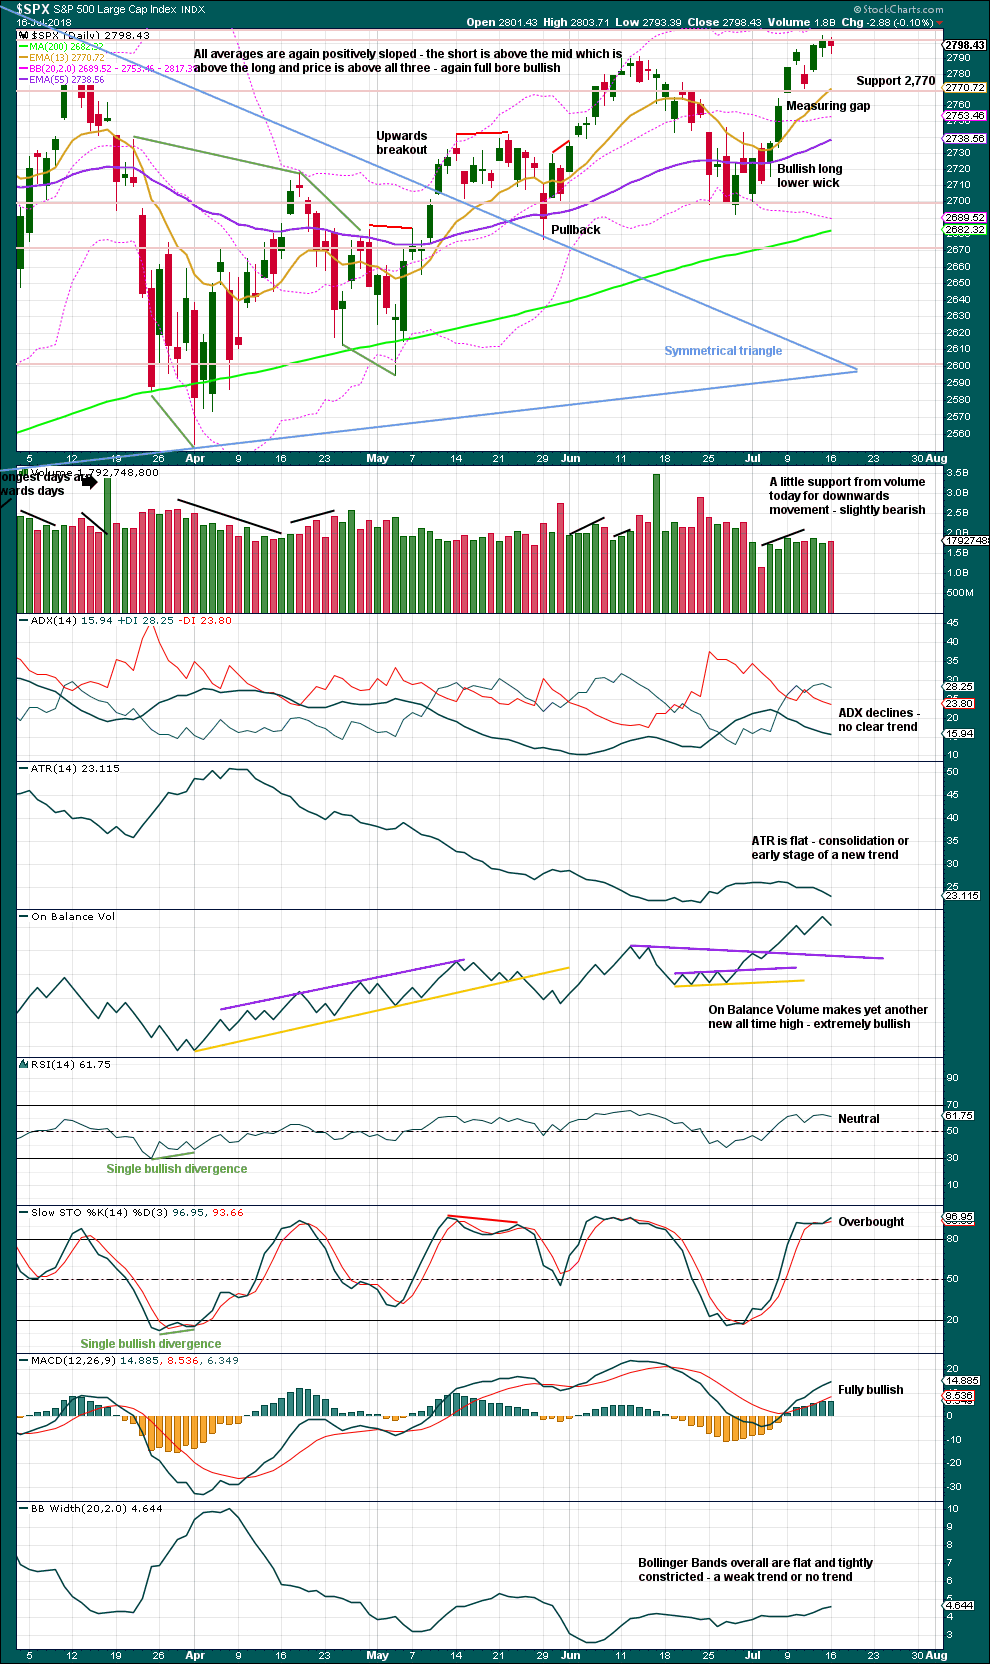
Click chart to enlarge. Chart courtesy of StockCharts.com.
The symmetrical triangle may now be complete. The base distance is 340.18. Added to the breakout point of 2,704.54 this gives a target at 3,044.72. This is above the Elliott wave target at 2,922, so the Elliott wave target may be inadequate.
Since the low on the 2nd of April, 2018, price has made a series of higher highs and higher lows. This is the definition of an upwards trend. But trends do not move in perfectly straight lines; there are pullbacks and bounces along the way. A higher high at the end of last week adds some confidence to this trend.
The measuring gap gives a short term target at 2,838. The gap has offered support. It remains open, and the target remains valid.
On Balance Volume remains extremely bullish.
A feature of this market for some years now is rising price on light and declining volume. Slightly lighter volume for Friday is not concerning in current market conditions. Slightly stronger volume for downwards movement during Monday is slightly bearish for the short term, supporting the new hourly Elliott wave count.
Stochastics may remain overbought for long periods of time when this market has a strong bullish trend. Only when it reaches overbought and then exhibits clear divergence with price, then it may be useful as an indicator of a possible high in place. That is not the case yet.
VOLATILITY – INVERTED VIX CHART
WEEKLY CHART
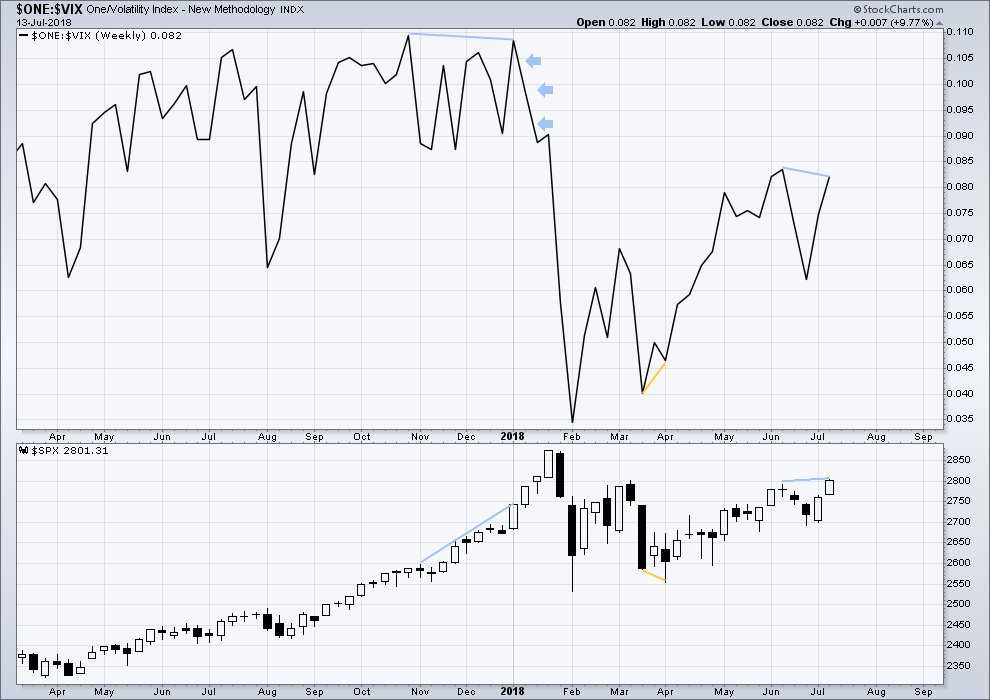
Click chart to enlarge. Chart courtesy of StockCharts.com. So that colour blind members are included, bearish signals
will be noted with blue and bullish signals with yellow.
To keep an eye on the all time high for inverted VIX a weekly chart is required at this time.
Notice how inverted VIX has very strong bearish signals four weeks in a row just before the start of the last large fall in price. At the weekly chart level, this indicator may be useful again in timing the end of primary wave 3.
There is now short term bearish divergence between price and inverted VIX. This divergence is seen on both weekly and daily time frames. It is not very strong.
DAILY CHART
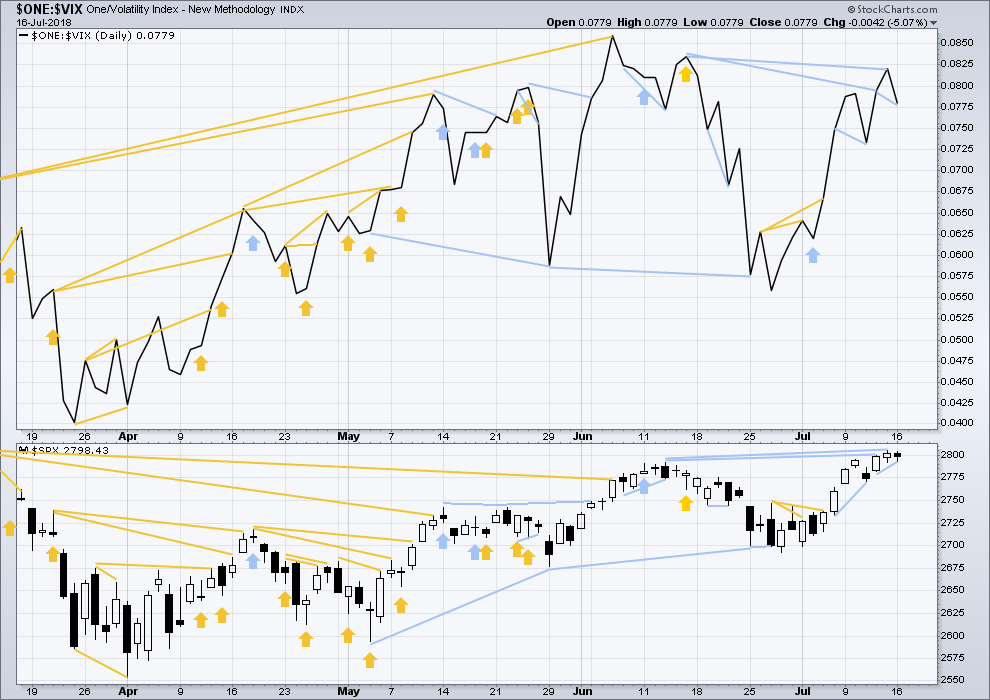
Click chart to enlarge. Chart courtesy of StockCharts.com. So that colour blind members are included, bearish signals
will be noted with blue and bullish signals with yellow.
Normally, volatility should decline as price moves higher and increase as price moves lower. This means that normally inverted VIX should move in the same direction as price.
There is new short term bearish divergence today between price and inverted VIX: Inverted VIX has made a new low below the low of two sessions prior, but price has not. This may be resolved by one or two days of downwards movement, and it supports the new hourly Elliott wave count.
BREADTH – AD LINE
WEEKLY CHART
Click chart to enlarge. Chart courtesy of StockCharts.com.
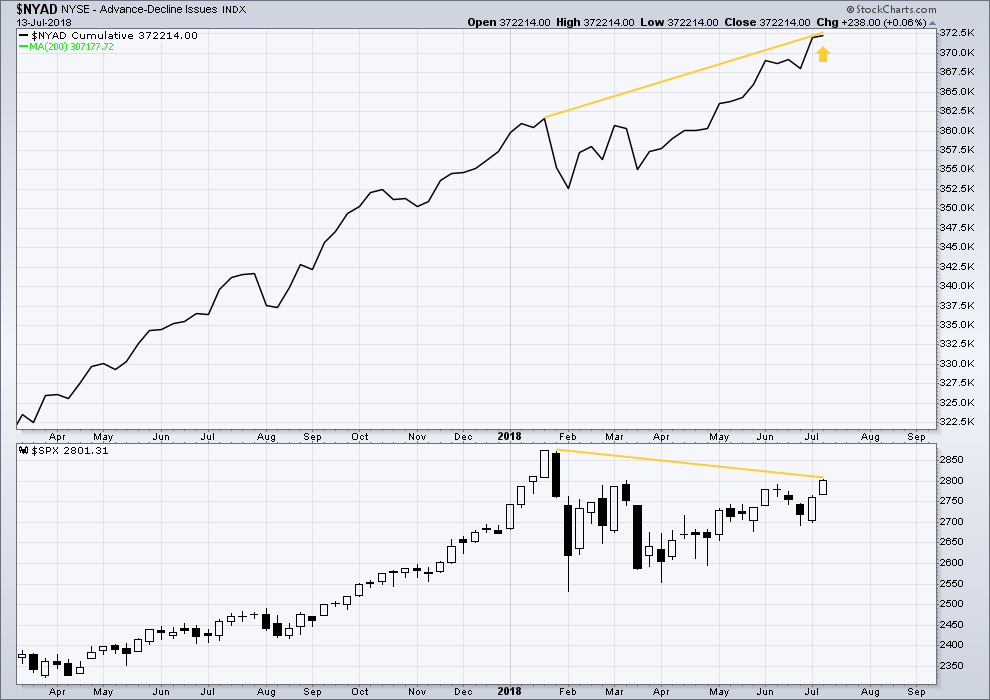
When primary wave 3 comes to an end, it may be valuable to watch the AD line at the weekly time frame as well as the daily.
At this stage, there is very strong bullish divergence between price and the AD line at the weekly time frame. With the AD line making new all time highs, expect price to follow through with new all time highs in coming weeks.
DAILY CHART
Click chart to enlarge. Chart courtesy of StockCharts.com.
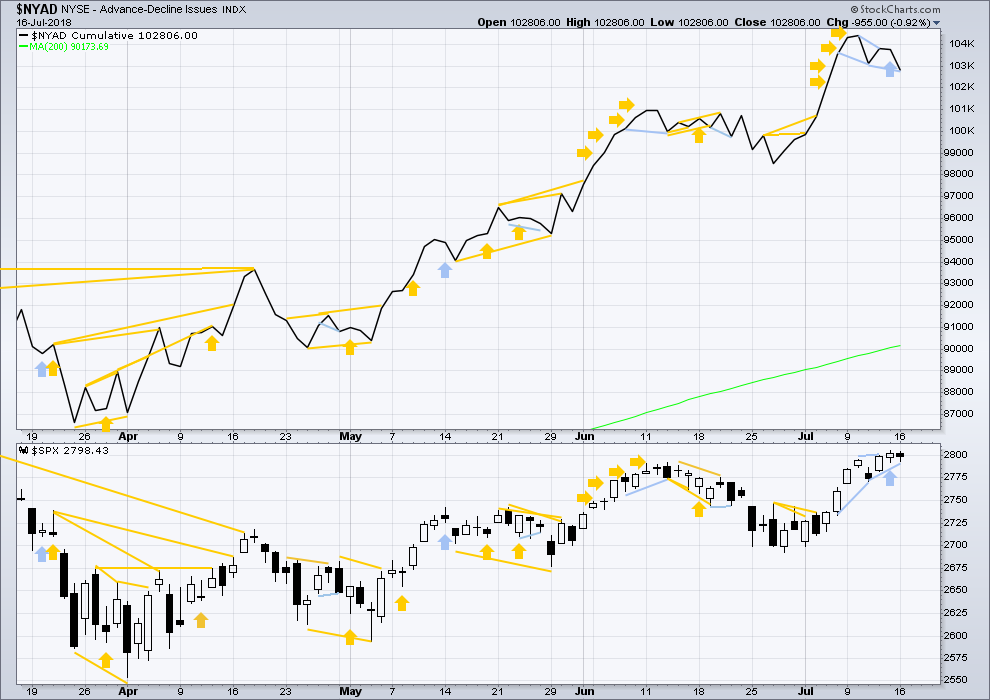
There is normally 4-6 months divergence between price and market breadth prior to a full fledged bear market. This has been so for all major bear markets within the last 90 odd years. With no longer term divergence yet at this point, any decline in price should be expected to be a pullback within an ongoing bull market and not necessarily the start of a bear market. New all time highs from the AD line means that any bear market may now be an absolute minimum of 4 months away. It may of course be a lot longer than that. My next expectation for the end of this bull market may now be October 2019.
Breadth should be read as a leading indicator.
Overall, recent new all time highs from the AD line remain extremely bullish for the longer term trend.
Price may reasonably be expected to follow through in coming weeks.
There is new short term bearish divergence today between price and the AD line: the AD line has made a new low below the low three sessions prior, but price has not. This may be resolved by one or two days of downwards movement, and it supports the new hourly Elliott wave count.
DOW THEORY
The following lows need to be exceeded for Dow Theory to confirm the end of the bull market and a change to a bear market:
DJIA: 23,360.29.
DJT: 9,806.79.
S&P500: 2,532.69.
Nasdaq: 6,630.67.
Only Nasdaq at this stage is making new all time highs. DJIA and DJT need to make new all time highs for the ongoing bull market to be confirmed.
Charts showing each prior major swing low used for Dow Theory may be seen at the end of this analysis here.
Published @ 10:24 p.m. EST.

I notice that Nasdaq finished the session very strongly indeed, to another new ATH
I’m currently in the middle of doing a bunch of research into Elliott wave corrective structures. So far I’ve done a wave count (to daily chart level) back to the 1970’s for Gold, and noted every single corrective structure I can find, lengths of waves, total depth of correction.
My aim is to provide a ranking of probability for each structure, and a range of wave lengths and total correction depth for all. Based upon empirical data.
So far the biggest take I have (without yet analysing the raw data) is zigzags are by a very wide margin the most common structure. Which I think we already knew, but it’s nice to have actual data.
It’s occurred to me though that I can’t base this on only Gold. Nor only one commodity. I need at least two commodities, two indices and two currencies to have a reasonable spread of data over different market types to determine averages. And I can then see differences between the different market types.
So the process continues. As I have each lot of data analysed I’ll share it all with you here.
ABBV taking it on chin today… Today’s red candle has a long upper wick. Not sure if today is a reversal day, going back to test the low 90’s, or just a correction… the move from 90.81 on 6/28/18 to today’s high of 97.16 has been pretty impressive though 🙂
Thanks Kevin for the heads up on this stock!
Earnings are due ten days from today on 7/27/18
Best of luck cashing in on it Ari.
Main hourly count updated:
If there is any strength today in this upwards movement I shall label minuette (iv) complete.
If there is reasonable weakness today I shall consider the possibility it could continue sideways as a flat, combination or triangle.
For now let us err on the bullish side, with strong bullish signals from the AD line and On Balance Volume.
I’m not too concerned with the lack of alternation in structure between minuette (ii) and (iv). Alternation is a guideline, not a rule. There is a little alternation in the form, minuette (ii) was sharp and minuette (iv) more sideways. There is very good alternation in depth.
When the structure of second and fourth waves is the same, as it sometimes is, then they’re usually zigzags.
Well, in response to all the bearishness here, I will say that yes, I agree there is probably market manipulation afoot. And yes, this market is extreme and very over stretched.
And my larger picture wave count does expect a massive once in a multi generation change from bull to bear, coming up. So it does encompass your concerns, just not immediately.
Meanwhile, we have seen extreme market conditions now for many months. Yet price continued to march on higher up to the last all time high. Then a big sideways consolidation, and now again a slow march on higher.
Elliott wave, if done diligently, does seem to so far be somewhat useful in mapping out a pathway for us, and considering other possible pathways in alternates. So far I’m not seeing any market movement that does not fit the restrictive rules of Elliott wave.
Those doing the market manipulation are still part of society. They are still part of social mood. If the basic premise of Elliott wave is correct, then this market will only turn from bull to bear when the structure is complete and mood shifts to bearish. Maybe then the manipulation will be “outed” (although plenty of people must know what’s happening who are within the industry) in a very public way.
For myself and my work here, I would prefer to just focus on price and technicals, and the EW count. I do not yet see a complete structure, and I do not yet see divergence between price and the AD line and On Balance Volume. When this bull is fully mature there will be these things I shall be looking for.
What the weakness does tell us, particularly light and declining volume, is that when the bull is finally ready to roll over, there is very little support below. The resulting fall may be absolutely spectacular.
But I don’t think it’s upon us yet. Not for a while.
Just my two cents this beautiful morning.
It’s a beautiful summer day here in Minneapolis, too! (I know it’s winter where you are in NZ.)
Your “two cents” carries a lot of weight with me, Lara, and I agree completely. The coming plunge is WAY overdue. And, as you say, it’ll probably be absolutely spectacular when it happens. Until then, I don’t see much choice but to trade price action as my charts show it, according to my plan, with your analysis as an essential guide.
Thank you so much!
Thanks for the thoughts Lara, and I must say I very much appreciate your levelheadedness and ability to avoid the temptation of “reading the mind of the market”, so to speak.
As far as I know, both Elliott and Prechter maintained that market manipulation, computer algorithms, etc. should all be encompassed in social mood and thus there is no need to give them special consideration when building the basic wave structures from principles. In Elliott wave theory there is nothing but the wave analysis and price.
One question I do have is in regards to your assertion that all bear markets for the last 90-odd years have been preceded my multiple months of divergence between price and the AD line. Do you have a link from the archives in which you delve into that assertion in more detail?
I got that from Lowry’s.
Here’s a link to some of their research. I think the first paper may be the one that outlines it.
I also had it reinforced when I had a subscription to Lowry’s. I haven’t kept that subscription, because IMO it’s not so necessary in a bull market. When the market turns to bear I’ll get their daily subscription so I have access to their Power Rating data which may be very helpful in picking where bounces may occur.
Yes indeed. There is also now very steep momentum divergences in Nasdaq with these new highs. It is entirely possible they will be burned through if price continues to powe hiigher. An impulsive decline in Nasdaq could be a sign of a deeper correction ahead. The current divergence is much more oronounced than that which led to the last correction.
Buying July 25 12.00 strike VIX calls for 1.10. 100 contracts.
We have once again gone through the looking glass…!
I was tempted to sell a put spread to avoid the coms but this is beyond absurd people! 🙂
Nice, I like that trade. I’m joining you presently. Also, adding 9 over 7 UVXY put spread August expiration. (not trading advice)
Lara’s main count very much continuing to be fulfilled! Sad for those who don’t EW, as otherwise everything about the chart up to today screamed “pullback time!”. Even got me thinking perhaps it was. Whoops for them.
After the next target for a turn at the 1.282% (2819), there’s empty air until the 1.618 extension at 2853. After all, SPX is only up about 0.5% today. It isn’t really MOVING yet, and as this gets into 3 of 3 type of action, it “should”.
My daily trend indicator has only today switched to “uptrend”. Love to see green daily bars.
The gray areas are what I project as high potential turn zones. The highest being the ATH level of course.
Despite what the banksters would have you believe, this nothing more than a dead cat bounce in NFLX. Real support is a long way down. 400 strike puts now less than half what they traded for this morning. Reloading….
Shorts are now getting squeezed hard. Think about how much short interest in the market waiting for the “obvious” fall from 2800 area. Where are all the stops on that short interest? 2805-2810. Kindling for the bull fire!!!
Just think how many shorts have their stops just above 2873. I suspect it is massive.
There are virtually no shorts; 54 percent of hedge funds have close the last 2yrs. Money is the most levered long in all of history. Record withdrawals and redemptions; its literally the most unbalanced, over concentrated, overvalued capital market that has ever existed
It was enough short stops relative to current conditions to help the market motor through and past the resistance. Just the normal tinder. I didn’t mean to suggest there was any historic high of shorts around.
Nope, none covered Kevin. In fact, 13,606,982 of new SPY shorts as of today at 2:36pm. This going to continue to the point were you will finally recognize that this market is beyond not real, and beyond manipulated. Clearly, Verne and I are going to sound the alarm until the day it occurs, but being armed with the truth and good strong data and process is all one has to go off of.
And the functional value of your data (or view point or whatever we want to call it) is what exactly? How should I be trading differently (or be trading in general) because the market is “not real” and “beyond manipulated”? I’m all ears. How does the “fact” of market manipulation as you see it translate pragmatically to trading edge?
The functional value and edge is in the data and data analysis. Was not claiming or inferring how you should be trading. Merely trying to add value through transparency.
Okay, so it’s an interesting theory. But not of any pragmatic significance that you can explain to me.
About the only pragmatic thing I can extract from this is that the market is vastly overvalued. I couldn’t agree more. That’s not particularly relevant to me, day to day, though obviously at some point in the future, it will be, and I’m ready to deal with it as it becomes what I will characterize as an opportunity. I trust in Lara’s work combined with market observation to inform me in time that the bubble is approaching “pop-ness”.
Actually not very many shorts in this market. There was virtually no push back on the 2800 pivot fight, no serious move higher in VIX, and not the kind of volume one would expect with shorts bailing. Something else may be afoot methinks….
We have now really gone through the looking glass. I guess market makers now feel they are entitled to offer you whatever they feel like for in-the-money option contracts regardless of the price of the stock underlying the option. I am sure they will try to justify this with some lame excuse about the VIX smothered price. We fired off a very strong protest to Jay Clayton.
They are doing a trial run for the coming market carnage and if option traders don’t call them out, the misconduct will continue and become even more egregious. Incredible!
Keep an eye on Nasdaq…an awful lot of “smoke and mirrors” going on there. The other indices likely to follow its lead…up or down….
A good point. It has the appearance lately of being the leader here.
First to make new all time highs.
Now it’s down today. That may support the idea that minuette (iv) for the S&P may not be over.
NDX closed up for the day, on a big green (white) soldier, and a reversal day type bar. I view it as very bullish.
GS absolutely crushes, they are virtually printing money, and income and profits way above estimates. And the stock sells of by 1.5%. Very interesting. I can’t say I understand it. Last quarter it was similar, and the word was “too much profit from trading operations, not sustainable”. Don’t know what the issue is this quarter.
The minuette iv appears complete to me, and the action indicates the minuette v is kicking off. The combination of price getting to fresh highs and the macd on the hourly swinging to positive will confirm it for me. Notice that there’s several hours of squeeze on the hourly as well, and price is breaking up out of that. Don’t be surprised by some strong upward action in the next few days.
Next stop 2819-22.
Classic “Shake the Trees” price action in Nasdaq and NQ…..impressive isn’t it?
If you ever had any doubt regarding how massive market exits are being covered just take a look at what is going on with Nasdaq this morning. NQ is even more ludicrous. We are talking billions!!!
Absolutely unbelievable!!!
Once again gangster market makers are trying rip off the posse by refusing to offer intrinsic value for our in the money puts. We are very seriously considering exercising the put options. These people are criminals!!!!
Those very market makers; Citadel and Susquehanna and Jane st do the bidding of the central banks…..exercise um!!!
we came REAL close to that this morning dude…a bit hesitant to tie up sp much capital with ba beast like NFLX. At least we finally got intrinsic value. I think they knew it was going to get ramped…slick! very slick indeed! 🙂
The banksters are determined to defend DJI 25K and SPX 2800. Their problem just componded with the unfolding tech weakness. They are going to have to spend a LOT more. We could see more sideways action as the battle rages. Continued tech weakness will see a rapid fall away from these levels imho.
Have a great trading day everyone. We will be closely monitoring a fairly wide NFLX bear call spread today for any signs of misbehaviour!
😀
Selling 400 strike puts of NFLX earnings straddle at the open. Selling 350 calls against 400 calls of straddle for converted bear call spread. Adding to TZA 9.00 strike calls for full position, August 3 expiration.
Nice trade on Netflix, Verne. That was quick and simple. As far as SPX and US equities in general, I am looking for the pause that refreshes. This week will provide the pullback necessary to regroup and re-energize for the assault on 2800 and the subsequent move to Lara’s target of 2878. At that point I may consider lightening up on some of my leveraged long positions.
Have a great day all.
Thanks Rod. A little frustrated as market makers , aka banksters, are always trying to rip off option traders on the earnings pops. We bite the bullet and pay the inflated premiums ahead of earnings and then they refuse to pay even intrinsic value, much less premium, of the in- the-money options after the earnings report. Not right! 🙁