Overall, upwards movement was expected from the main Elliott wave count.
Summary: It is still possible that before this pullback is done one more low may be seen Monday or Tuesday.
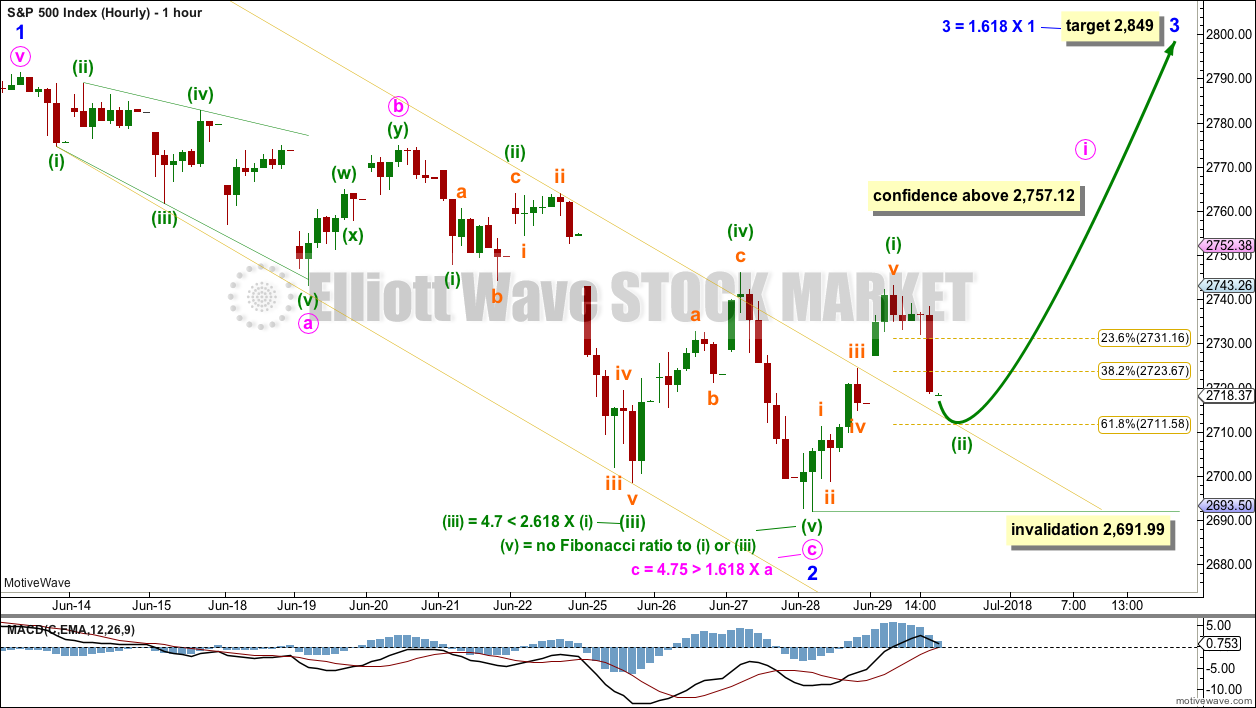
A new high above 2,757.12 would provide confidence that a low is in place. The target would then be about 2,849; a consolidation lasting about two weeks may be expected at about this target.
The invalidation point must remain at 2,594.62.
The mid to longer term target is at 2,922 (Elliott wave) or 3,045 (classic analysis). Another multi week to multi month correction is expected at one of these targets.
The final target for this bull market to end remains at 3,616.
Pullbacks are an opportunity to join the trend.
Always practice good risk management. Always trade with stops and invest only 1-5% of equity on any one trade.
New updates to this analysis are in bold.
The biggest picture, Grand Super Cycle analysis, is here.
Last historic analysis with monthly charts is here, video is here.
ELLIOTT WAVE COUNT
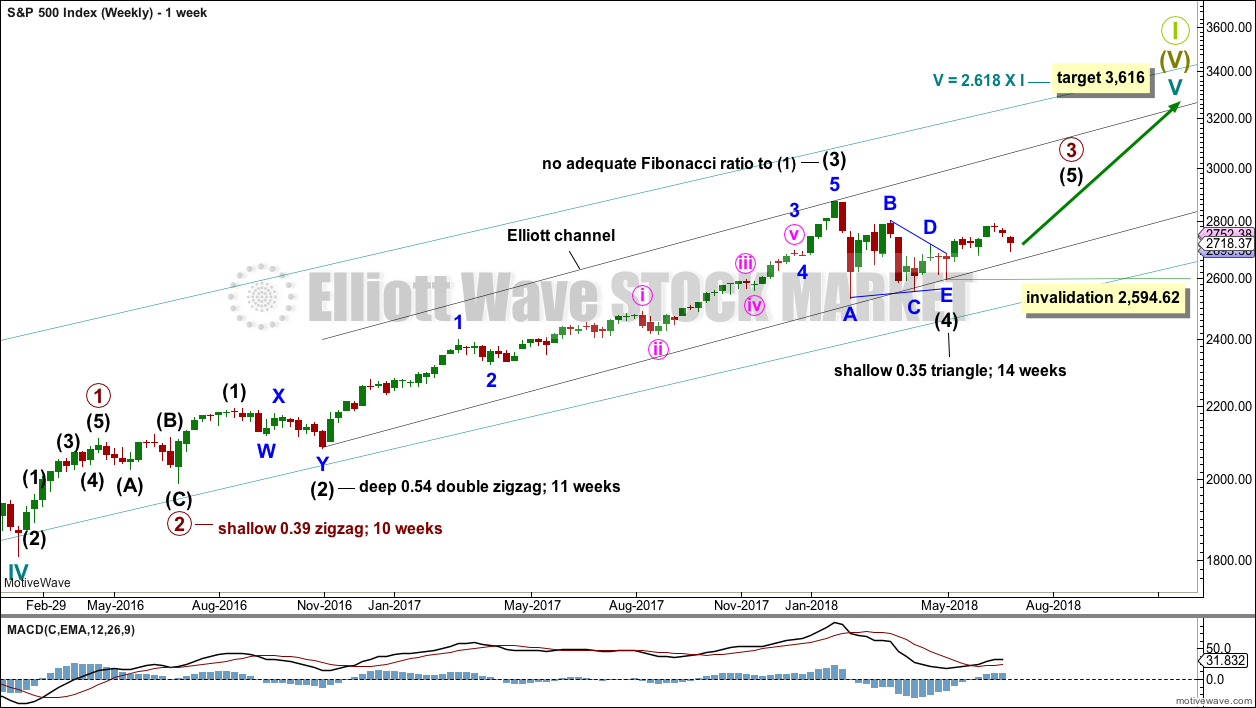
WEEKLY CHART
Cycle wave V must complete as a five structure, which should look clear at the weekly chart level and also now at the monthly chart level. It may only be an impulse or ending diagonal. At this stage, it is clear it is an impulse.
Within cycle wave V, the third waves at all degrees may only subdivide as impulses.
Intermediate wave (4) has breached an Elliott channel drawn using Elliott’s first technique. The channel is redrawn using Elliott’s second technique: the first trend line from the ends of intermediate waves (2) to (4), then a parallel copy on the end of intermediate wave (3). Intermediate wave (5) may end either midway within the channel, or about the upper edge.
Intermediate wave (4) may now be a complete regular contracting triangle lasting fourteen weeks, one longer than a Fibonacci thirteen. There is perfect alternation and excellent proportion between intermediate waves (2) and (4).
Within intermediate wave (5), no second wave correction may move beyond the start of its first wave below 2,594.62.
DAILY CHART
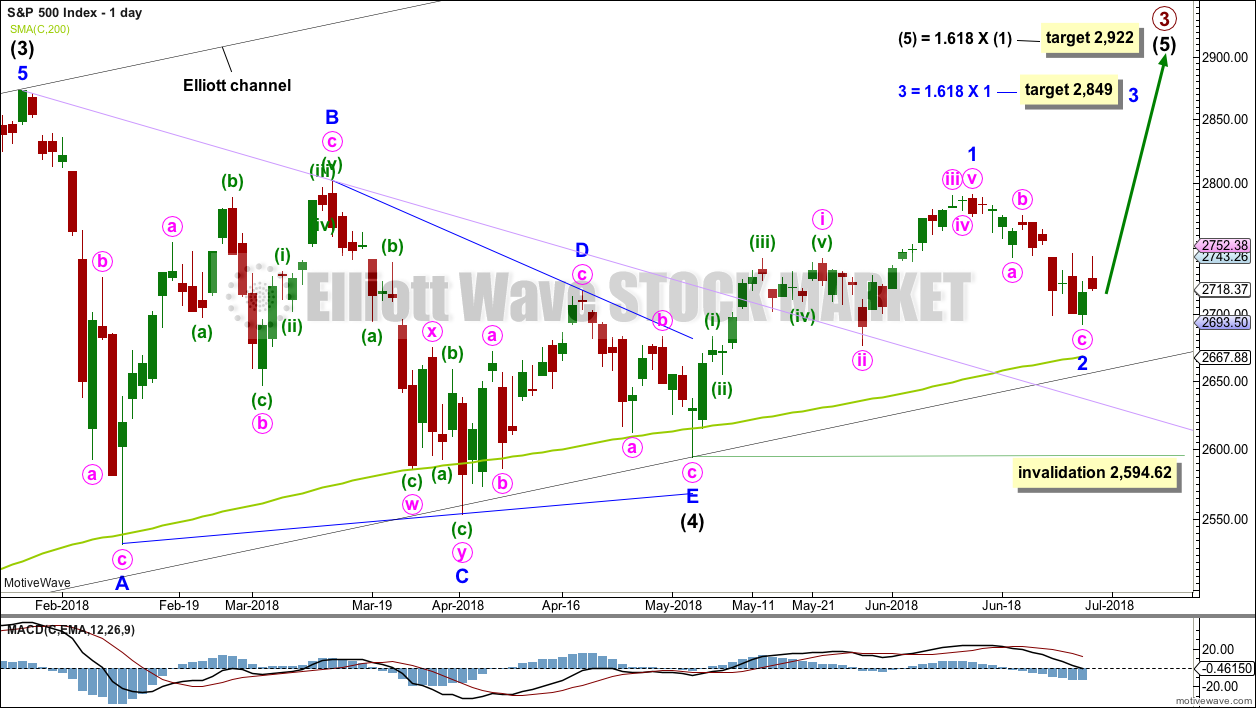
It is possible that intermediate wave (4) is a complete regular contracting triangle, the most common type of triangle. Minor wave E may have found support just below the 200 day moving average and ending reasonably short of the A-C trend line. This is the most common look for E waves of triangles.
Intermediate wave (3) exhibits no Fibonacci ratio to intermediate wave (1). It is more likely then that intermediate wave (5) may exhibit a Fibonacci ratio to either of intermediate waves (1) or (3). The most common Fibonacci ratio would be equality in length with intermediate wave (1), but in this instance that would expect a truncation. The next common Fibonacci ratio is used to calculate a target for intermediate wave (5) to end.
Price has clearly broken out above the upper triangle B-D trend line. This indicates that it should now be over if the triangle is correctly labelled.
A trend line in lilac is added to this chart. It is the same line as the upper edge of the symmetrical triangle on the daily technical analysis chart. Price found support about this line.
Minor wave 1 may have been over at the last high. Minor wave 1 will subdivide as a five wave impulse on the hourly chart; the disproportion between minute waves ii and iv gives it a three wave look at the daily chart time frame. The S&P does not always exhibit good proportions; this is an acceptable wave count for this market.
It looks like minor wave 2 for this first daily wave count should be over here. The structure at lower time frames looks complete.
A target is calculated for minor wave 3 to end.
Minor wave 2 may not move beyond the start of minor wave 1 below 2,594.62.
HOURLY CHART
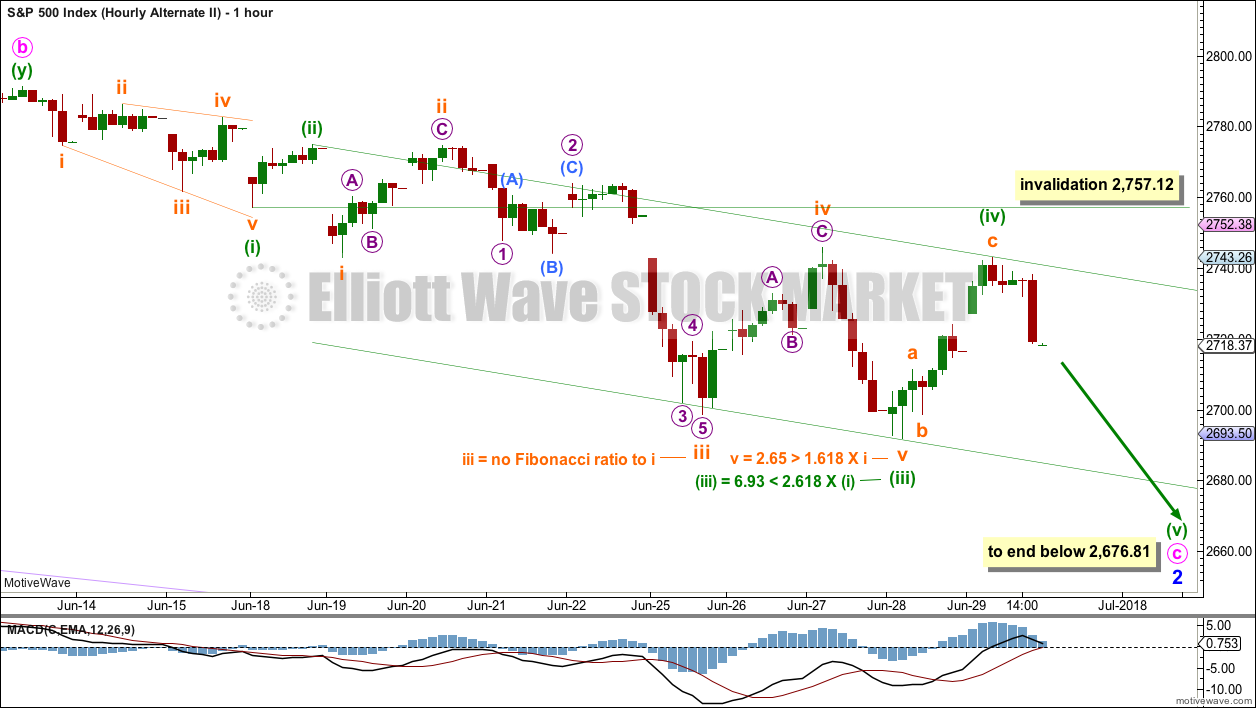
Minor wave 2 may now be a complete zigzag; all subdivisions fit for a 5-3-5 downwards. A best fit channel is drawn about this downwards movement. The channel is now breached, giving a first indication that a low may be in place. A new high now above 2,757.12 would add confidence that a low is in place.
Minuette wave (ii) may not move beyond the start of minuette wave (i) below 2,691.99.
ALTERNATE DAILY CHART
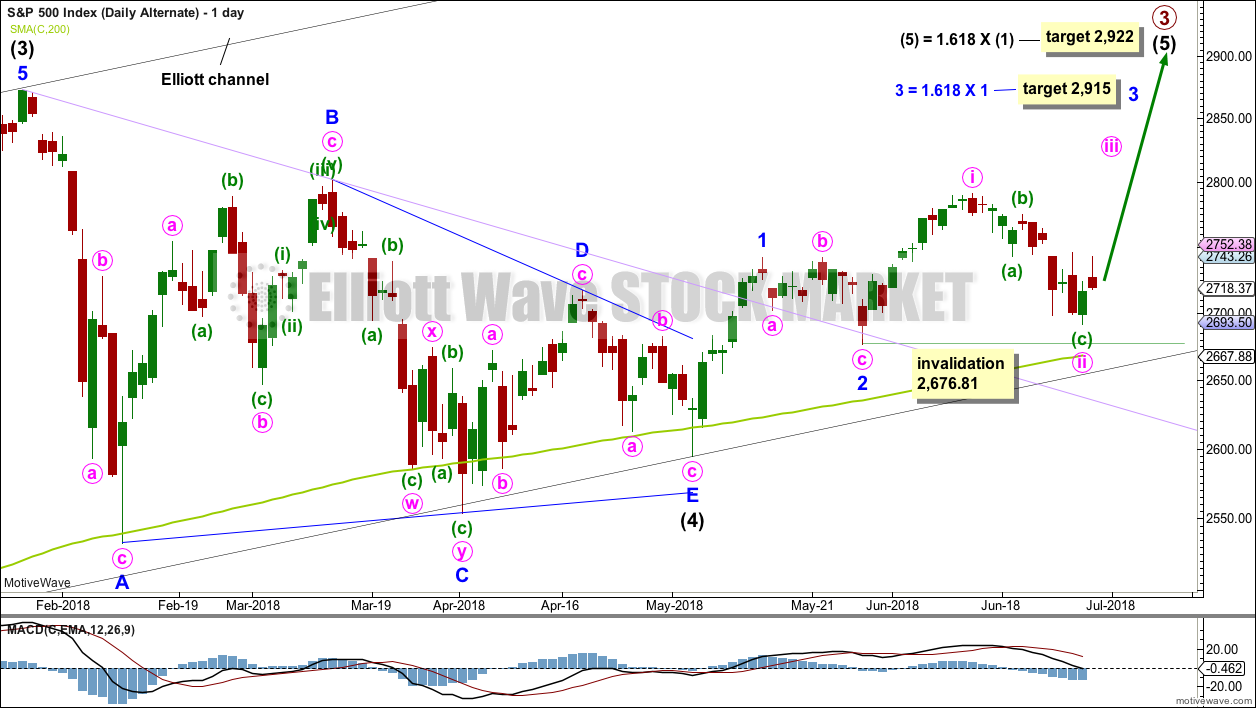
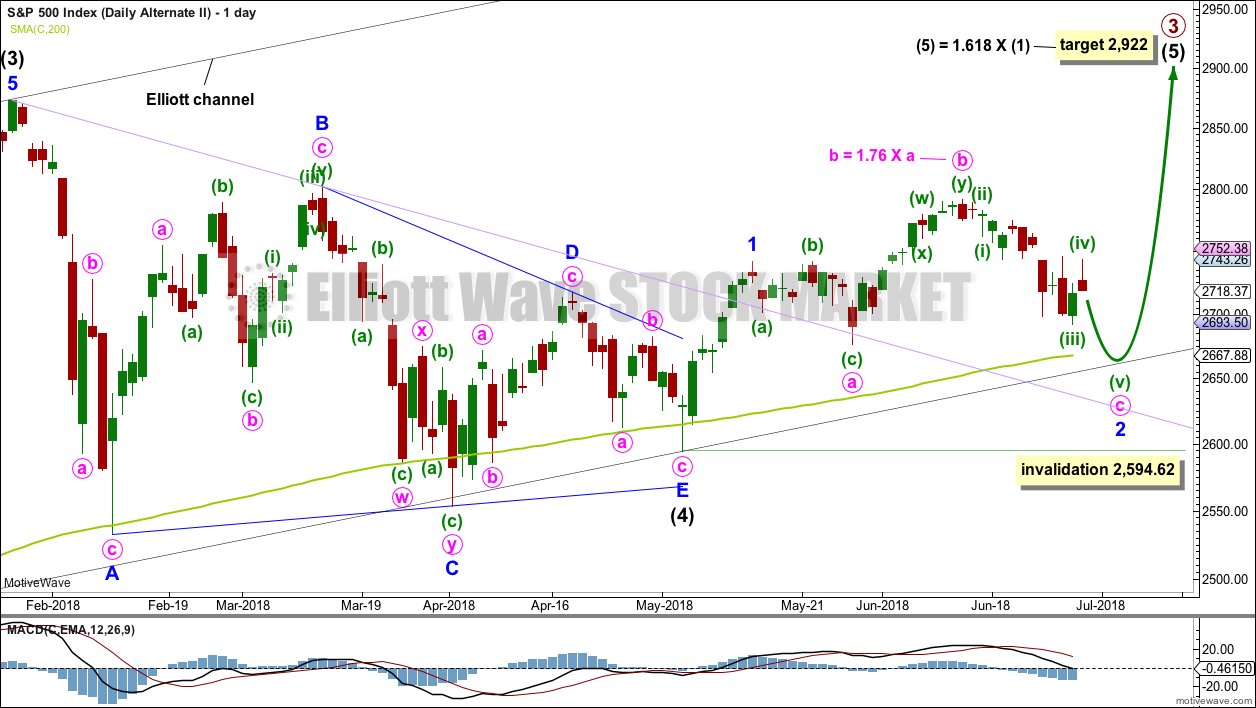
It is possible that minor waves 1 and 2 are already over. The last high may have been minute wave i. Minute wave ii may need one more low to be complete.
Minute wave ii may not move beyond the start of minute wave i below 2,676.81.
This alternate wave count resolves the problem of an odd looking minor wave 1 for the main wave count. The only problem with this alternate wave count is minute wave ii is not contained within a base channel which would be drawn about minor waves 1 and 2.
This wave count is very bullish. It expects to see a very strong upwards movement as the middle of a third wave begins here.
SECOND ALTERNATE DAILY CHART
It is also still possible that minor wave 1 ended earlier and current downwards movement is the end of an expanded flat correction for minor wave 2.
The 0.618 Fibonacci ratio of minor wave 1 here would be about 2,651. This would be very slightly below the lower edge of the black Elliott channel and slightly below the 200 day moving average.
This second alternate wave count expects a somewhat deeper pullback about here to make a new low below the end of minute wave a at 2,676.81, so that minute wave c avoids a truncation and minor wave 2 avoids a running flat correction.
Minor wave 2 may not move beyond the start of minor wave 1 below 2,594.62.
SECOND ALTERNATE HOURLY CHART
A re-analysis of minute wave c downwards gives a new way to label this impulse. Minuette wave (i) may have ended earlier. This leading expanding diagonal still meets all Elliott wave rules, but the end of subminuette wave ii is truncated. This reduces the probability of this wave count.
A channel is drawn about this possible impulse using Elliott’s second technique. Minuette wave (v) may end either mid way within the channel, or about the lower edge.
Minute wave c would be very likely to make at least a slight new low below 2,676.81 to avoid a truncation and a very rare running flat.
Minuette wave (iv) may not move into minuette wave (i) price territory above 2,757.12.
TECHNICAL ANALYSIS
WEEKLY CHART
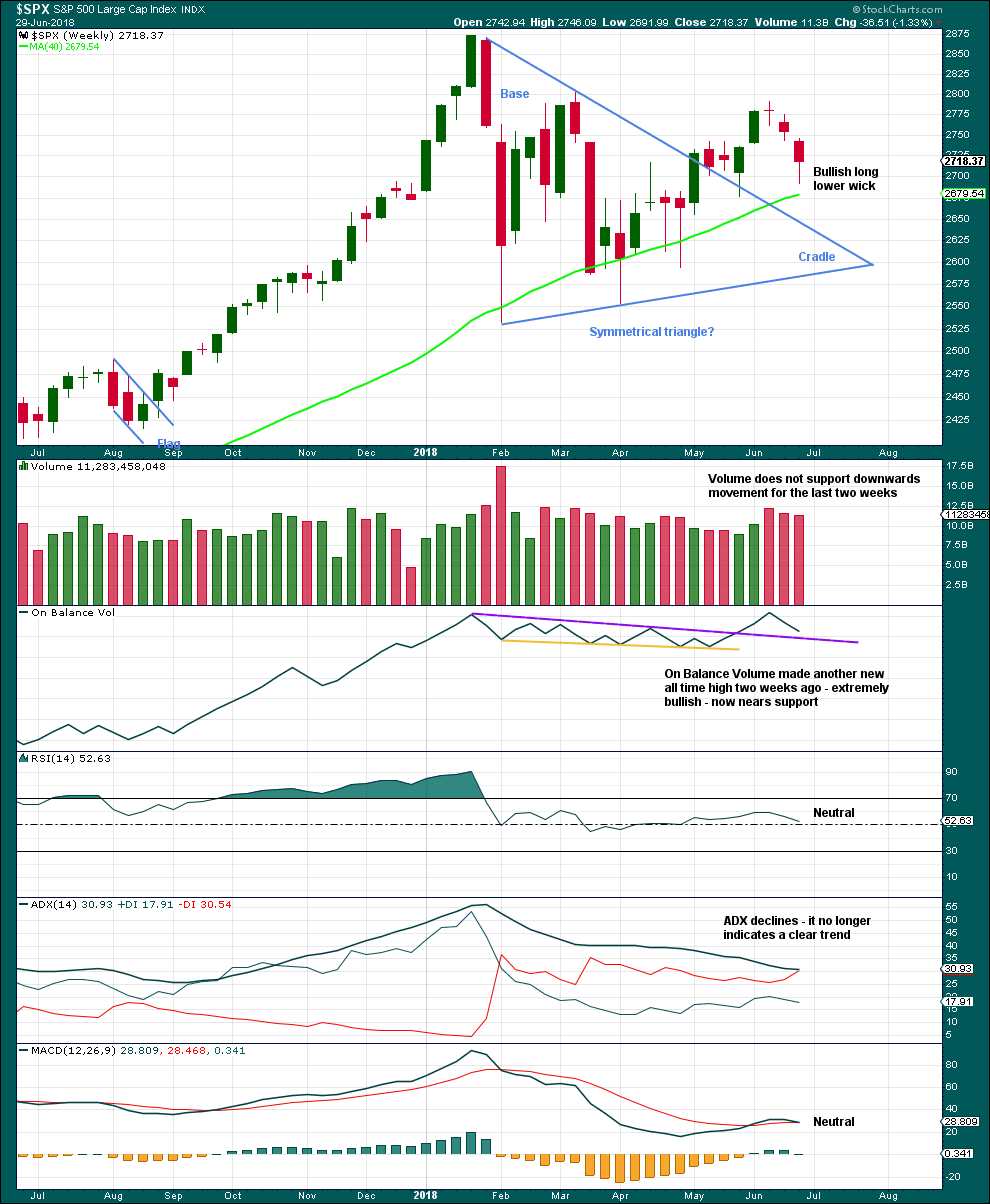
Click chart to enlarge. Chart courtesy of StockCharts.com.
Downwards movement of the last two weeks still looks most likely as a pullback within a developing upwards trend. Long lower candlestick wicks, a lack of support from volume, and nearby support from On Balance Volume all look bullish.
DAILY CHART
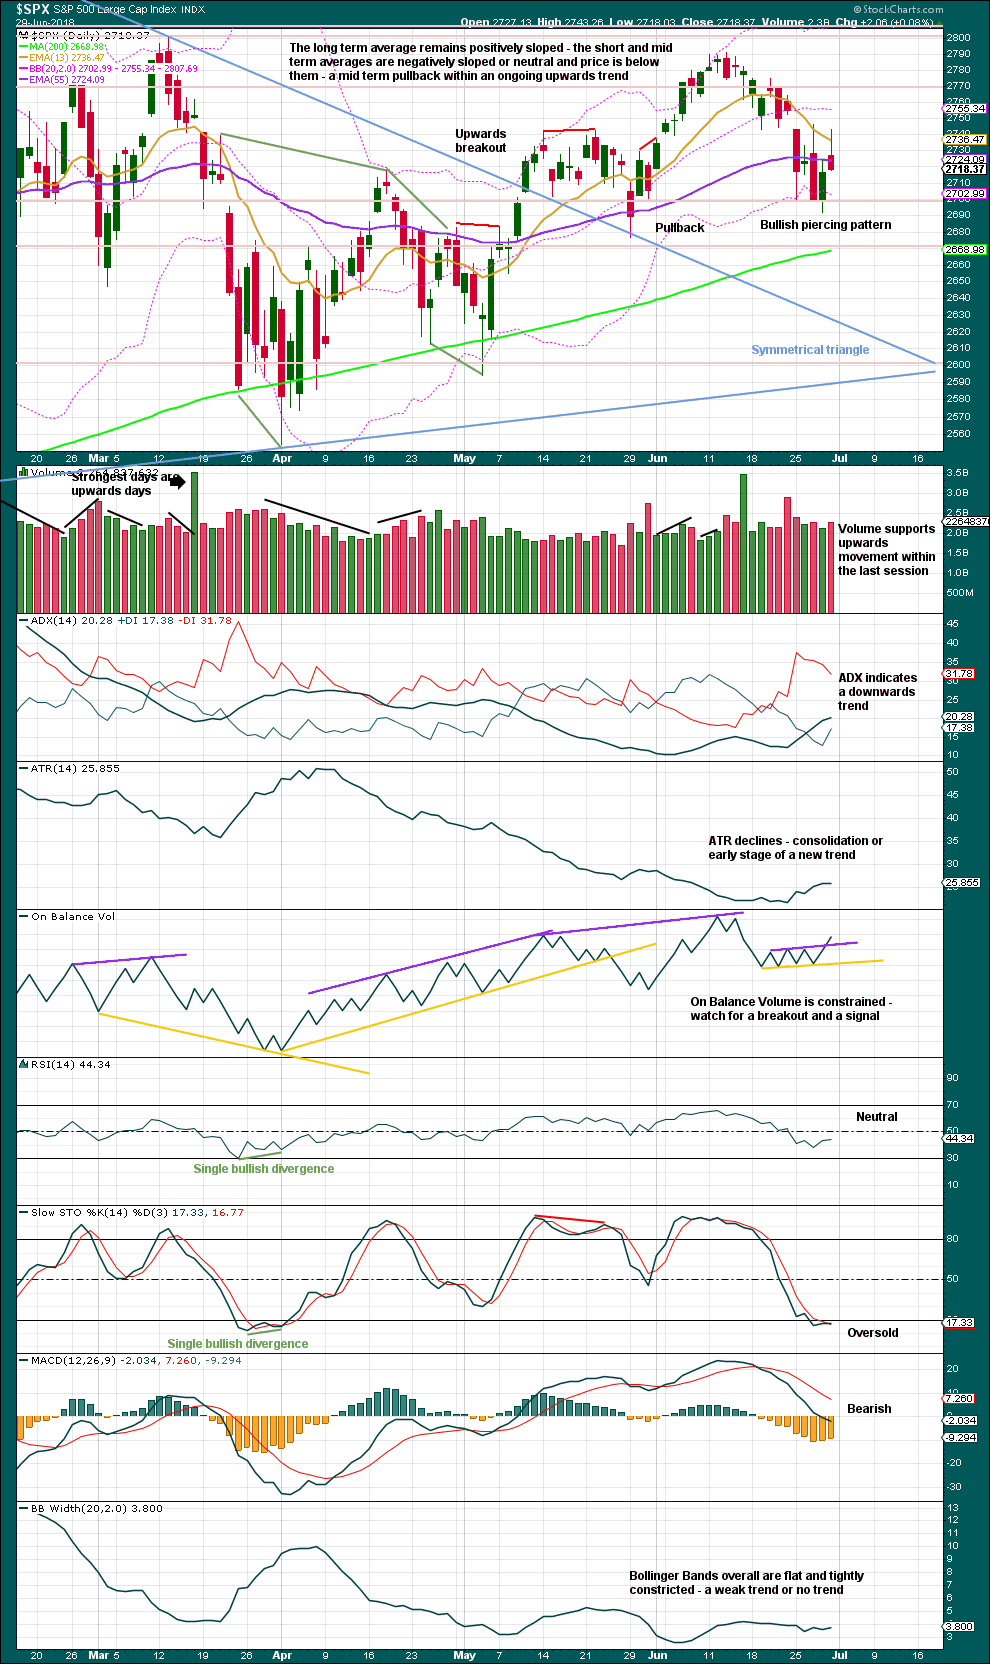
Click chart to enlarge. Chart courtesy of StockCharts.com.
The symmetrical triangle may now be complete. The base distance is 340.18. Added to the breakout point of 2,704.54 this gives a target at 3,044.72. This is above the Elliott wave target at 2,922, so the Elliott wave target may be inadequate.
Since the low on the 2nd of April, 2018, price has made a series of higher highs and higher lows. This is the definition of an upwards trend. But trends do not move in perfectly straight lines; there are pullbacks and bounces along the way. While price has not made a lower low below the prior swing low of the 29th of May, the view of a possible upwards trend in place should remain. Note though that the second alternate Elliott wave count allows for a new swing low yet expects a third wave upwards to begin from there. This is entirely possible.
A bullish signal on Friday from On Balance Volume suggests a low may now be in place. However, Friday’s candlestick is bearish: although it moved price higher, the candlestick closed red and has a very bearish long upper wick. This should not be read as a bearish Shooting Star reversal pattern though, because for a candlestick to be read as a reversal pattern it needs to come after a trend. In this case, Friday’s candlestick does not come at the end of an upwards wave; there is no upwards wave to reverse.
If a low is not already in place, then it should be expected to be in place very soon.
VOLATILITY – INVERTED VIX CHART
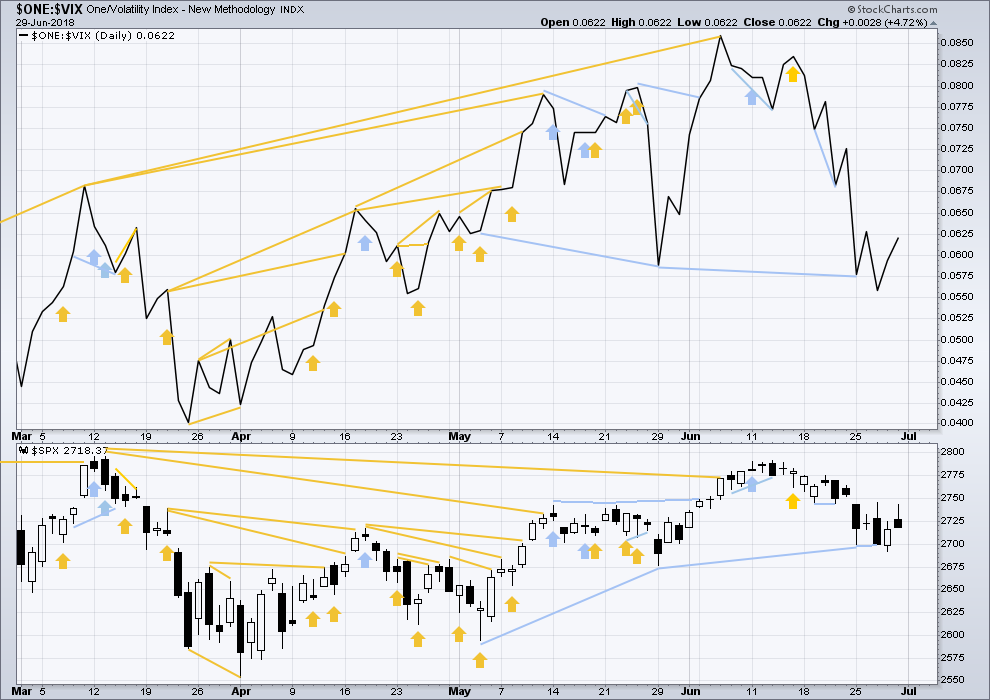
Click chart to enlarge. Chart courtesy of StockCharts.com. So that colour blind members are included, bearish signals
will be noted with blue and bullish signals with yellow.
Normally, volatility should decline as price moves higher and increase as price moves lower. This means that normally inverted VIX should move in the same direction as price.
Inverted VIX has made a new high above the prior swing high of the 9th of March, but price has not made a corresponding new swing high about the same point yet. This divergence is bullish. Inverted VIX is still a little way off making a new all time high.
There is mid term bearish divergence between price and inverted VIX: inverted VIX has made a new swing low below the prior swing low of the 29th of May, but price has not. Downwards movement has strong support from increasing market volatility; this divergence is bearish. However, it must be noted that the last swing low of the 29th of May also came with bearish divergence between price and inverted VIX, yet price went on to make new highs.
This divergence may not be reliable. As it contradicts messages given by On Balance Volume and the AD line, it shall not be given much weight in this analysis.
There is no new divergence between inverted VIX and price today.
BREADTH – AD LINE
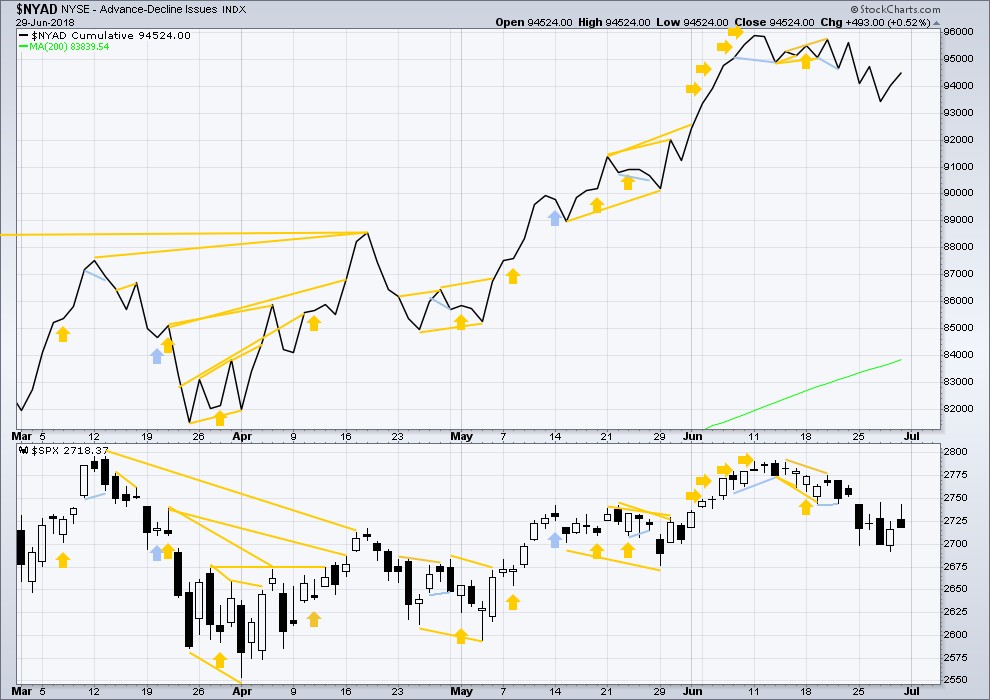
Click chart to enlarge. Chart courtesy of StockCharts.com.
There is normally 4-6 months divergence between price and market breadth prior to a full fledged bear market. This has been so for all major bear markets within the last 90 odd years. With no longer term divergence yet at this point, any decline in price should be expected to be a pullback within an ongoing bull market and not necessarily the start of a bear market. New all time highs from the AD line means that any bear market may now be an absolute minimum of 4 months away. It may of course be a lot longer than that. My next expectation for the end of this bull market may now be October 2019.
Small caps and mid caps have both recently made new all time highs. It is large caps that usually lag in the latter stages of a bull market, so this perfectly fits the Elliott wave count. Expect large caps to follow to new all time highs.
Breadth should be read as a leading indicator.
There is no new divergence today between price and the AD line.
Overall, the AD line still remains mostly bullish as it has made more than one new all time high last week. Price may reasonably be expected to follow through in coming weeks.
DOW THEORY
The following lows need to be exceeded for Dow Theory to confirm the end of the bull market and a change to a bear market:
DJIA: 23,360.29.
DJT: 9,806.79.
S&P500: 2,532.69.
Nasdaq: 6,630.67.
Only Nasdaq at this stage is making new all time highs. DJIA and DJT need to make new all time highs for the ongoing bull market to be confirmed.
Charts showing each prior major swing low used for Dow Theory may be seen at the end of this analysis here.
Published @ 02:42 a.m. EST on 30th June, 2018.

sorry again everybody for not being here earlier.
as Kevin notes, nothing is resolved. but today has ended very bullish. closing almost at highs is very bullish, expect at least a gap higher tomorrow if not another green candlestick.
both EW counts at the hourly chart level remain valid
nothing is resolved…but that’s a reasonably bullish day nonetheless.
neckline slopes down…. does it matter?
???
The only thing that’s important is whether price manages to break and move up and away from that neckline, no matter how revealing it may be, (kersplash!).
That’s it, we need a clean joke competition. How about this: why did all 3 of the prior drummers in the band explode? Because it drums in the family!!
Why did the punk rocker cross the road? Because he had a chicken stapled to his face.
How many guitar players does it take to screw in a light bulb? 21…one to screw in the light bulb, and 20 to stand around and say “I can do that!”.
Yea, all I’ve got is stupid band jokes.
Bullish indications: on the hourly, two higher swing lows, and the intervening high has now been exceeded: technically a polarity inversion to “up”. The gap is filled and price is now above it. What’s needed is a push through the two 2746 area pivot highs, and maybe this excruciating minor ii is over. But without that final piece in place…it’s not yet in my view and there’s still loads of downside risk. Maybe price just meanders 2700-2745 all this week.
SPX is setting up a potential head and shoulders bottom here. 2646 is the neckline, and could be an interesting buy point a break through. If anyone wants to get on a minor 3 on the fairly early side.
Kevin, I’m gonna go ahead and guess, based on the tried and true assumption that the market will adopt the path that destroys the most capital, that we will see a rally above the 3 day high; somewhere around 2754ish before ultimately breaking the level where all the stops are around 2690ish. Just saying.
It has to be obvious to any rational observer that day to day indicators have become inconsistent at best, and un-reliable at worst, so far as near term price action is concerned. This market is in a very fragile state and imho should be approached with extreme caution. FWIW, long lower wicks are more meaningful at ths END of clear downtrends. Clearly lots of capital is being expended to defend SPX 2700 and DJI 24K pivots. As has been noted, that outcome remains unclear. I think SPX 2720 and 2750 remain key. Have a great evening everyone!
SPX monthly is crossing to “down” on standard MACD and stochasticRSI.
June’s monthly bar is a spinning top. On /ES, it similar but with a longer upper tail.
On the other hand, my combined CCI/ADX trend indicator is still showing “up trend”.
Just data. Overall, I see way more downside “potential” (risk) than upside potential. Until we see some kind of fresh bullish impulsive action. What may show up sooner is bearish impulsive action. I’m assessing large hedging options, myself.
If you are starting to think some market techinal signals are somewhat askew, you could be correct. Such is the nature of the beast in Q.E. juiced equities markets. I did not think the banksters were serious about their claims to move from Q.E. to Q.T. but it is possible I was wrong on that score. Market price action appears to be responding closely to their stated Q.T. schedule.
I have found it helpful of late to pay very close attention to pitched battles around specific price pivots.
Another way to look at consolidation is as a contest to determine whether gains, or LOSSES, will be sustained. Battles lost around these firecely contested pivots almost always lead to more movement in the direction from which consolidation initiated, in the form of break-outs, or break-downs. Of course, nothing in life is ever that simple is it? We still have to contend with the occasional false break!
I think we have one more low ahead.
Note that Monday’s expiry SPX options have an expected move of +/- 22 SPX points. Friday’s expiry SPX options have an expected move of +/1 42 SPX points!!
Prior weeks the friday expected move on Mondays has been running 22-30 pts, so the option market is signalling large price moves this week, and it’s hard to believe that it’s likely to be upside action, given the US political and economic situation.
And surprise, moving down from the current price of 2718 by 42 points would put the SPX at exactly 2676, the May 3 pivot.
So again, don’t be surprised by a hard sell off here Monday/Tuesday, and watch out for up move head fakes before said sell of starts up.
Nice job Kevin!! Analysis is on point!
I’d like to buy buy buy at the bottom of a minor 2 wave. All I need to know is that price is “there”!! How hard can that be?
I don’t think we’ve seen it yet. Could be wrong, but the price pattern looks like there’s going to be more “backing and filling” here, and perhaps a final spike down reversal bar to shake out the final weak hands and set up a bull move.
2676.8, the May 3 pivot low, is a likely target for price before buyers start jumping on it hard. If price free falls to that level, that could be a excellent close stop low risk/super high return place to get an entry, if it turns and gives buy triggers.
Best of luck tomorrow to all. I expect a small range market trending sideways/down…i.e., no real change. But watch for the ending spike sell off! A move above Thursday’s high at 2746 probably signals the end of the minor 2, should that happen.