Last analysis expected upwards movement for Tuesday’s session. Price moved sideways in a small range to complete a doji candlestick, neither confirming nor invalidating yesterday’s analysis.
Summary: A small green doji lacking support from volume does not give convincing upwards movement today.
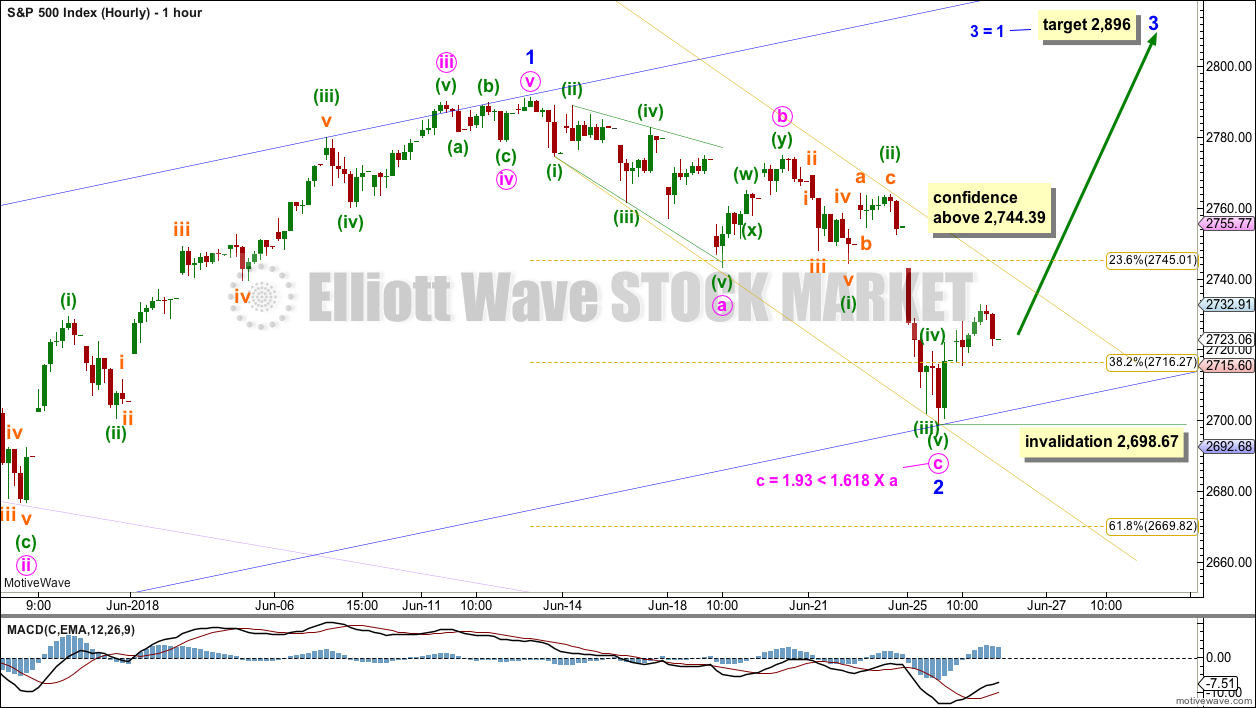
A new high above 2,744.39 would add confidence that a low is in place. The next wave up may be a third wave that should exhibit strong momentum. The target would be about 2,896 or 2,915.
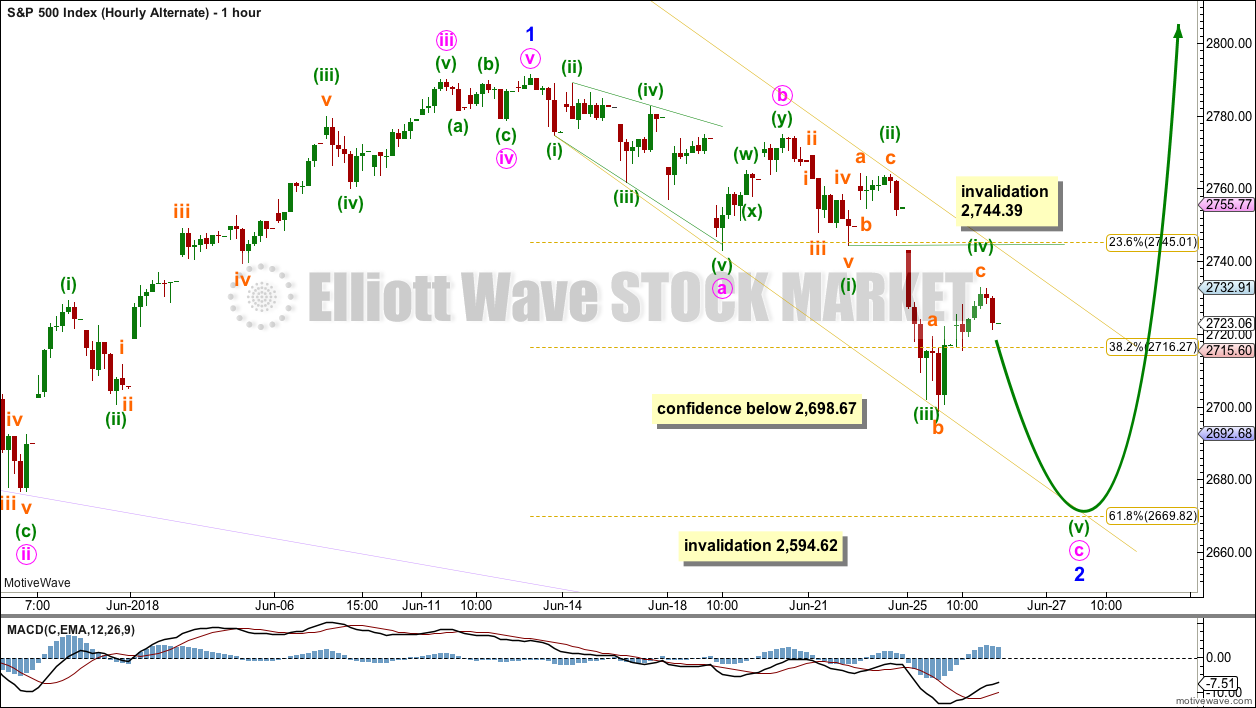
A new low tomorrow below 2,698.67 would indicate the pullback is not over. The target would be about 2,670.
The invalidation point must remain at 2,594.62.
The mid to longer term target is at 2,922 (Elliott wave) or 3,045 (classic analysis). Another multi week to multi month correction is expected at one of these targets.
The final target for this bull market to end remains at 3,616.
Pullbacks are an opportunity to join the trend.
Always practice good risk management. Always trade with stops and invest only 1-5% of equity on any one trade.
New updates to this analysis are in bold.
The biggest picture, Grand Super Cycle analysis, is here.
Last historic analysis with monthly charts is here, video is here.
ELLIOTT WAVE COUNT
WEEKLY CHART
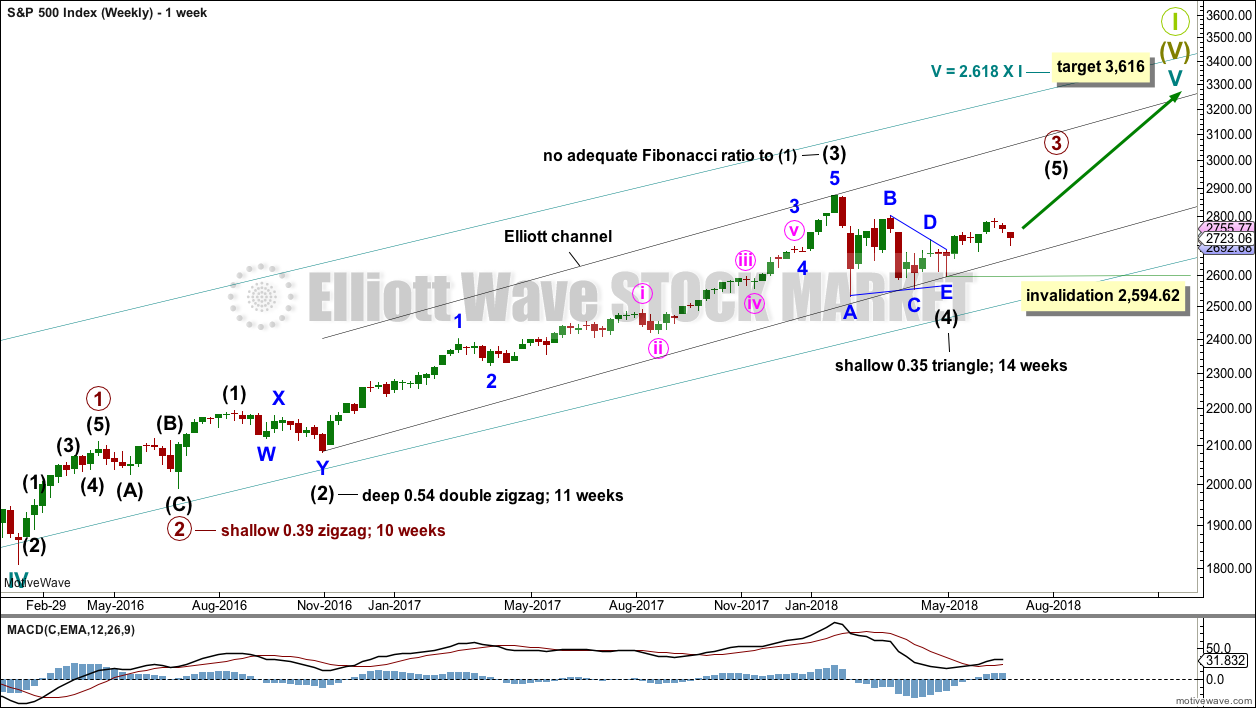
Cycle wave V must complete as a five structure, which should look clear at the weekly chart level and also now at the monthly chart level. It may only be an impulse or ending diagonal. At this stage, it is clear it is an impulse.
Within cycle wave V, the third waves at all degrees may only subdivide as impulses.
Intermediate wave (4) has breached an Elliott channel drawn using Elliott’s first technique. The channel is redrawn using Elliott’s second technique: the first trend line from the ends of intermediate waves (2) to (4), then a parallel copy on the end of intermediate wave (3). Intermediate wave (5) may end either midway within the channel, or about the upper edge.
Intermediate wave (4) may now be a complete regular contracting triangle lasting fourteen weeks, one longer than a Fibonacci thirteen. There is perfect alternation and excellent proportion between intermediate waves (2) and (4).
Within intermediate wave (5), no second wave correction may move beyond the start of its first wave below 2,594.62.
DAILY CHART
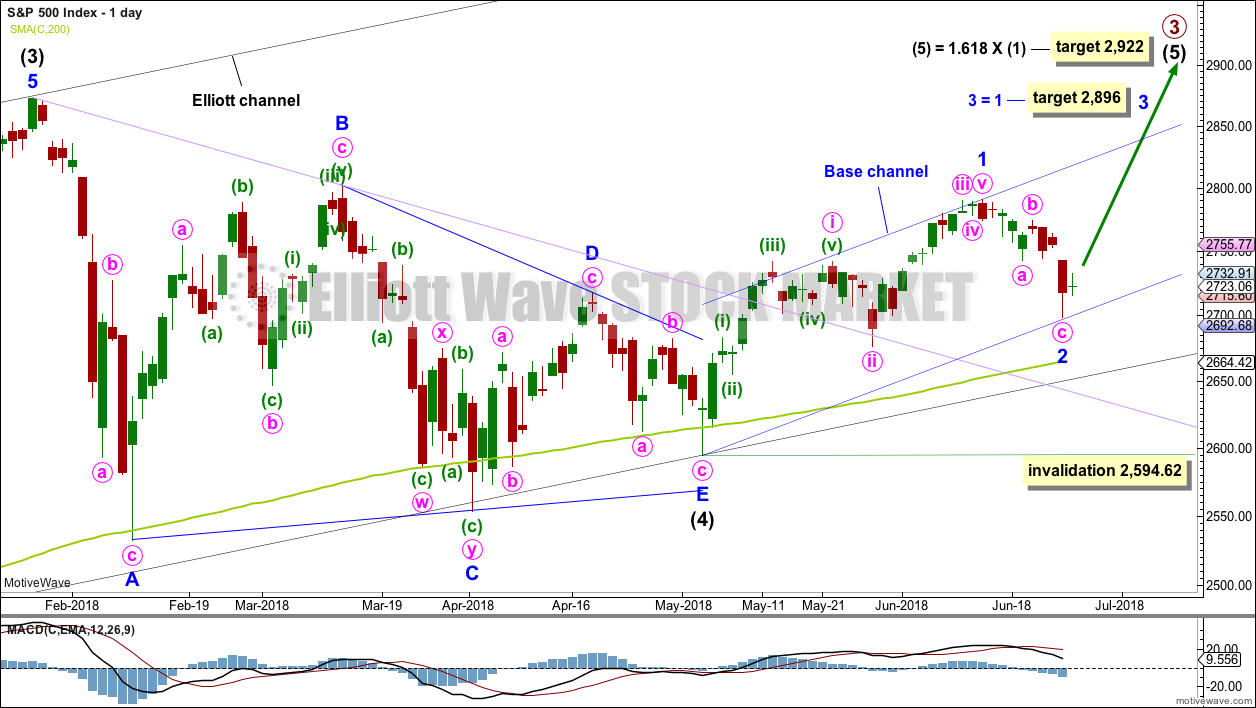
It is possible that intermediate wave (4) is a complete regular contracting triangle, the most common type of triangle. Minor wave E may have found support just below the 200 day moving average and ending reasonably short of the A-C trend line. This is the most common look for E waves of triangles.
Intermediate wave (3) exhibits no Fibonacci ratio to intermediate wave (1). It is more likely then that intermediate wave (5) may exhibit a Fibonacci ratio to either of intermediate waves (1) or (3). The most common Fibonacci ratio would be equality in length with intermediate wave (1), but in this instance that would expect a truncation. The next common Fibonacci ratio is used to calculate a target for intermediate wave (5) to end.
Price has clearly broken out above the upper triangle B-D trend line. This indicates that it should now be over if the triangle is correctly labelled.
A trend line in lilac is added to this chart. It is the same line as the upper edge of the symmetrical triangle on the daily technical analysis chart. Price found support about this line.
Minor wave 1 may have been over at the last high. Minor wave 1 will subdivide as a five wave impulse on the hourly chart; the disproportion between minute waves ii and iv gives it a three wave look at the daily chart time frame. The S&P does not always exhibit good proportions; this is an acceptable wave count for this market.
If minor wave 2 is over here, then subsequent corrections along the way up may find support at the lower edge of the base channel. If minor wave 2 moves lower, then the base channel must be redrawn.
A target is calculated for minor wave 3, which fits with the higher target for intermediate wave (5).
Minor wave 2 may not move beyond the start of minor wave 1 below 2,594.62.
HOURLY CHART
The zigzag for minor wave 2 may be complete. There would be a good Fibonacci ratio between minute waves a and c.
A best fit channel is drawn about the downwards zigzag. A breach of the upper edge of this channel would provide earliest confidence that a low is in place. A new high above 2,744.39 would invalidate the alternate idea below and provide further confidence that a low is in place.
The target expects only to see equality in length with minor waves 1 and 3 because this target fits with the higher target on the daily chart for primary wave 3 to end.
Within minor wave 3, no second wave correction may move beyond the start of its first wave below 2,698.67.
ALTERNATE HOURLY CHART
This wave count is identical to the first hourly chart up to the low labelled minuette wave (iii) within minute wave c. Thereafter, it looks at the possibility that minuette wave (iv) is longer lasting as an expanded flat correction. This gives perfect alternation and good proportion between minuette waves (ii) and (iv).
If minor wave 2 is continuing lower, then it may end close to the 0.618 Fibonacci ratio of minor wave 1 about 2,670.
Minor wave 2 may not move beyond the start of minor wave 1 below 2,594.62.
This wave count has a little support today from classic technical analysis. The doji candlestick with a lack of support from volume looks more likely to be a small correction than the start of a third wave up.
ALTERNATE DAILY CHART
Thank you Peter for outlining this idea in comments. When charted it has a good look.
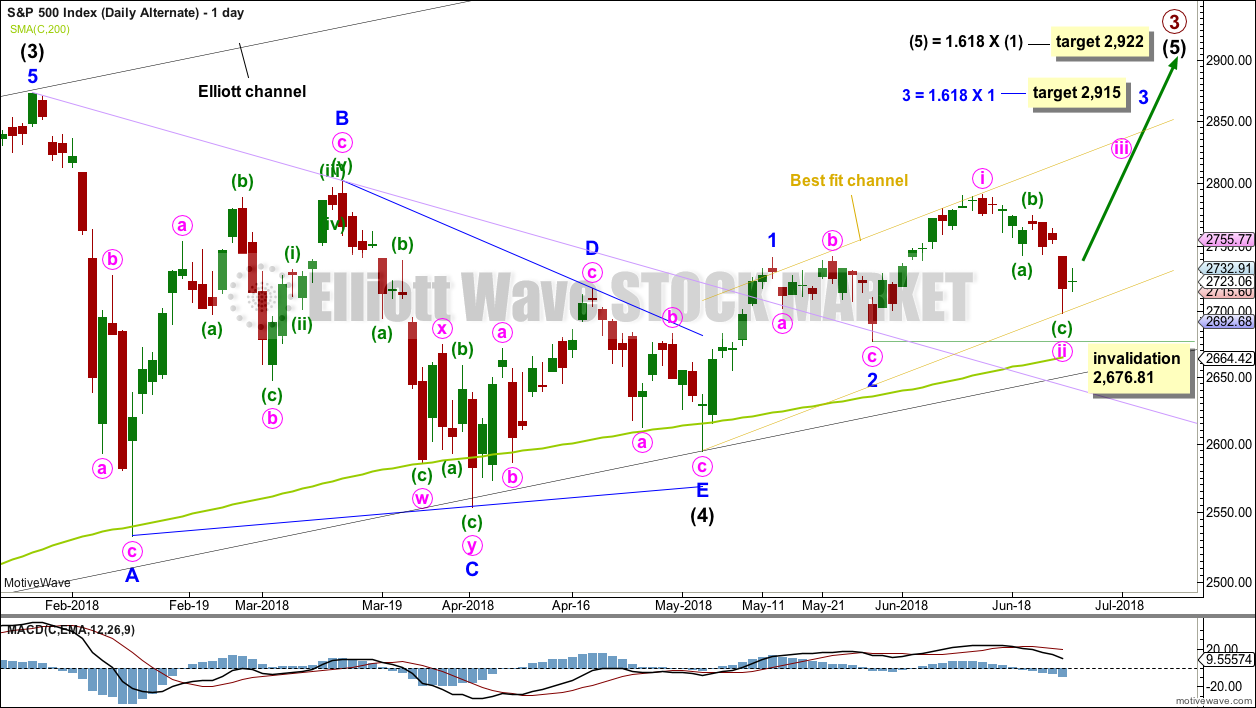
It is possible that minor waves 1 and 2 are already over. The last high may have been minute wave i. Minute wave ii may have ended yesterday, or it may need one more low to be complete (as per the two hourly charts above).
Minute wave ii is a 0.81 depth of minute wave i. If minute wave ii does continue lower, then it may not be by much. Minute wave ii may not move beyond the start of minute wave i below 2,676.81.
This alternate wave count resolves the problem of an odd looking minor wave 1 for the main wave count. The only problem with this alternate wave count is minute wave ii is not contained within a base channel which would be drawn about minor waves 1 and 2. For this reason, I have drawn a best fit channel; its lower edge may provide some support along the way up for future pullbacks.
This wave count is very bullish. It expects to see a very strong upwards movement as the middle of a third wave begins here or within a very few days.
TECHNICAL ANALYSIS
WEEKLY CHART
Click chart to enlarge. Chart courtesy of StockCharts.com.
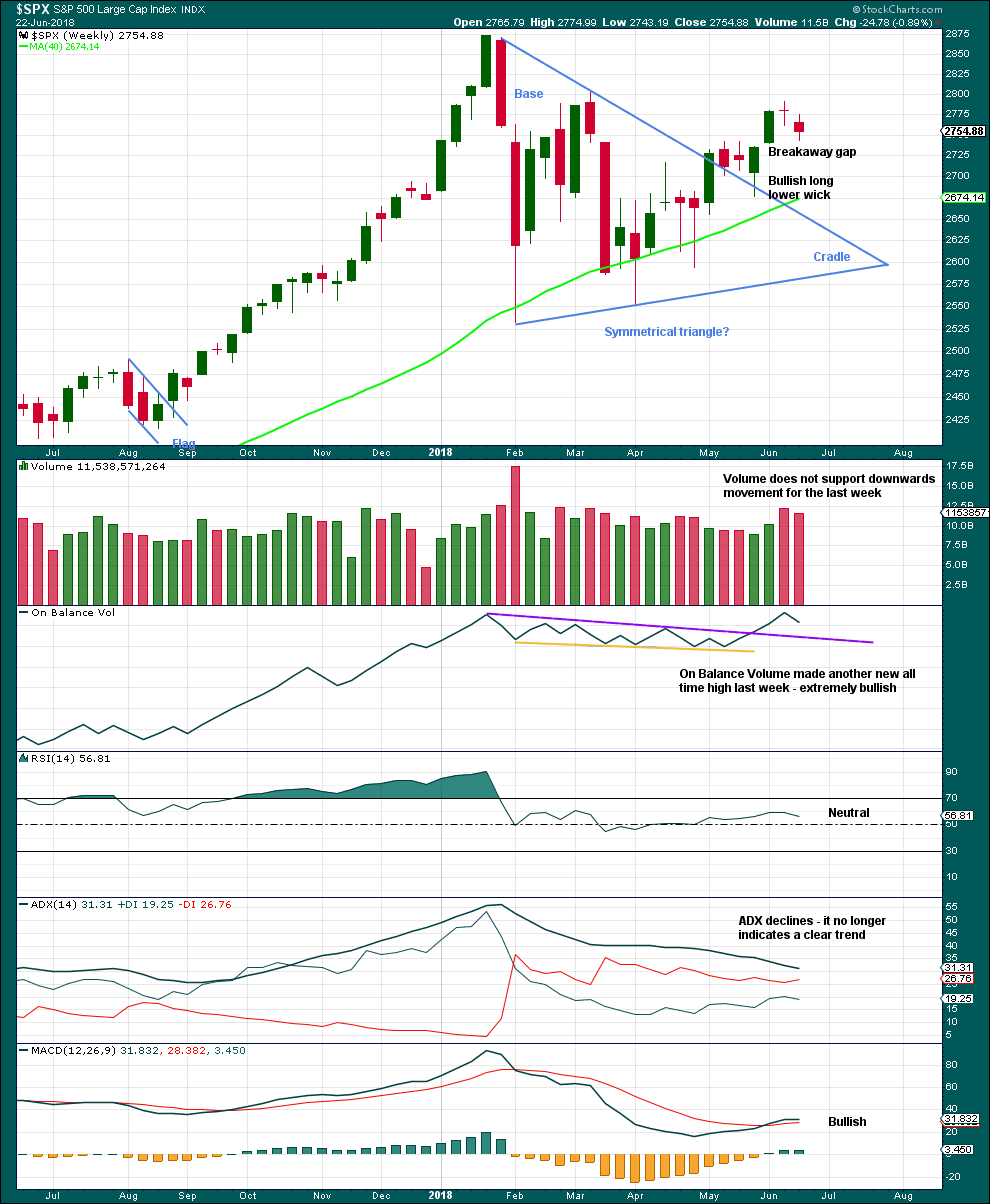
Last week’s spinning top candlestick pattern again signals a balance of bulls and bears. With volume not supporting downwards movement, it looks like bears may be tiring.
This chart is very bullish.
DAILY CHART
Click chart to enlarge. Chart courtesy of StockCharts.com.
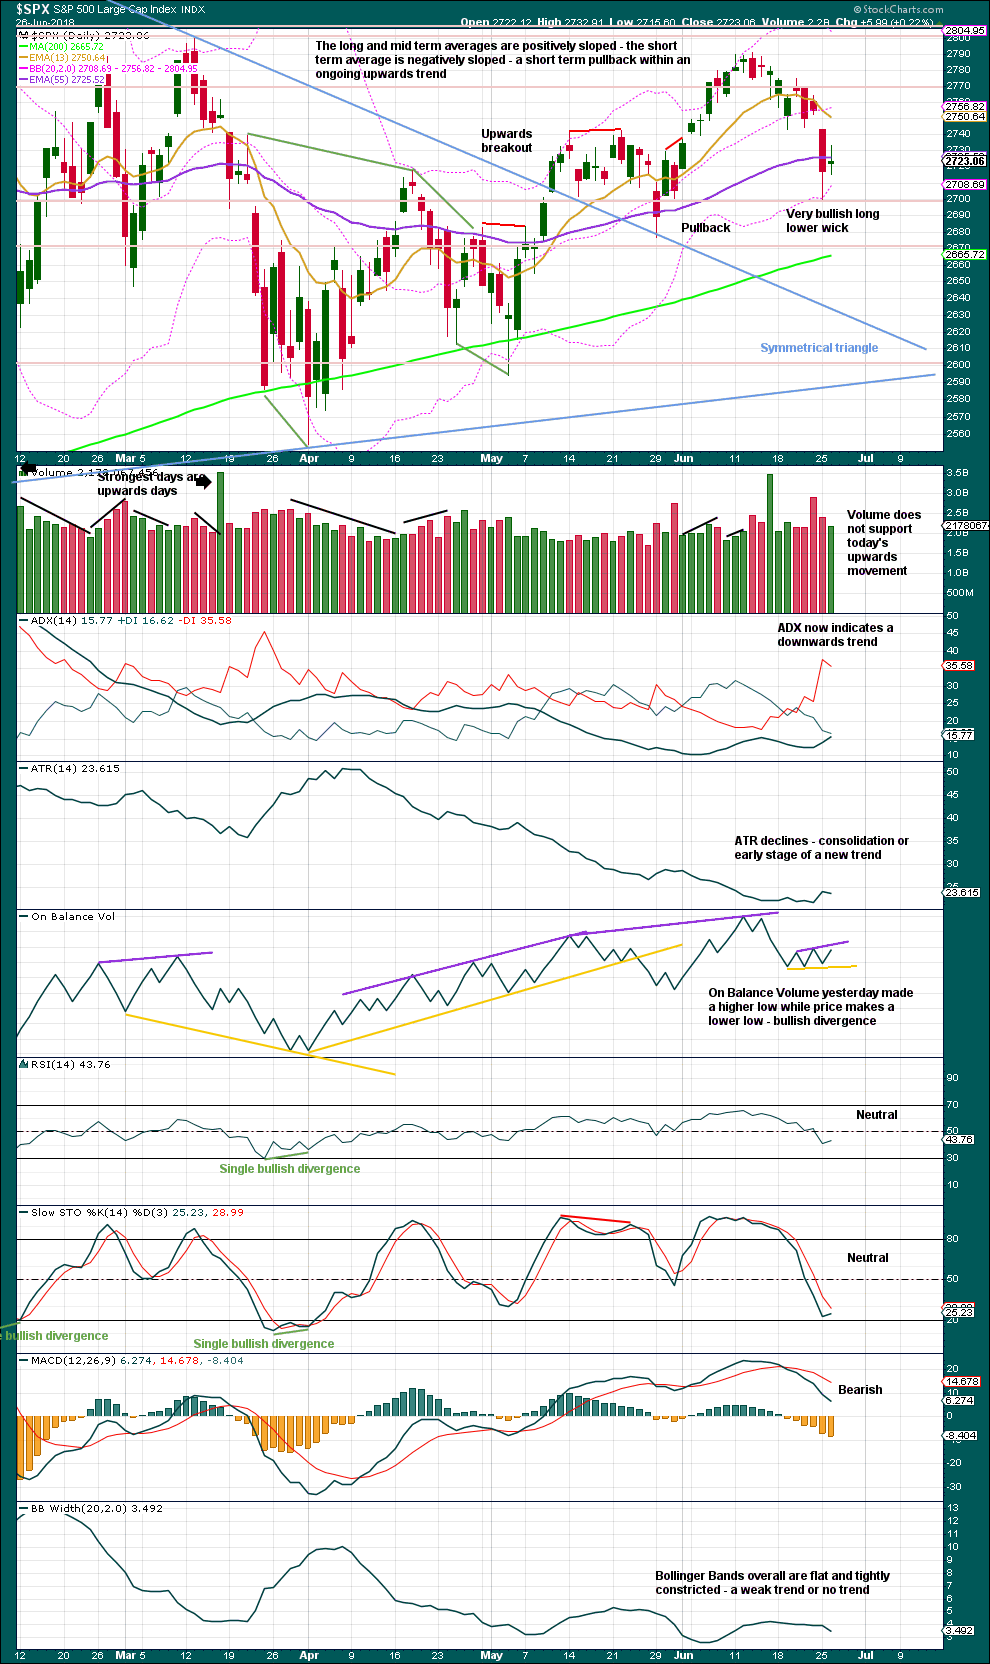
The symmetrical triangle may now be complete. The base distance is 340.18. Added to the breakout point of 2,704.54 this gives a target at 3,044.72. This is above the Elliott wave target at 2,922, so the Elliott wave target may be inadequate.
Since the low on the 2nd of April, 2018, price has made a series of higher highs and higher lows. This is the definition of an upwards trend. But trends do not move in perfectly straight lines; there are pullbacks and bounces along the way. While price has not made a lower low below the prior swing low of the 29th of May, the view of a possible upwards trend in place should remain.
This last low is right about support at about 2,700. The long lower wick is very bullish, and with a series of long lower wicks within this pullback, together they may be read as a warning sign that on each of those days the bears were not able to hold the lows. This is bullish.
So far this looks like a typical pullback within an ongoing and developing upwards trend.
Today did not complete convincing upwards movement, and the small doji lacks support from volume. It looks like the pullback may not be quite complete.
The last signal from On Balance Volume remains valid and is bullish.
VOLATILITY – INVERTED VIX CHART
Click chart to enlarge. Chart courtesy of StockCharts.com. So that colour blind members are included, bearish signals
will be noted with blue and bullish signals with yellow.
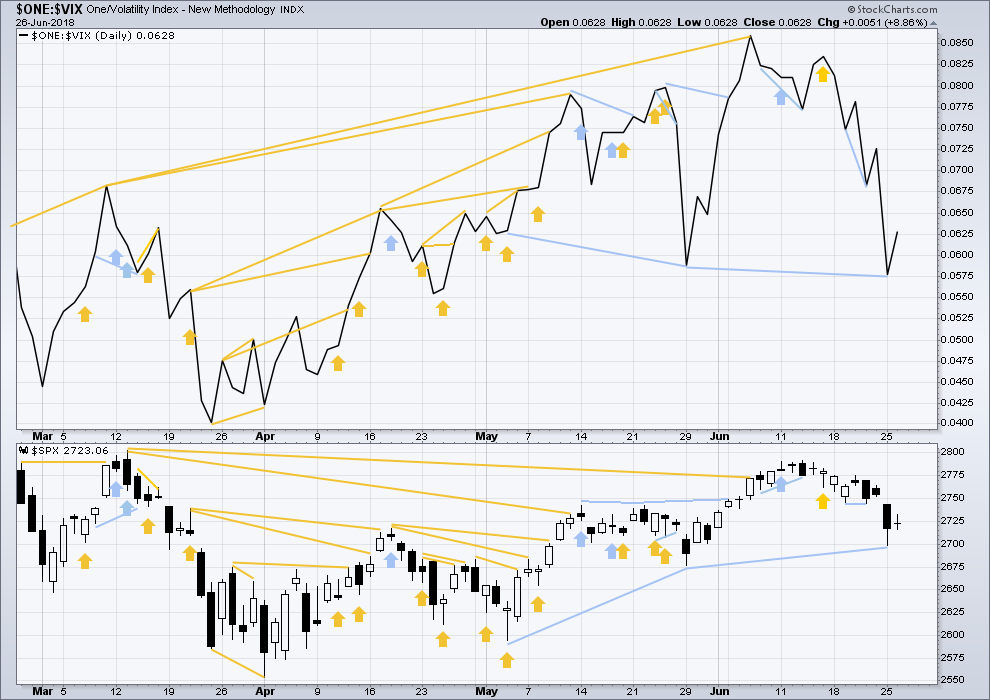
Normally, volatility should decline as price moves higher and increase as price moves lower. This means that normally inverted VIX should move in the same direction as price.
Inverted VIX has made a new high above the prior swing high of the 9th of March, but price has not made a corresponding new swing high about the same point yet. This divergence is bullish. Inverted VIX is still a little way off making a new all time high.
There is mid term bearish divergence between price and inverted VIX: inverted VIX has made a new swing low below the prior swing low of the 29th of May, but price has not. Downwards movement has strong support from increasing market volatility; this divergence is bearish. However, it must be noted that the last swing low of the 29th of May also came with bearish divergence between price and inverted VIX, yet price went on to make new highs.
This divergence may not be reliable. As it contradicts messages given by On Balance Volume and the AD line, it shall not be given much weight in this analysis.
There is no new divergence today.
BREADTH – AD LINE
Click chart to enlarge. Chart courtesy of StockCharts.com.
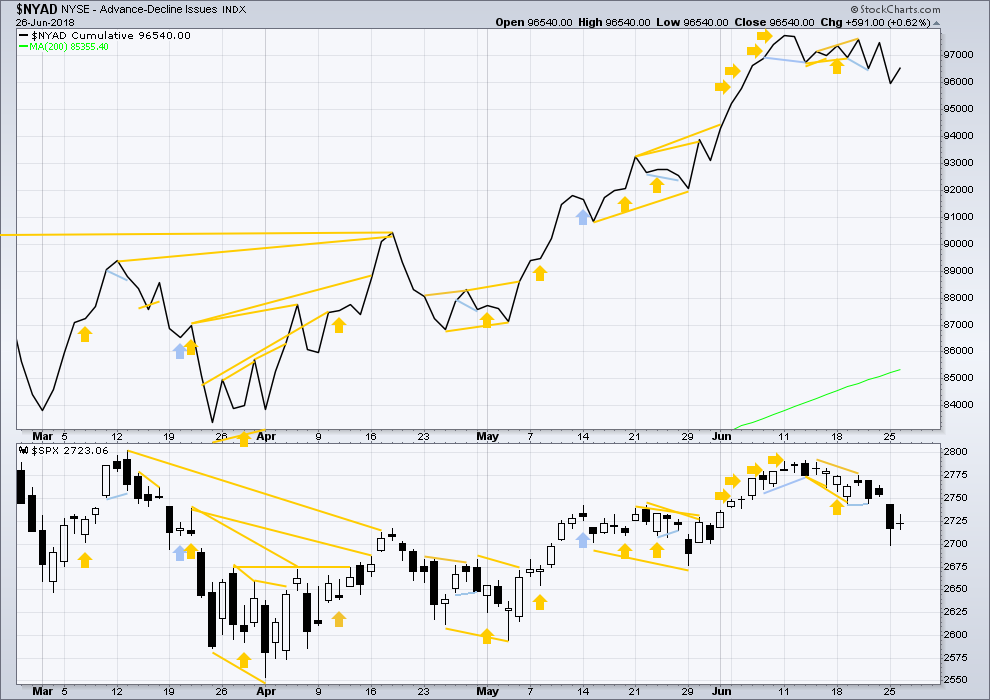
There is normally 4-6 months divergence between price and market breadth prior to a full fledged bear market. This has been so for all major bear markets within the last 90 odd years. With no longer term divergence yet at this point, any decline in price should be expected to be a pullback within an ongoing bull market and not necessarily the start of a bear market. New all time highs from the AD line means that any bear market may now be an absolute minimum of 4 months away. It may of course be a lot longer than that. My next expectation for the end of this bull market may now be October 2019.
Small caps and mid caps have both recently made new all time highs. It is large caps that usually lag in the latter stages of a bull market, so this perfectly fits the Elliott wave count. Expect large caps to follow to new all time highs.
Breadth should be read as a leading indicator.
Both price and the AD line moved higher today. There is no new divergence.
Overall, the AD line still remains mostly bullish as it has made more than one new all time high last week. Price may reasonably be expected to follow through in coming weeks.
DOW THEORY
The following lows need to be exceeded for Dow Theory to confirm the end of the bull market and a change to a bear market:
DJIA: 23,360.29.
DJT: 9,806.79.
S&P500: 2,532.69.
Nasdaq: 6,630.67.
Only Nasdaq at this stage is making new all time highs. DJIA and DJT need to make new all time highs for the ongoing bull market to be confirmed.
Charts showing each prior major swing low used for Dow Theory may be seen at the end of this analysis here.
Published @ 08:31 p.m. EST.

The RUT down move is now several days long, and looks on the daily like it is potentially complete. Down to a combination of 38% retrace and key support. Could be a buying opportunity with triggers.
Similarly, the NDX daily is getting support at its 50 day. “This is just a down swing in a bull market.” Until it isn’t anymore, but right now, that’s what it is.
And of course, this remains entirely valid.
The confidence point changes.
I’m really sorry guys. I think my invalidation point on the hourly alternate was not quite high enough to allow for this possibility also.
It’s still possible that price may yet make one more low.
Yep yep yep! 🙂
Verne,
I am sure if it was not for the ramp early in the trading day, markets would have had much worst drop than what we have seen. As I had mentioned a few weeks back, lows in the market is due over the coming days into the month end. BTW, NASDAQ is going to see much pronounced drop that was saved by ramp today in the opening hours.
I agree. The artificial ramp this morning had all the characteristics of a “C” wave and that is the reason both Chris and I shorted it. C waves are classic “shake the trees” and always retrace in their entirety. Nasdaq issued a powerful sell signal last week so I strongly suspected the other indices, especially SPX which is tech heavy, would follow. As I opined, the banksters were tilting at windmills and I suspect we are not quite done because of the pattern I am tracking in Nasdaq. I think we see a bounce then another final leg down. I was disciplined and took some off the table but I expect more droopage…. 🙂
How do you guys explain CB market manipulation this morning relative to all of today’s price action? Did the CB’s give up? Do they only manipulate for fix short periods (and if so…what is the goal and value of that?). Or was their plan today to set up a big shorting opportunity?
You see, if they intervene for only “a little bit” with a goal of effecting the longer term time frame, it’s not much different than pissing into the wind, is it? On the other hand…propping up the market to immediately get positioned the other way, sure, markets probably get manipulated like that all the time.
I just can’t see how this theory of frequent CB intervention for the purpose of longer term price support hangs together in a framework of rational trading behavior. I’m probably missing something.
We will never know. Maybe they were trying to wipe out shorts so they could pic up all the contracts
To Jerry’s point, as nefarious and manipulative as they are, I’m not sure they know what the are doing or what they’ve done to the markets. All I know is short interest exploded around 10:30 am Kevin. Also, Kevin, I will repeat this until blue in the face, IT IS NOT A THEORY. Read into that what you want to….
I don’t doubt the CB’s are active in the market. That’s not the question. I don’t even doubt that they are sometimes heavy buyers and drive the market up a bit. The question on the table is “effective manipulation”? To what end? And using what techniques? To support price in the longer term? Would that not require massive and fairly continuous firepower? We can clearly see that’s not the case.
Great logic and questions Kevin. What we are aware of is the use of cash futures purchasing, short VIX, and short Gold futures positioning and the coordinated use desk relationships to run stops and push algos. Because futures are cash settled a lot of the selling absorption can go by unnoticed as they hit control P, buy, and try to turn the market. To what end? I’m at a loss other than maybe political weaponization, and yes the flows are out so how the heck does price move higher?!?
My theory is that big exits are being covered. Just look at the candles…!
I was leaving that bit of analysis out VERNE, lol. Can’t give up everything. When you break the candles down sequentially from 10-5-3-1 min, the truth is as plain as day.
Oops! Did I say too much?! 😀
I think it is quite obvious folk… RUN THE STOPS! Of weak hands, that is… 🙂
Kevin,
I am sure the market reaction would have been far more severe if it was not for the ramp early in the trading day. Still few days left to get the job done.
Again I agree. This morning fututures were looking quite ominous and they simply cannot allow development of runaway unbridled downside momentum. They tried mightily and failed to defend 2720 in ES. The upside ramp no doubt resulted in many bears bailing instead of adding short trades, which would have seen a waterfall decline. What we are seeing is a dress rehrarsal of sorts, the shape of things to come…
Taking the money and running on 1/4 long vol trades.
Hey Bo, why don’t you pick Chris’ brain and ask him why he went long vol after that surprise ramp this morning? 😉
VIX flying a massive bull flag…you know what to do…! 😉
best guess 30 year 145″240 145″310 to finish wave E
10’s 120″220- 120″240 maybe tonight?
150.00 dude…ONE FIFTY!!! 🙂
For TLT, that is…
For nimble traders, the DJI island gap reversal in the middle of the downtrend should yield a quick double on short dated puts.
We could be about to see a third down unleashed… 🙂
There WILL be blood…
There are ultimately consequences to financial malfeasance, no matter what others may assert to the contrary…please be careful out there folks.
I’ve got a highly counter-trend short (a spread with very limited risk) on COST. Retail is soooooo extended, and this is a stock that should be getting end of month “window dressing” buying this week, but it’s been flat and just oscillating in a small range for the last few days. To me, that’s bearish. The hourly is in a 12+ hour squeeze. I’m quite suspicious that come next week, there a bout of profit taking here.
TLT approach a key decision level at 122.5. At the weekly level, price is oscillating between 116 and 122.5. You can see the huge resistance from the pivot lows in 2017. A nice trade will set up here either short on a turn off 122.5, or a long on the the breakthrough, with the next target all the way up at 128.5.
It is going to 150.00 . You can set it and forget. Throw 10K at a few select options and take your double in the nexe 8- 10 months. (educational purposes only, you understand! 🙂 )
RUT completed what looks like a 3,3,5…..
Interesting. Here’s the monthly. Note the squeeze!! Last 2 were both followed by massive high momentum moves (one down, one up). Everything’s point to up here. The trend pattern indicates it’s likely to ride something like the anticipatory TL I’ve sketched in.
I’ll wait for the resistance at 122.50 to break, then saddle up. How big a horse I get remains to be seen. My plan would be to unload 1/2 at 128, and take a shot at >140 with the 2nd. Why not. Tight stop; it rides that TL or I’m gone.
LYB has pulled back for 3 weeks, is in a weekly squeeze, has polarity inverted to up trend at the daily level, and broken the downtrend line at the daily/hourly time frames. I like the set up.
Smart money buying insurance with both hands. Long vol positions ( VXX , UVXY, VIXY)
all sporting bull flags…
Selling FXE 11.00 strike puts from spread for a small profit, even though I was wrong and Kevin was correctamundo! 🙂
Waiting for a turn….
Sure looks like it might bounce around in this 110.5 – 113.5 range, and that’s a fat one. I will be considering a bull spread if I see 110.5 holding.
I am giving a bit more safety margin with a 107/109 spread and executing a bigger lot. Unless I get raided by the market markers, hard to see it going in the money.
You just watch. There will be a “strange” spike down below 109 as soon as I sell those credit spreads…lol!
Does anyone else find gaps down in the middle of an impulsive third wave up just a teeny bit suspicious?
If you do, you are not alone… 🙂
RUT in the red…
Oil going off like a rocket. Gold continuing to collapse. Dollar rising. US Interest rates falling. Market swinging back to bull mode.
What’s it all mean? I dunno. Except that my oil related longs that were underwater are coming back to life here there and everywhere! FANG and RSPP paid me today. OIH should be next. I need more out of HAL, but at least it’s finally rounded back up and is headed the proper direction!!
Fibo resistance levels on the move back up.
It’s moving up faster than I can erase old levels, lol!!!
Based on SPX futures (/ES) with overnight data.
oops, wrong chart!!! excuse me….here’s the correct one.
Wow… what a move from down to up! About 1 – 2 min.
Futures displaying quite a case study in bankster brinksmanship. They seem determined to avoid taking out Monday’s lows. lol!
Will they succeed?
Unless we get a possible fifth wave truncation, the y are tilting at windmills.
Have a great trading day!
Incredible manipulation, painting the tape still, 10 years in to a so called recovery. Folks there’s no fundamentally or economically drive upside left in this market, just the gaming of the indexes. This is a very dangerous market and so only be traded by professionals.
Chris you know my views about what these guys have been doing for years and this is really nothing new. I do have to say, as cynical as I am, I am starting to get a really bad feeling about what I am now seeing.
Folk, take the man’s advice. Be very careful out there.
Yes bud, despite the natural contrarian case at this juncture, the capital markets loss of independence has placed all astute investors and traders in a complete state of disbelief and shock. Lara, let me pose a question….Do you believe it is at all possible that 16 indexes across the Europe and the West would have an average peak to trough swing of 130 basis points in the span of 90 seconds from organic buyers and market participants? Re-loading VIX out of sheer principle.
Absolutely Mind-Blowing!!
Only possible by CO-ORDINATED CB activity. Period!!!
Where does this put the EW analysis if the manipulation decides the next move. Dow moved 200 plus points on one announcement on trade war…Unreal. I don’t know if this market will ever be allowed to correct. I am loosing my confidence in TA. At least for the last 10 yrs this same manipulation has made mockery of EW and other TAs.
Your are correct, even quants/CMT like me are rendered pretty much useless. All analysis, not just TA is nearly worthless. Even money flow indicators are now useless. The psychological damage the manipulation has caused is the set up for a super cycle bear, 1929 round two coming soon.
200 points is less than 0.1%. As far as I am aware, most EW theorists maintain that manipulation itself is an fundamental aspect of the market and should not affect long term patterns. Otherwise why are we even here? Lara has repeatedly stated her conviction that we seeing a 4th wave correction within a bull market, and that the larger bear market is still a ways away.
Everyone is aware there are algorithms that follow each other across the indices and create coordinated price action. My question is, if you believe a 130 basis point move represents manipulation, who are they trying to job? Who is losing out? We had flash crashes in the past which in the end turned out to be individual traders gaming the order books, and had very transient effects on the markets. Don’t respond to such obvious chicanery and you most likely won’t be affected.
What baffles me most is how people seem to pretend this is something new. It has been going on since the beginning of time.
Who knows all that goes on behind the scenes.
Did you know, for example, that banks and brokerages share with each other confidential information about their clients’ trading and investing strategy? This iincludes timing of planned purhases, position sizes, stop losses, etc. etc.
Some of these spastic and erratic market moves may appear random to us but I assure you, there is probably a method to the madness.
Lots of stops were violently run this morning no doubt.
Of course it’s possible.
Just like it’s possible I guess for me to fly to the moon.*edit: I am getting the question confused here, sorry. What I should have said here is, yes it’s possible, because the price history shows that the swing happened.If it’s intervention / interference… whatever you like to call it… of the central banks, then yes, they’re manipulating the market.
But, and this is the key point, the bankers are part of the market. They can only operate in a social environment that condones their intervention.
I keep coming back to what happened in China when their stock market crashed. Nothing the Chinese Communist Party did could hold up price, and they did everything possible. They are as close to a God of markets as there ever will be, they don’t have to follow any rules.
The lesson there IMO is that interference or manipulation may be able to produce short term swings, make highs higher or lows lower, but it cannot change a major trend.
When this bull market shifts to a bear market, there will be nothing that can stop it.
And if the CCP could not stop price falling in their bear market, then logically market manipulation cannot stop a bull market rise either.
Couldn’t have said it better myself Lara. Your exquisite point about “operating in a social environment that condones their intervention” is very very true, and then certainly conditional. Even the last few days the China National Team couldn’t stop the selling. All in due time, I just crave and desire a return to healthy and volatility and free price discovery.
The market is behaving according to our EW map. That’s all I ask for. I couldn’t care less about “manipulation”. Call me ignorant if you wish (I probably am). But I’ve got money to make and as long as the EW count is working, I’m on it. If/when price starts misbehaving frequently re: count specifics, then I’ll be upset. Not until. Let ’em manipulate this market all the way to new ATH’s. Fine by me!! And when the eventual complete collapse of the economic system comes and we start the Greater than the Great Depresssion…I’ll be short in plenty of time. It’s not going to collapse in a day; there will be leading indicators of severe illness and risk. Those are not present right now, per Lara’s exceptional historical analysis of market tops.
I’m surprised you think the EW count is working since it’s been constantly wrong since 2013. Please don’t make me list all the turning points/alternates being busted. Not caring that the price action and price discovery processes are real, and not manipulated is kinda of like not caring that when you go to your primary care physician for a physical but instead of a nurse or MD administering it, there’s a 300 pound DMV employee waiting with a glove……
I’ll keep an eye out for those gorillas.
Be sure to throw ’em a few BANANAS! 🙂
Then excuse me for asking, but why are you here? I am not trying to be rude, but I am consistently baffled why you and Verne hang out here and laud your amazing short side doubles and triples when Lara is calling for overall upwards movement. No market analysis is perfect. I for one appreciate Lara’s level headedness and determination to focus solely on price action instead of building a narrative based on Trump’s tweets like everyone on fintwit. Once again, I am not trying to offend but I just wonder what your motivation is since you don’t seem to have a high opinion of EW analysis and constantly trade against Lara’s version.
Can you also explain in what ways you think there are more inorganic forces working than in the past? Despite the efforts bankers go through to conceal balance sheets, I still believe there is more transparency compared to when we all got our news from the morning paper. Of course it was reported on less in the past, but it doesn’t mean it wasn’t happening. Black Monday makes any flash crash in recent years look like peanuts.
I’m sorry you can’t comprehend why I would trade what my analysis suggests and believe what my 15 years of market experience (I’m 36) would instinctually lead me to believe. Very simply, I value Lara’s analysis immensely and yes Verne and I make doubles and triples no matter what side we trade on because we know derivatives work and we know counter-trend trading. The dominance of passive distorts organic buyers and sellers just as the central bankers manipulation. You can simply heed the friendly warning or not. There is more disinformation and manipulation then there ever has been in the past, but clearly you don’t have to take my word for it. Oh and how’s my long VIX trade looking today?!!?
No need to get testy with me, I was just wondering because by your posts one would get the impression you are virtually always on the short side… which I realize is not actually the case, but the point is that I don’t quite understand in what ways you are putting Lara’s analysis to work. I contrast that with Kevin’s posts which often discuss implementing both long and short trades that stem from Lara’s most recent wave counts.
That’s nice but your VIX trades are working out recently, although you did also say in February (shortly after VIX hit 50) that VIX was going to 90 by the next week and there would be a major bank failure.
Did not intend to get testy, so forgive me if that’s how it came off. And for the record, nearly all my trades on VIX are profitable. As it relates to the bank failure, I underestimated the willingness of the CBs to continue propping up zombies, but plenty will come down the pike soon, as will VIX 90. As Verne said, we are taking time to post so that others may learn, whether we make money or not. And BO I’m so jaded I don’t even care if I make money or not, cause there always another trade.
I am here because I think Lara is one of the best at what she does. Chris and I could make all our trades quietly an keep our mouths shut, and I suspect that is mostly the case. We talk about trades to share with other members our perspective based on our trading experience and not to brag or diminish Lara’s analysis. As you no doubt noticed, I am often wrong! 🙂